
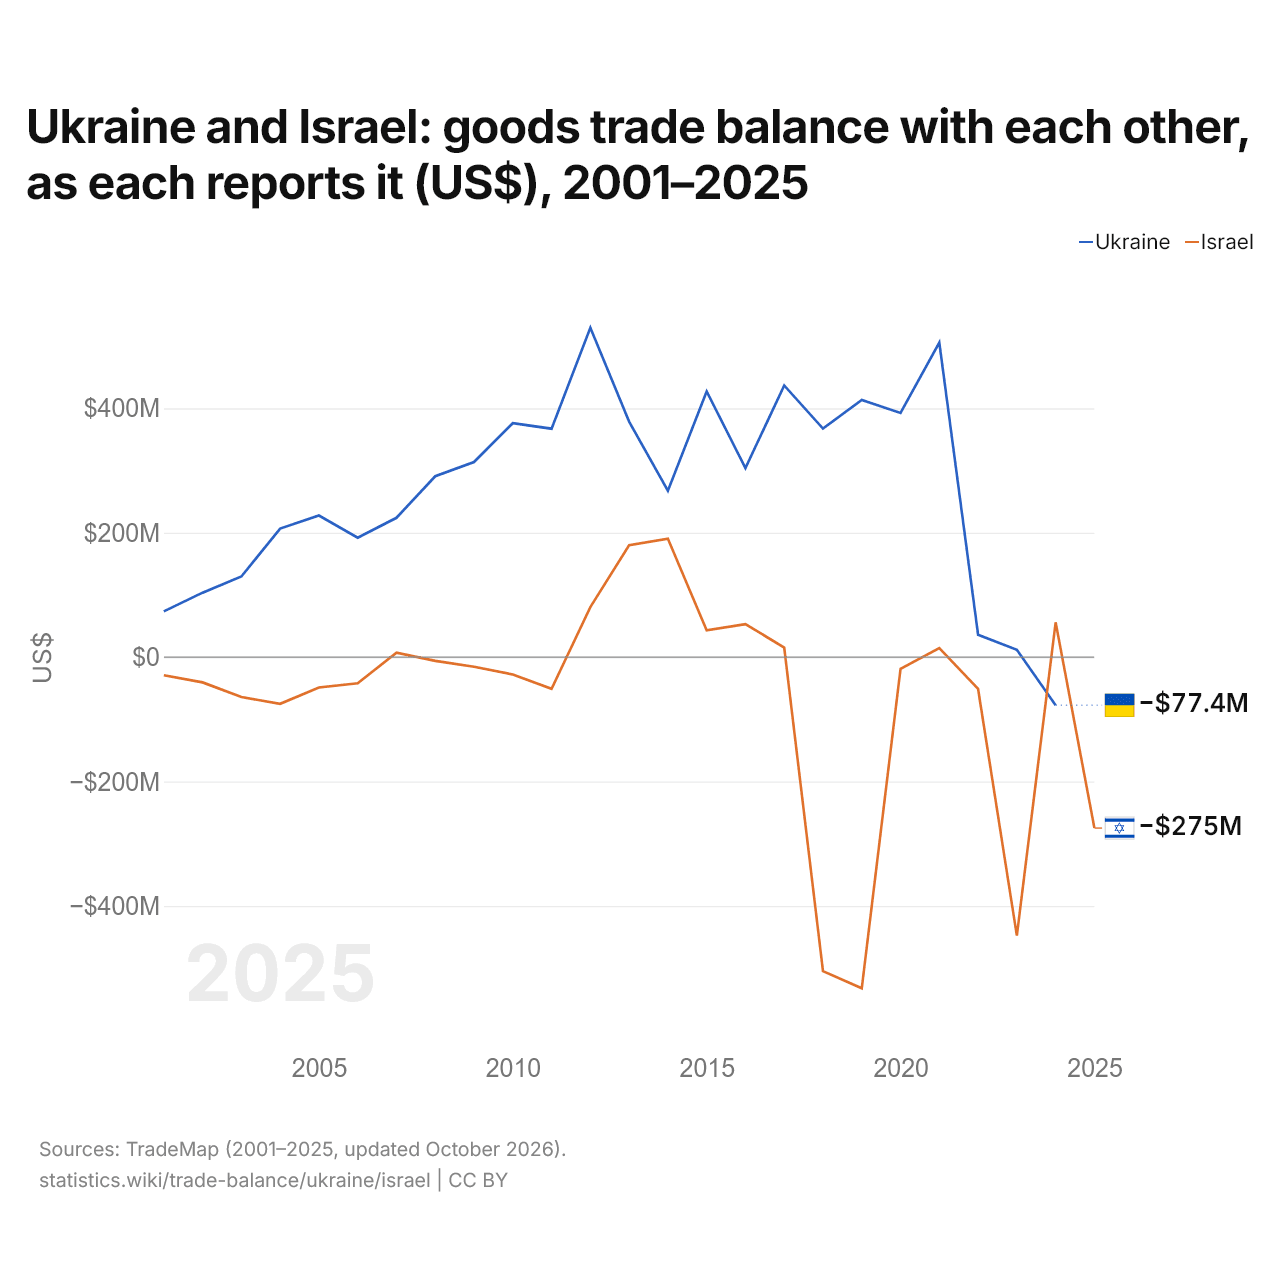
L'Ukraine et Israël : solde de leur commerce de biens bilatéral, selon chacun ($ US), 2001–2025
| Année | $ US | |
|---|---|---|
| Ukraine | Israël | |
| 2025 | - | −274 858 000 $ US |
| 2024 | −77 406 000 $ US | 55 945 000 $ US |
| 2023 | 11 742 000 $ US | −447 724 000 $ US |
| 2022 | 36 030 000 $ US | −51 117 000 $ US |
| 2021 | 505 843 000 $ US | 14 616 000 $ US |
| 2020 | 392 470 000 $ US | −18 710 000 $ US |
| 2019 | 413 350 000 $ US | −532 397 000 $ US |
| 2018 | 367 363 000 $ US | −504 791 000 $ US |
| 2017 | 436 726 000 $ US | 15 472 000 $ US |
| 2016 | 303 751 000 $ US | 52 990 000 $ US |
| 2015 | 427 119 000 $ US | 43 162 000 $ US |
| 2014 | 267 430 000 $ US | 190 284 000 $ US |
| 2013 | 378 635 000 $ US | 179 900 000 $ US |
| 2012 | 529 583 000 $ US | 80 399 000 $ US |
| 2011 | 367 259 000 $ US | −50 864 000 $ US |
| 2010 | 376 108 000 $ US | −27 885 000 $ US |
| 2009 | 313 725 000 $ US | −15 512 000 $ US |
| 2008 | 290 783 000 $ US | −6 038 000 $ US |
| 2007 | 223 984 000 $ US | 7 244 000 $ US |
| 2006 | 192 028 000 $ US | −42 108 000 $ US |
| 2005 | 227 697 000 $ US | −48 755 000 $ US |
| 2004 | 206 699 000 $ US | −75 040 000 $ US |
| 2003 | 129 622 000 $ US | −64 158 000 $ US |
| 2002 | 103 653 000 $ US | −40 615 000 $ US |
| 2001 | 73 494 000 $ US | −29 090 000 $ US |
Selon l'Ukraine, son commerce de biens avec Israël affichait un déficit de 77,4 millions de dollars ; selon Israël, son commerce de biens avec l'Ukraine affichait un excédent de 55,9 millions de dollars. En 2001, les chiffres étaient un excédent de 73,5 millions de dollars pour l'Ukraine et un déficit de 29,1 millions de dollars pour Israël.
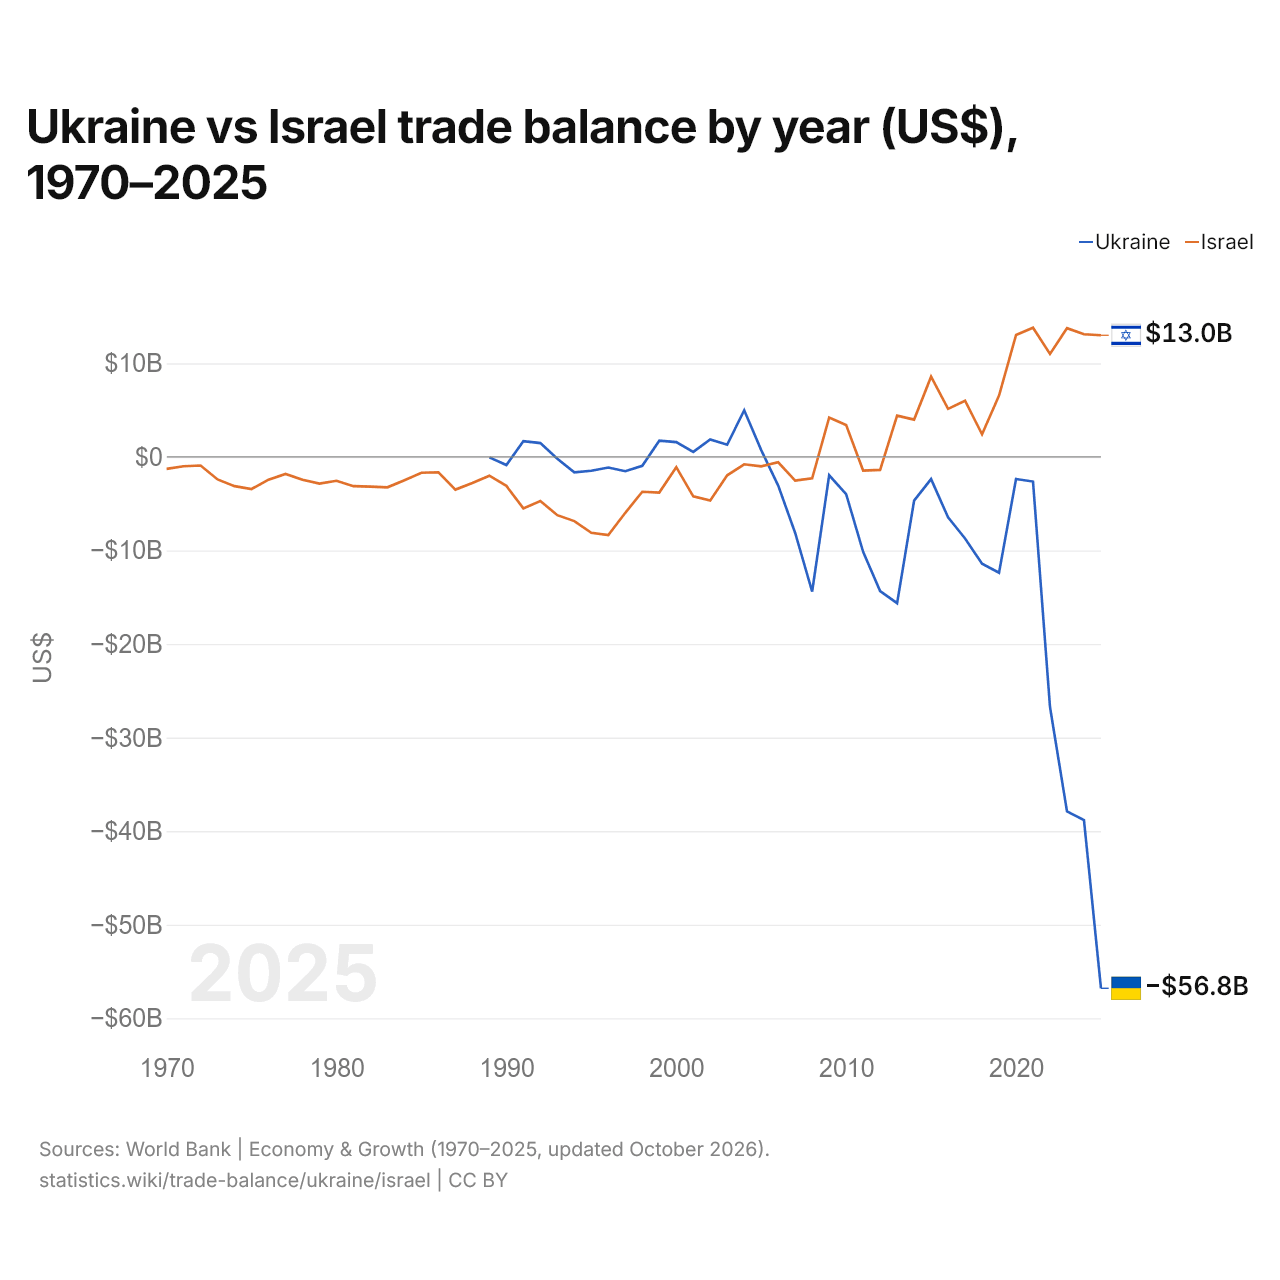
Ukraine vs Israël : balance commerciale par année ($ US), 1970–2025
| Année | $ US | |
|---|---|---|
 Ukraine |
 Israël |
|
| 2025 | −56 800 122 814 $ US | 12 994 365 505 $ US |
| 2024 | −38 824 137 717 $ US | 13 100 279 099 $ US |
| 2023 | −37 891 022 997 $ US | 13 754 663 733 $ US |
| 2022 | −26 738 449 230 $ US | 11 000 808 302 $ US |
| 2021 | −2 639 467 168 $ US | 13 804 496 055 $ US |
| 2020 | −2 369 876 403 $ US | 13 021 165 408 $ US |
| 2019 | −12 384 279 577 $ US | 6 557 503 906 $ US |
| 2018 | −11 425 933 031 $ US | 2 413 018 727 $ US |
| 2017 | −8 726 414 190 $ US | 6 004 796 901 $ US |
| 2016 | −6 463 928 654 $ US | 5 128 475 225 $ US |
| 2015 | −2 377 052 775 $ US | 8 575 319 326 $ US |
| 2014 | −4 680 457 309 $ US | 3 984 226 053 $ US |
| 2013 | −15 634 054 798 $ US | 4 406 103 796 $ US |
| 2012 | −14 346 462 765 $ US | −1 392 248 402 $ US |
| 2011 | −10 147 770 404 $ US | −1 462 187 515 $ US |
| 2010 | −3 977 373 467 $ US | 3 412 251 219 $ US |
| 2009 | −1 967 337 677 $ US | 4 198 677 110 $ US |
| 2008 | −14 394 497 592 $ US | −2 287 048 495 $ US |
| 2007 | −8 130 891 089 $ US | −2 539 773 861 $ US |
| 2006 | −3 069 900 990 $ US | −575 153 283 $ US |
| 2005 | 724 526 116 $ US | −1 009 500 635 $ US |
| 2004 | 4 982 327 505 $ US | −793 186 301 $ US |
| 2003 | 1 298 219 585 $ US | −1 975 804 879 $ US |
| 2002 | 1 864 970 784 $ US | −4 669 753 894 $ US |
| 2001 | 539 267 698 $ US | −4 222 578 168 $ US |
| 2000 | 1 572 910 572 $ US | −1 098 518 628 $ US |
| 1999 | 1 723 000 057 $ US | −3 810 722 999 $ US |
| 1998 | −952 422 820 $ US | −3 730 624 984 $ US |
| 1997 | −1 534 117 222 $ US | −5 975 502 116 $ US |
| 1996 | −1 137 489 348 $ US | −8 351 877 056 $ US |
| 1995 | −1 486 528 419 $ US | −8 115 948 262 $ US |
| 1994 | −1 663 880 073 $ US | −6 867 235 894 $ US |
| 1993 | −205 438 157 $ US | −6 232 770 220 $ US |
| 1992 | 1 472 159 750 $ US | −4 720 523 362 $ US |
| 1991 | 1 681 537 695 $ US | −5 509 077 267 $ US |
| 1990 | −877 295 839 $ US | −3 103 552 723 $ US |
| 1989 | −53 920 830 $ US | −2 010 870 382 $ US |
| 1988 | - | −2 800 375 258 $ US |
| 1987 | - | −3 498 185 125 $ US |
| 1986 | - | −1 649 481 113 $ US |
| 1985 | - | −1 698 280 601 $ US |
| 1984 | - | −2 488 666 439 $ US |
| 1983 | - | −3 259 483 986 $ US |
| 1982 | - | −3 188 683 128 $ US |
| 1981 | - | −3 131 228 070 $ US |
| 1980 | - | −2 559 607 843 $ US |
| 1979 | - | −2 851 200 000 $ US |
| 1978 | - | −2 447 647 059 $ US |
| 1977 | - | −1 834 000 000 $ US |
| 1976 | - | −2 433 750 000 $ US |
| 1975 | - | −3 438 333 333 $ US |
| 1974 | - | −3 132 500 000 $ US |
| 1973 | - | −2 412 500 000 $ US |
| 1972 | - | −925 000 000 $ US |
| 1971 | - | −1 000 000 000 $ US |
| 1970 | - | −1 283 333 333 $ US |
En 2025, la balance commerciale de l'Ukraine affichait un déficit de 56,8 milliards de dollars et celle d'Israël un excédent de 13 milliards de dollars. En 1989, la balance commerciale de l'Ukraine affichait un déficit de 53,9 millions de dollars et celle d'Israël un déficit de 2,01 milliards de dollars.
De 1989 à 2025, la balance commerciale de l'Ukraine a été excédentaire pendant 9 des 37 années, et celle d'Israël pendant 15. Les balances commerciales de l'Ukraine et d'Israël ont été déficitaires en même temps pendant 13 de ces années, la dernière fois en 2012.
Ukraine vs Israël : chiffres de la balance commerciale
|
Ukraine
|
Israël
|
|
|---|---|---|
| Biens et services, $ US | −56,8 Md $US (2025) | +13,0 Md $US (2025) |
| % du PIB | −26,5 % (2025) | +2,1 % (2025) |
| Années d'excédent depuis 2000 | 6 sur 26 | 15 sur 26 |
| Solde des biens entre les deux, chiffres propres | −77,4 M $US (2024) | −275 M $US (2025) |
| Premier excédent en biens avec | Espagne (+2,01 Md $US, 2024) | États-Unis (+6,12 Md $US, 2025) |
| Premier déficit en biens avec | Chine (−11,9 Md $US, 2024) | Chine (−18,0 Md $US, 2025) |
Comparer la balance commerciale de 2 pays au choix
Sources :
- Banque mondiale | Économie et croissance (1970–2025, mis à jour en octobre 2026)
- TradeMap (2001–2025, mis à jour en octobre 2026)
Creative Commons Attribution (CC BY) : vous pouvez copier, partager, adapter et réutiliser ce contenu, y compris à des fins commerciales, à condition de citer statistics.wiki et d’indiquer les modifications apportées. Les sources citées ci-dessus peuvent avoir leurs propres conditions de licence.