
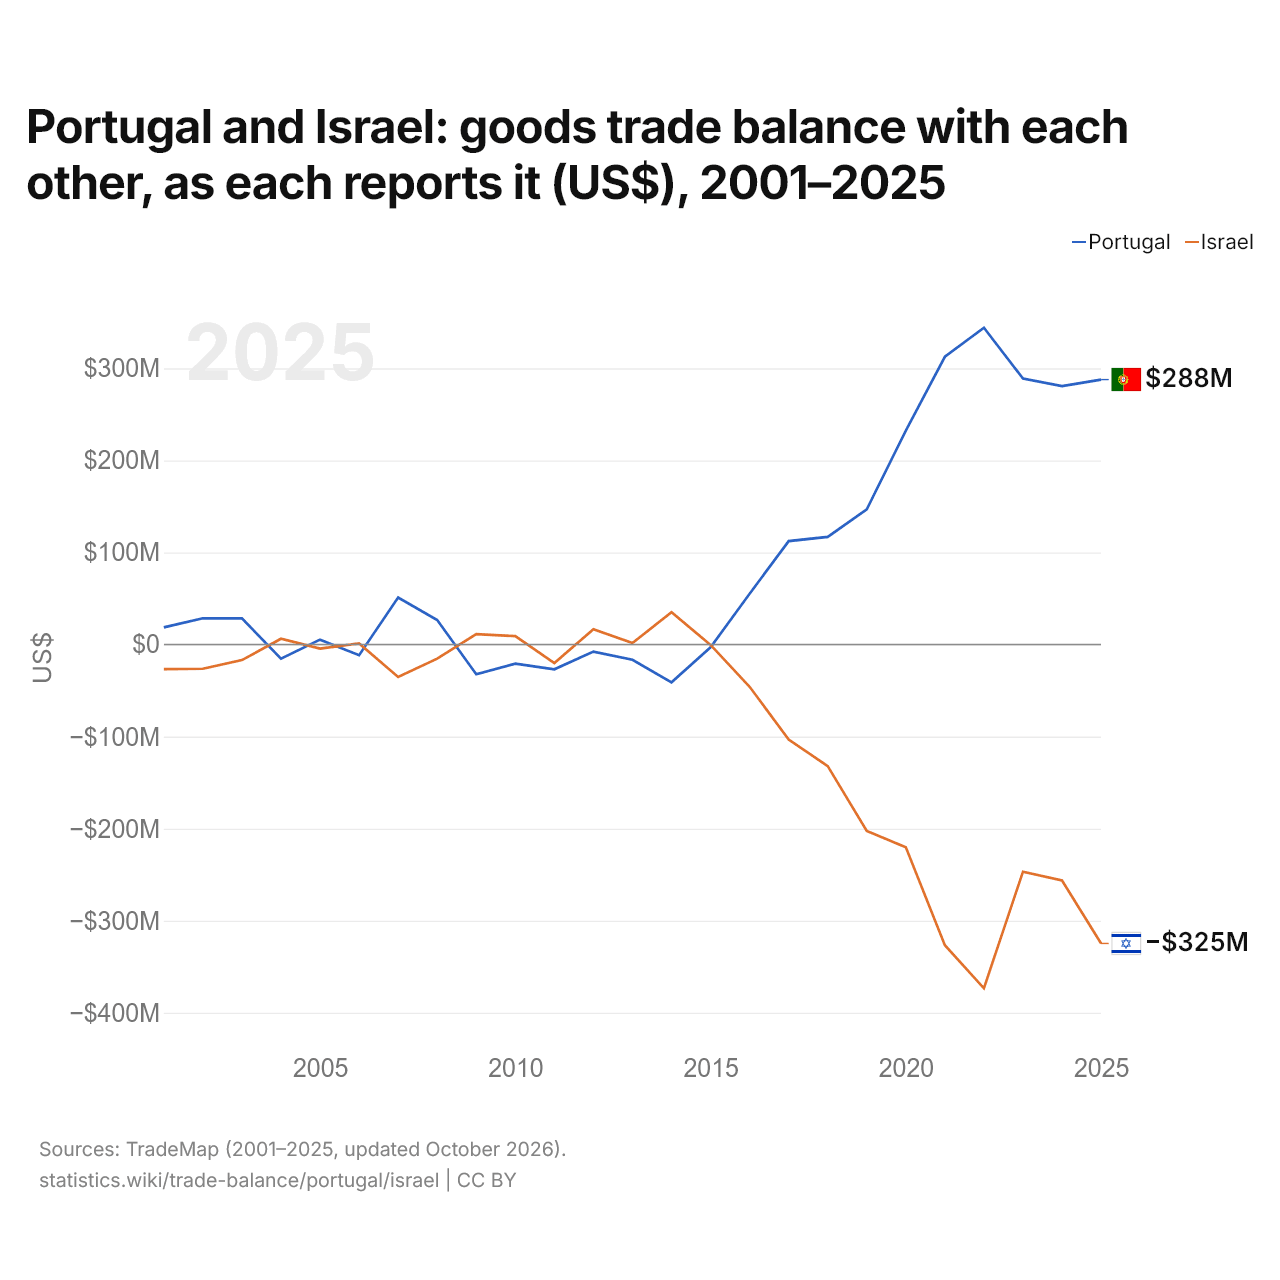
Le Portugal et Israël : solde de leur commerce de biens bilatéral, selon chacun ($ US), 2001–2025
| Année | $ US | |
|---|---|---|
| Portugal | Israël | |
| 2025 | 287 780 000 $ US | −324 723 000 $ US |
| 2024 | 280 678 000 $ US | −256 232 000 $ US |
| 2023 | 288 845 000 $ US | −246 763 000 $ US |
| 2022 | 344 116 000 $ US | −373 434 000 $ US |
| 2021 | 312 537 000 $ US | −326 603 000 $ US |
| 2020 | 232 204 000 $ US | −220 238 000 $ US |
| 2019 | 146 921 000 $ US | −202 435 000 $ US |
| 2018 | 116 893 000 $ US | −132 088 000 $ US |
| 2017 | 112 284 000 $ US | −103 198 000 $ US |
| 2016 | 55 168 000 $ US | −45 897 000 $ US |
| 2015 | −3 068 000 $ US | −413 000 $ US |
| 2014 | −41 091 000 $ US | 35 130 000 $ US |
| 2013 | −16 557 000 $ US | 1 629 000 $ US |
| 2012 | −7 758 000 $ US | 16 674 000 $ US |
| 2011 | −26 901 000 $ US | −20 096 000 $ US |
| 2010 | −20 876 000 $ US | 9 125 000 $ US |
| 2009 | −32 273 000 $ US | 11 281 000 $ US |
| 2008 | 26 604 000 $ US | −15 399 000 $ US |
| 2007 | 51 030 000 $ US | −35 251 000 $ US |
| 2006 | −11 617 000 $ US | 1 220 000 $ US |
| 2005 | 5 254 000 $ US | −4 512 000 $ US |
| 2004 | −15 398 000 $ US | 6 211 000 $ US |
| 2003 | 28 411 000 $ US | −16 898 000 $ US |
| 2002 | 28 529 000 $ US | −26 364 000 $ US |
| 2001 | 18 561 000 $ US | −26 803 000 $ US |
En 2025, selon le Portugal, son commerce de biens avec Israël affichait un excédent de 288 millions de dollars ; selon Israël, son commerce de biens avec le Portugal affichait un déficit de 325 millions de dollars. En 2001, les chiffres étaient un excédent de 18,6 millions de dollars pour le Portugal et un déficit de 26,8 millions de dollars pour Israël.
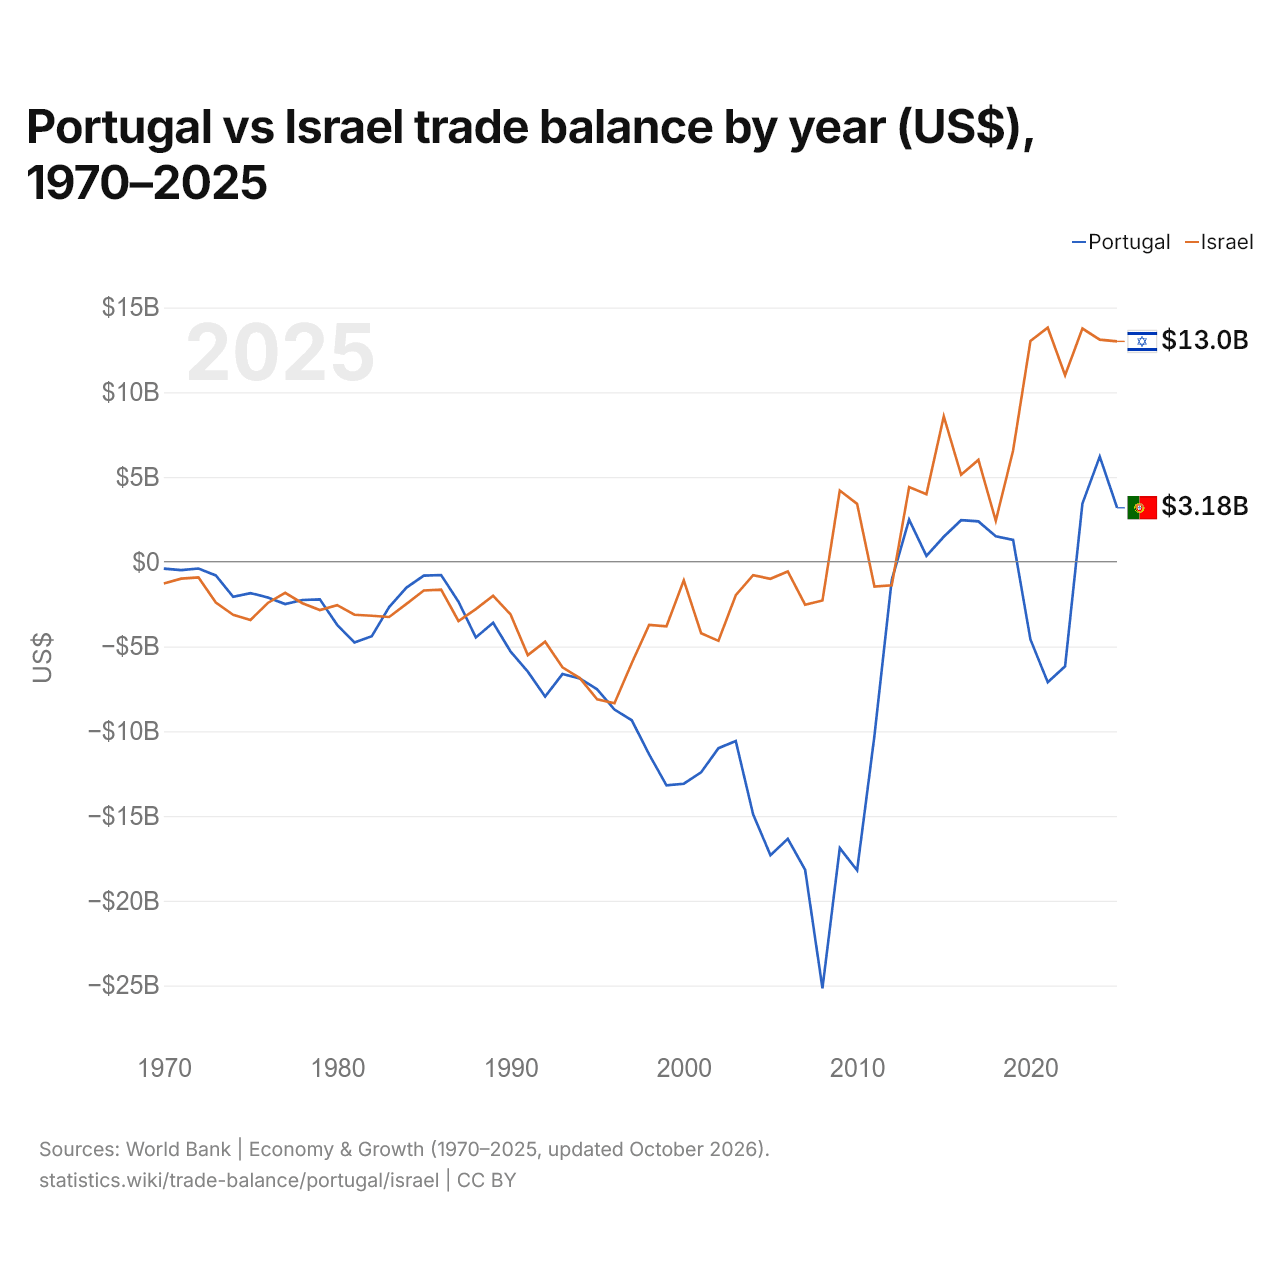
Portugal vs Israël : balance commerciale par année ($ US), 1970–2025
| Année | $ US | |
|---|---|---|
 Portugal |
 Israël |
|
| 2025 | 3 179 729 609 $ US | 12 994 365 505 $ US |
| 2024 | 6 203 529 441 $ US | 13 100 279 099 $ US |
| 2023 | 3 435 097 440 $ US | 13 754 663 733 $ US |
| 2022 | −6 167 577 402 $ US | 11 000 808 302 $ US |
| 2021 | −7 109 880 156 $ US | 13 804 496 055 $ US |
| 2020 | −4 584 592 430 $ US | 13 021 165 408 $ US |
| 2019 | 1 285 251 893 $ US | 6 557 503 906 $ US |
| 2018 | 1 499 682 322 $ US | 2 413 018 727 $ US |
| 2017 | 2 379 942 262 $ US | 6 004 796 901 $ US |
| 2016 | 2 450 560 626 $ US | 5 128 475 225 $ US |
| 2015 | 1 474 193 135 $ US | 8 575 319 326 $ US |
| 2014 | 343 995 351 $ US | 3 984 226 053 $ US |
| 2013 | 2 487 546 494 $ US | 4 406 103 796 $ US |
| 2012 | −1 069 897 488 $ US | −1 392 248 402 $ US |
| 2011 | −10 270 004 539 $ US | −1 462 187 515 $ US |
| 2010 | −18 202 971 435 $ US | 3 412 251 219 $ US |
| 2009 | −16 894 818 154 $ US | 4 198 677 110 $ US |
| 2008 | −25 165 708 546 $ US | −2 287 048 495 $ US |
| 2007 | −18 176 093 820 $ US | −2 539 773 861 $ US |
| 2006 | −16 350 314 966 $ US | −575 153 283 $ US |
| 2005 | −17 311 334 503 $ US | −1 009 500 635 $ US |
| 2004 | −14 905 302 070 $ US | −793 186 301 $ US |
| 2003 | −10 582 015 649 $ US | −1 975 804 879 $ US |
| 2002 | −11 001 387 196 $ US | −4 669 753 894 $ US |
| 2001 | −12 424 660 029 $ US | −4 222 578 168 $ US |
| 2000 | −13 098 469 052 $ US | −1 098 518 628 $ US |
| 1999 | −13 193 669 762 $ US | −3 810 722 999 $ US |
| 1998 | −11 362 958 593 $ US | −3 730 624 984 $ US |
| 1997 | −9 357 416 810 $ US | −5 975 502 116 $ US |
| 1996 | −8 722 525 344 $ US | −8 351 877 056 $ US |
| 1995 | −7 530 287 913 $ US | −8 115 948 262 $ US |
| 1994 | −6 888 712 560 $ US | −6 867 235 894 $ US |
| 1993 | −6 626 869 468 $ US | −6 232 770 220 $ US |
| 1992 | −7 950 987 526 $ US | −4 720 523 362 $ US |
| 1991 | −6 488 605 522 $ US | −5 509 077 267 $ US |
| 1990 | −5 287 396 991 $ US | −3 103 552 723 $ US |
| 1989 | −3 598 389 356 $ US | −2 010 870 382 $ US |
| 1988 | −4 466 105 850 $ US | −2 800 375 258 $ US |
| 1987 | −2 360 348 655 $ US | −3 498 185 125 $ US |
| 1986 | −786 655 944 $ US | −1 649 481 113 $ US |
| 1985 | −822 089 658 $ US | −1 698 280 601 $ US |
| 1984 | −1 526 440 701 $ US | −2 488 666 439 $ US |
| 1983 | −2 676 254 072 $ US | −3 259 483 986 $ US |
| 1982 | −4 394 442 482 $ US | −3 188 683 128 $ US |
| 1981 | −4 769 358 306 $ US | −3 131 228 070 $ US |
| 1980 | −3 725 442 531 $ US | −2 559 607 843 $ US |
| 1979 | −2 220 319 672 $ US | −2 851 200 000 $ US |
| 1978 | −2 256 546 533 $ US | −2 447 647 059 $ US |
| 1977 | −2 499 565 217 $ US | −1 834 000 000 $ US |
| 1976 | −2 113 779 841 $ US | −2 433 750 000 $ US |
| 1975 | −1 851 043 137 $ US | −3 438 333 333 $ US |
| 1974 | −2 073 433 307 $ US | −3 132 500 000 $ US |
| 1973 | −808 299 264 $ US | −2 412 500 000 $ US |
| 1972 | −399 770 200 $ US | −925 000 000 $ US |
| 1971 | −494 459 364 $ US | −1 000 000 000 $ US |
| 1970 | −404 839 609 $ US | −1 283 333 333 $ US |
En 2025, la balance commerciale du Portugal affichait un excédent de 3,18 milliards de dollars et celle d'Israël un excédent de 13 milliards de dollars ; l'excédent d'Israël était 4,1 fois plus grand. En 1970, la balance commerciale du Portugal affichait un déficit de 405 millions de dollars et celle d'Israël un déficit de 1,28 milliard de dollars.
De 1970 à 2025, la balance commerciale du Portugal a été excédentaire pendant 10 des 56 années, et celle d'Israël pendant 15. Les balances commerciales du Portugal et d'Israël ont été déficitaires en même temps pendant 41 de ces années, la dernière fois en 2012.
Portugal vs Israël : chiffres de la balance commerciale
|
Portugal
|
Israël
|
|
|---|---|---|
| Biens et services, $ US | +3,18 Md $US (2025) | +13,0 Md $US (2025) |
| % du PIB | +0,9 % (2025) | +2,1 % (2025) |
| Années d'excédent depuis 2000 | 10 sur 26 | 15 sur 26 |
| Solde des biens entre les deux, chiffres propres | +288 M $US (2025) | −325 M $US (2025) |
| Premier excédent en biens avec | Royaume-Uni (+2,72 Md $US, 2025) | États-Unis (+6,12 Md $US, 2025) |
| Premier déficit en biens avec | Espagne (−18,1 Md $US, 2025) | Chine (−18,0 Md $US, 2025) |
Comparer la balance commerciale de 2 pays au choix
Sources :
- Banque mondiale | Économie et croissance (1970–2025, mis à jour en octobre 2026)
- TradeMap (2001–2025, mis à jour en octobre 2026)
Creative Commons Attribution (CC BY) : vous pouvez copier, partager, adapter et réutiliser ce contenu, y compris à des fins commerciales, à condition de citer statistics.wiki et d’indiquer les modifications apportées. Les sources citées ci-dessus peuvent avoir leurs propres conditions de licence.