
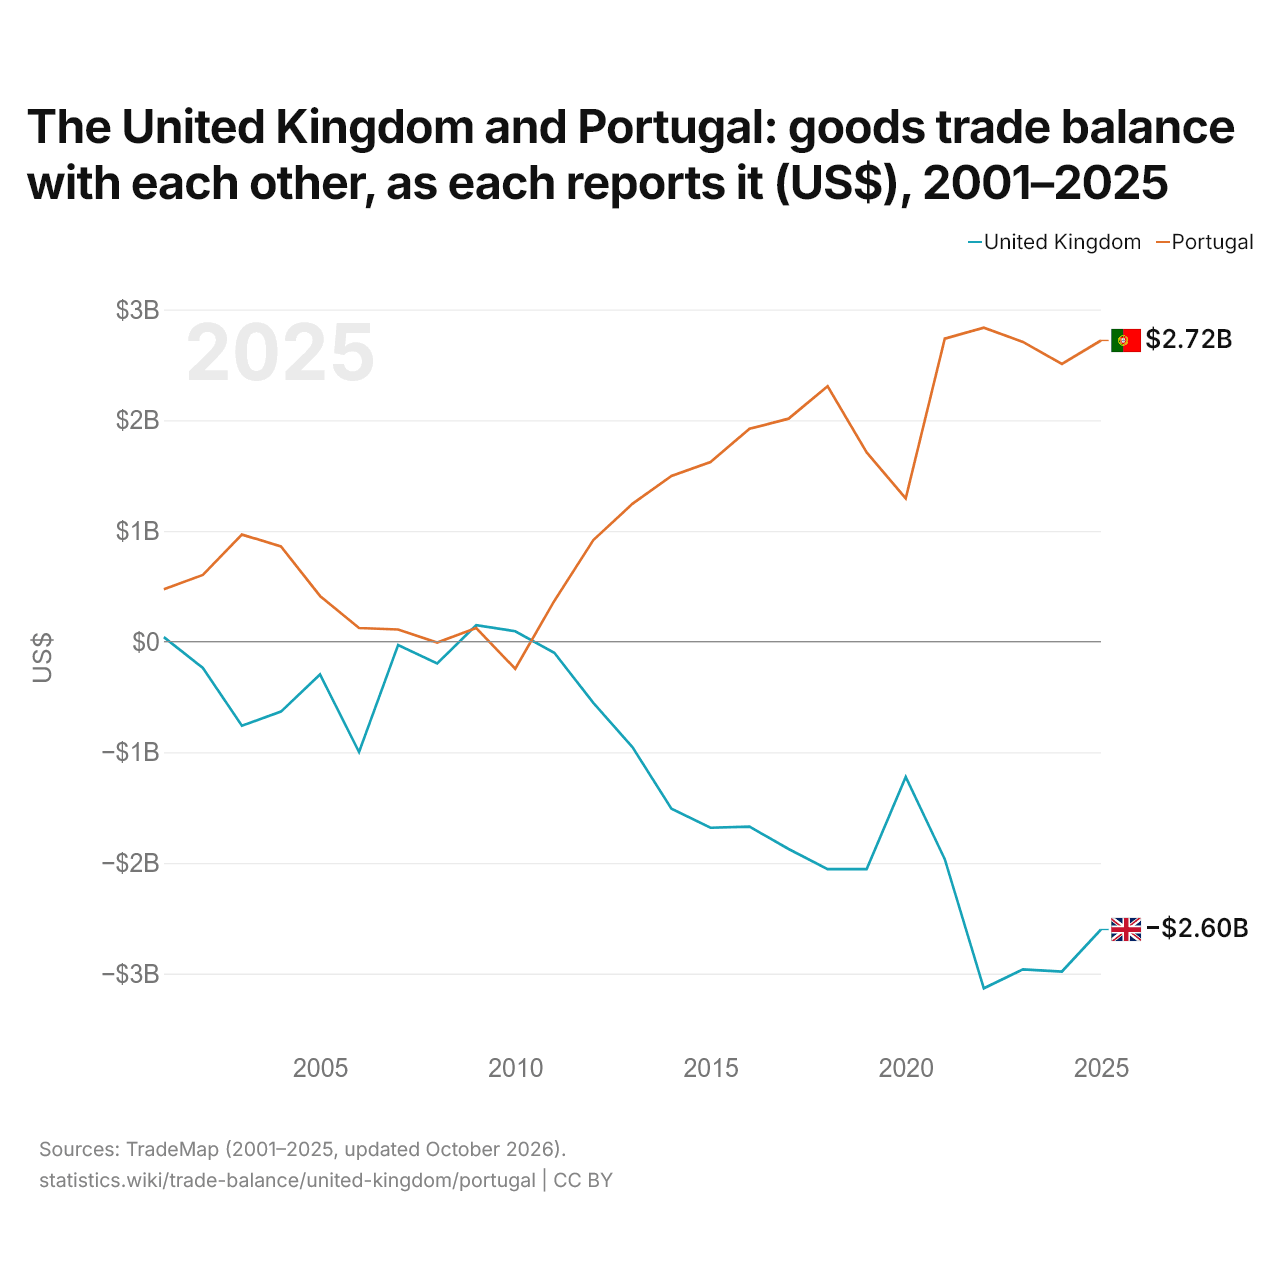
Le Royaume-Uni et le Portugal : solde de leur commerce de biens bilatéral, selon chacun ($ US), 2001–2025
| Année | $ US | |
|---|---|---|
| Royaume-Uni | Portugal | |
| 2025 | −2 601 728 000 $ US | 2 720 281 000 $ US |
| 2024 | −2 981 614 000 $ US | 2 508 119 000 $ US |
| 2023 | −2 961 468 000 $ US | 2 707 735 000 $ US |
| 2022 | −3 133 091 000 $ US | 2 835 826 000 $ US |
| 2021 | −1 966 713 000 $ US | 2 736 801 000 $ US |
| 2020 | −1 223 768 000 $ US | 1 293 309 000 $ US |
| 2019 | −2 055 799 000 $ US | 1 709 067 000 $ US |
| 2018 | −2 056 639 000 $ US | 2 306 851 000 $ US |
| 2017 | −1 874 685 000 $ US | 2 013 882 000 $ US |
| 2016 | −1 672 218 000 $ US | 1 922 652 000 $ US |
| 2015 | −1 682 494 000 $ US | 1 622 532 000 $ US |
| 2014 | −1 509 648 000 $ US | 1 496 949 000 $ US |
| 2013 | −953 524 000 $ US | 1 244 132 000 $ US |
| 2012 | −554 807 000 $ US | 916 592 000 $ US |
| 2011 | −101 236 000 $ US | 367 239 000 $ US |
| 2010 | 93 219 000 $ US | −245 867 000 $ US |
| 2009 | 147 996 000 $ US | 122 054 000 $ US |
| 2008 | −198 126 000 $ US | −9 362 000 $ US |
| 2007 | −31 147 000 $ US | 108 888 000 $ US |
| 2006 | −998 111 000 $ US | 122 788 000 $ US |
| 2005 | −297 125 000 $ US | 412 238 000 $ US |
| 2004 | −633 254 000 $ US | 860 108 000 $ US |
| 2003 | −760 740 000 $ US | 966 389 000 $ US |
| 2002 | −239 469 000 $ US | 601 982 000 $ US |
| 2001 | 40 231 000 $ US | 472 732 000 $ US |
En 2025, selon le Royaume-Uni, son commerce de biens avec le Portugal affichait un déficit de 2,6 milliards de dollars ; selon le Portugal, son commerce de biens avec le Royaume-Uni affichait un excédent de 2,72 milliards de dollars. En 2001, les chiffres étaient un excédent de 40,2 millions de dollars pour le Royaume-Uni et un excédent de 473 millions de dollars pour le Portugal.
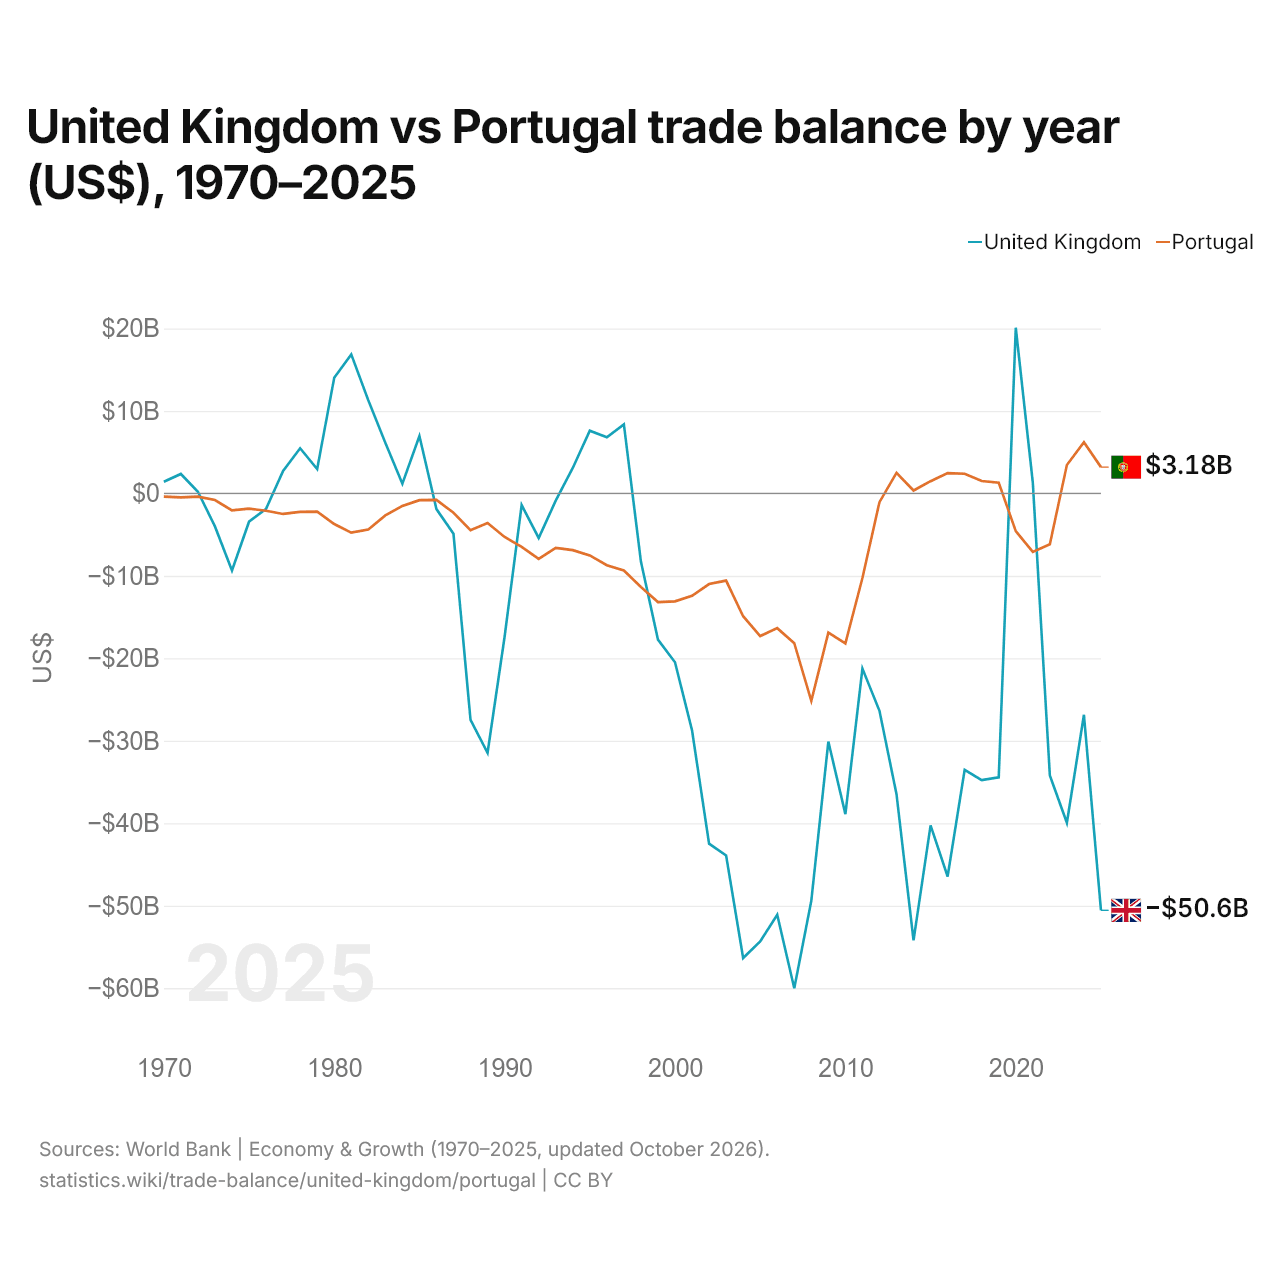
Royaume-Uni vs Portugal : balance commerciale par année ($ US), 1970–2025
| Année | $ US | |
|---|---|---|
 Royaume-Uni |
 Portugal |
|
| 2025 | −50 569 212 583 $ US | 3 179 729 609 $ US |
| 2024 | −26 857 883 928 $ US | 6 203 529 441 $ US |
| 2023 | −39 949 590 667 $ US | 3 435 097 440 $ US |
| 2022 | −34 200 593 267 $ US | −6 167 577 402 $ US |
| 2021 | 1 291 493 981 $ US | −7 109 880 156 $ US |
| 2020 | 20 087 190 388 $ US | −4 584 592 430 $ US |
| 2019 | −34 446 574 055 $ US | 1 285 251 893 $ US |
| 2018 | −34 784 736 832 $ US | 1 499 682 322 $ US |
| 2017 | −33 530 132 413 $ US | 2 379 942 262 $ US |
| 2016 | −46 460 165 826 $ US | 2 450 560 626 $ US |
| 2015 | −40 263 054 056 $ US | 1 474 193 135 $ US |
| 2014 | −54 209 962 034 $ US | 343 995 351 $ US |
| 2013 | −36 480 284 727 $ US | 2 487 546 494 $ US |
| 2012 | −26 375 609 226 $ US | −1 069 897 488 $ US |
| 2011 | −21 250 011 601 $ US | −10 270 004 539 $ US |
| 2010 | −38 910 388 863 $ US | −18 202 971 435 $ US |
| 2009 | −30 099 704 004 $ US | −16 894 818 154 $ US |
| 2008 | −49 411 764 706 $ US | −25 165 708 546 $ US |
| 2007 | −60 026 010 404 $ US | −18 176 093 820 $ US |
| 2006 | −51 102 115 915 $ US | −16 350 314 966 $ US |
| 2005 | −54 350 909 091 $ US | −17 311 334 503 $ US |
| 2004 | −56 358 476 748 $ US | −14 905 302 070 $ US |
| 2003 | −43 920 000 000 $ US | −10 582 015 649 $ US |
| 2002 | −42 492 505 995 $ US | −11 001 387 196 $ US |
| 2001 | −28 744 781 920 $ US | −12 424 660 029 $ US |
| 2000 | −20 482 675 140 $ US | −13 098 469 052 $ US |
| 1999 | −17 736 612 199 $ US | −13 193 669 762 $ US |
| 1998 | −8 272 606 823 $ US | −11 362 958 593 $ US |
| 1997 | 8 370 988 867 $ US | −9 357 416 810 $ US |
| 1996 | 6 794 071 763 $ US | −8 722 525 344 $ US |
| 1995 | 7 601 388 670 $ US | −7 530 287 913 $ US |
| 1994 | 3 075 209 672 $ US | −6 888 712 560 $ US |
| 1993 | −895 112 478 $ US | −6 626 869 468 $ US |
| 1992 | −5 413 362 583 $ US | −7 950 987 526 $ US |
| 1991 | −1 423 382 716 $ US | −6 488 605 522 $ US |
| 1990 | −17 387 460 938 $ US | −5 287 396 991 $ US |
| 1989 | −31 467 719 241 $ US | −3 598 389 356 $ US |
| 1988 | −27 479 980 434 $ US | −4 466 105 850 $ US |
| 1987 | −4 905 373 427 $ US | −2 360 348 655 $ US |
| 1986 | −1 914 626 209 $ US | −786 655 944 $ US |
| 1985 | 6 960 758 470 $ US | −822 089 658 $ US |
| 1984 | 1 166 102 687 $ US | −1 526 440 701 $ US |
| 1983 | 6 137 257 844 $ US | −2 676 254 072 $ US |
| 1982 | 11 288 424 179 $ US | −4 394 442 482 $ US |
| 1981 | 16 850 128 617 $ US | −4 769 358 306 $ US |
| 1980 | 14 021 626 772 $ US | −3 725 442 531 $ US |
| 1979 | 2 950 108 005 $ US | −2 220 319 672 $ US |
| 1978 | 5 468 285 714 $ US | −2 256 546 533 $ US |
| 1977 | 2 715 295 657 $ US | −2 499 565 217 $ US |
| 1976 | −1 885 504 043 $ US | −2 113 779 841 $ US |
| 1975 | −3 440 595 133 $ US | −1 851 043 137 $ US |
| 1974 | −9 354 408 602 $ US | −2 073 433 307 $ US |
| 1973 | −4 008 826 556 $ US | −808 299 264 $ US |
| 1972 | 198 826 174 $ US | −399 770 200 $ US |
| 1971 | 2 351 961 548 $ US | −494 459 364 $ US |
| 1970 | 1 393 813 295 $ US | −404 839 609 $ US |
En 2025, la balance commerciale du Royaume-Uni affichait un déficit de 50,6 milliards de dollars et celle du Portugal un excédent de 3,18 milliards de dollars. En 1970, la balance commerciale du Royaume-Uni affichait un excédent de 1,39 milliard de dollars et celle du Portugal un déficit de 405 millions de dollars.
De 1970 à 2025, la balance commerciale du Royaume-Uni a été excédentaire pendant 18 des 56 années, et celle du Portugal pendant 10. Les balances commerciales du Royaume-Uni et du Portugal ont été déficitaires en même temps pendant 28 de ces années, la dernière fois en 2022.
Royaume-Uni vs Portugal : chiffres de la balance commerciale
|
Royaume-Uni
|
Portugal
|
|
|---|---|---|
| Biens et services, $ US | −50,6 Md $US (2025) | +3,18 Md $US (2025) |
| % du PIB | −1,3 % (2025) | +0,9 % (2025) |
| Années d'excédent depuis 2000 | 2 sur 26 | 10 sur 26 |
| Solde des biens entre les deux, chiffres propres | −2,60 Md $US (2025) | +2,72 Md $US (2025) |
| Premier excédent en biens avec | Irlande (+9,23 Md $US, 2025) | Royaume-Uni (+2,72 Md $US, 2025) |
| Premier déficit en biens avec | Chine (−71,7 Md $US, 2025) | Espagne (−18,1 Md $US, 2025) |
Comparer la balance commerciale de 2 pays au choix
Sources :
- Banque mondiale | Économie et croissance (1970–2025, mis à jour en octobre 2026)
- TradeMap (2001–2025, mis à jour en octobre 2026)
Creative Commons Attribution (CC BY) : vous pouvez copier, partager, adapter et réutiliser ce contenu, y compris à des fins commerciales, à condition de citer statistics.wiki et d’indiquer les modifications apportées. Les sources citées ci-dessus peuvent avoir leurs propres conditions de licence.