
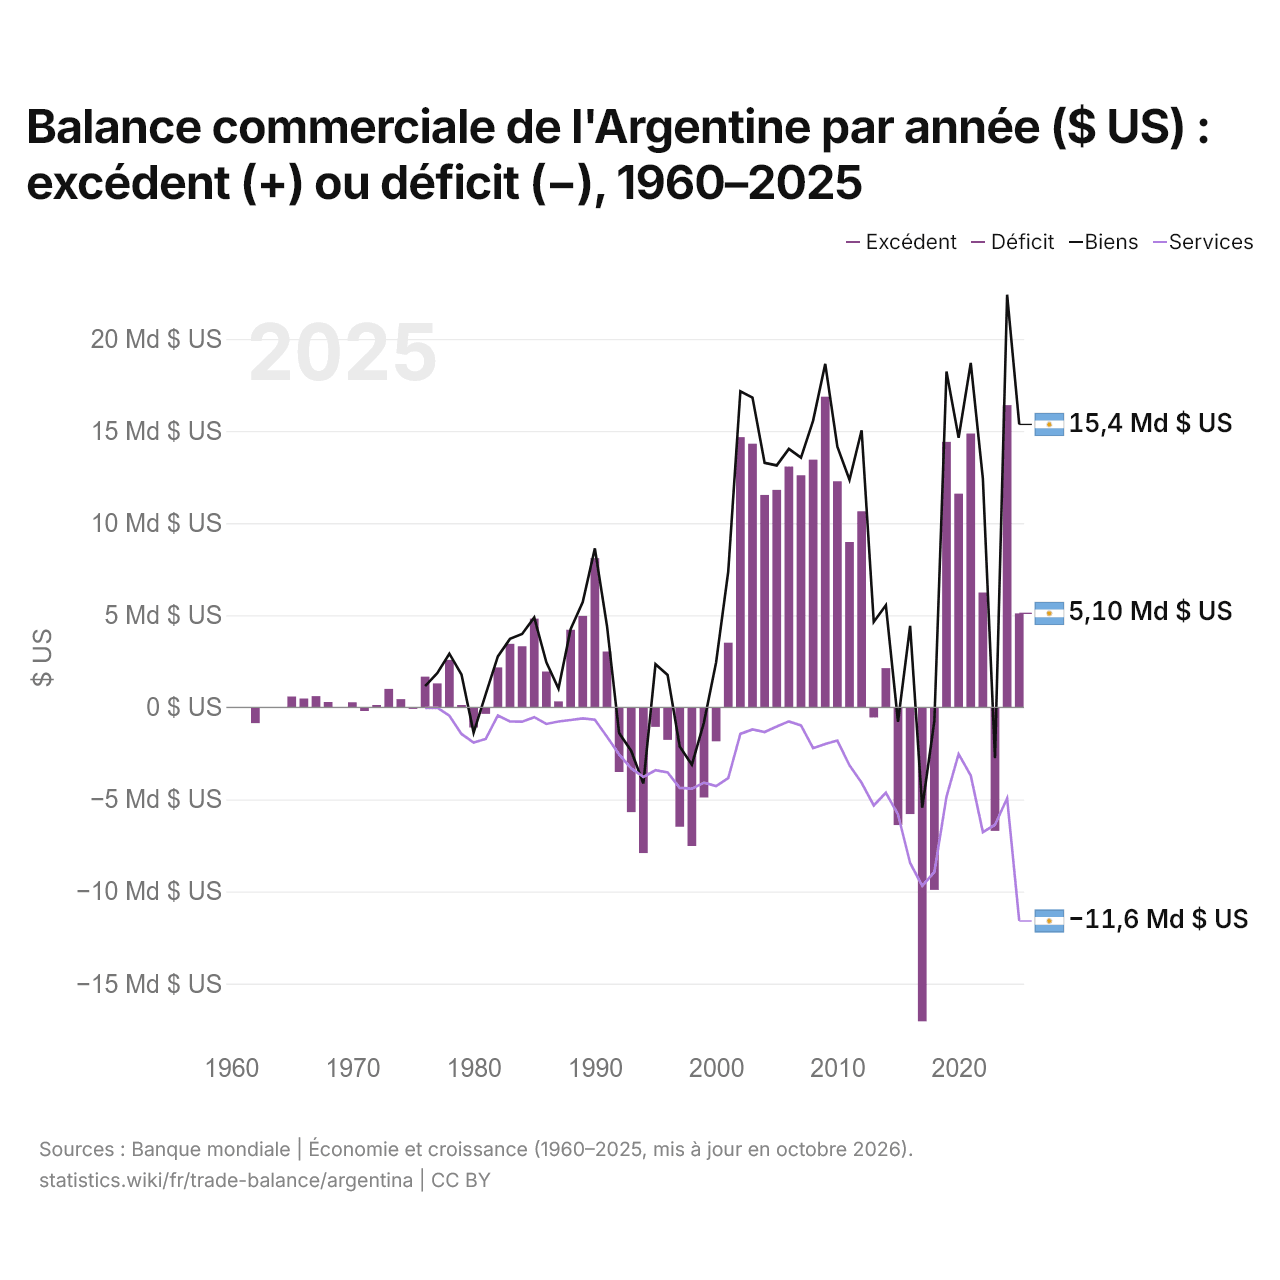
Balance commerciale de l'Argentine par année ($ US) : excédent (+) ou déficit (−), 1960–2025
| Année | $ US | ||
|---|---|---|---|
| Biens et services | Biens | Services | |
| 2025 | 5 100 613 800 $ US | 15 359 035 404 $ US | −11 600 937 950 $ US |
| 2024 | 16 404 309 065 $ US | 22 403 845 993 $ US | −4 938 152 065 $ US |
| 2023 | −6 704 568 723 $ US | −2 757 490 851 $ US | −6 376 179 933 $ US |
| 2022 | 6 233 148 859 $ US | 12 416 554 416 $ US | −6 774 858 094 $ US |
| 2021 | 14 863 213 107 $ US | 18 695 465 615 $ US | −3 700 091 498 $ US |
| 2020 | 11 599 718 810 $ US | 14 630 698 177 $ US | −2 536 282 766 $ US |
| 2019 | 14 413 857 778 $ US | 18 233 723 458 $ US | −4 843 173 417 $ US |
| 2018 | −9 914 710 860 $ US | −743 227 678 $ US | −8 935 267 786 $ US |
| 2017 | −17 049 937 664 $ US | −5 447 063 108 $ US | −9 695 438 592 $ US |
| 2016 | −5 796 649 660 $ US | 4 416 156 942 $ US | −8 451 655 186 $ US |
| 2015 | −6 393 090 843 $ US | −785 176 393 $ US | −5 815 044 693 $ US |
| 2014 | 2 127 192 191 $ US | 5 541 469 813 $ US | −4 641 292 153 $ US |
| 2013 | −549 718 918 $ US | 4 635 235 241 $ US | −5 328 916 115 $ US |
| 2012 | 10 642 160 447 $ US | 15 040 912 787 $ US | −4 097 224 724 $ US |
| 2011 | 8 971 671 281 $ US | 12 350 931 087 $ US | −3 152 488 037 $ US |
| 2010 | 12 270 934 023 $ US | 14 147 109 298 $ US | −1 803 588 650 $ US |
| 2009 | 16 864 736 859 $ US | 18 644 850 000 $ US | −1 992 031 490 $ US |
| 2008 | 13 446 803 975 $ US | 15 563 272 000 $ US | −2 222 335 027 $ US |
| 2007 | 12 594 785 133 $ US | 13 552 062 000 $ US | −981 482 024 $ US |
| 2006 | 13 069 507 212 $ US | 14 029 600 000 $ US | −762 957 427 $ US |
| 2005 | 11 805 942 344 $ US | 13 134 050 000 $ US | −1 038 830 000 $ US |
| 2004 | 11 530 324 282 $ US | 13 277 700 000 $ US | −1 344 090 000 $ US |
| 2003 | 14 311 606 659 $ US | 16 816 200 000 $ US | −1 204 700 000 $ US |
| 2002 | 14 670 786 469 $ US | 17 161 200 000 $ US | −1 443 920 000 $ US |
| 2001 | 3 508 536 600 $ US | 7 370 200 000 $ US | −3 848 389 356 $ US |
| 2000 | −1 846 455 600 $ US | 2 448 100 000 $ US | −4 279 983 472 $ US |
| 1999 | −4 900 400 000 $ US | −815 400 000 $ US | −4 090 358 056 $ US |
| 1998 | −7 530 100 000 $ US | −3 122 200 000 $ US | −4 419 347 974 $ US |
| 1997 | −6 485 300 000 $ US | −2 132 600 000 $ US | −4 375 215 237 $ US |
| 1996 | −1 767 000 000 $ US | 1 751 400 000 $ US | −3 538 849 424 $ US |
| 1995 | −1 059 485 000 $ US | 2 337 515 000 $ US | −3 416 200 000 $ US |
| 1994 | −7 914 860 000 $ US | −4 135 500 000 $ US | −3 782 400 000 $ US |
| 1993 | −5 692 332 332 $ US | −2 369 900 000 $ US | −3 319 340 000 $ US |
| 1992 | −3 510 854 173 $ US | −1 397 400 000 $ US | −2 555 900 000 $ US |
| 1991 | 3 029 889 879 $ US | 4 419 000 000 $ US | −1 599 000 000 $ US |
| 1990 | 8 096 982 795 $ US | 8 628 000 000 $ US | −674 000 000 $ US |
| 1989 | 4 964 855 541 $ US | 5 709 000 000 $ US | −600 000 000 $ US |
| 1988 | 4 212 460 577 $ US | 4 242 000 000 $ US | −687 000 000 $ US |
| 1987 | 323 648 995 $ US | 1 017 000 000 $ US | −772 000 000 $ US |
| 1986 | 1 945 851 942 $ US | 2 446 000 000 $ US | −903 000 000 $ US |
| 1985 | 4 815 481 324 $ US | 4 878 000 000 $ US | −536 000 000 $ US |
| 1984 | 3 312 681 836 $ US | 3 982 000 000 $ US | −778 000 000 $ US |
| 1983 | 3 447 293 430 $ US | 3 716 000 000 $ US | −769 000 000 $ US |
| 1982 | 2 166 280 922 $ US | 2 764 000 000 $ US | −444 000 000 $ US |
| 1981 | −354 736 981 $ US | 712 000 000 $ US | −1 718 000 000 $ US |
| 1980 | −1 094 188 525 $ US | −1 373 000 000 $ US | −1 912 000 000 $ US |
| 1979 | 125 448 026 $ US | 1 782 000 000 $ US | −1 445 000 000 $ US |
| 1978 | 2 576 185 988 $ US | 2 913 000 000 $ US | −457 000 000 $ US |
| 1977 | 1 300 000 008 $ US | 1 852 000 000 $ US | −16 000 000 $ US |
| 1976 | 1 665 000 247 $ US | 1 153 000 000 $ US | −28 000 000 $ US |
| 1975 | −81 081 003 $ US | - | - |
| 1974 | 444 444 350 $ US | - | - |
| 1973 | 1 000 000 034 $ US | - | - |
| 1972 | 125 000 068 $ US | - | - |
| 1971 | −199 999 955 $ US | - | - |
| 1970 | 273 421 120 $ US | - | - |
| 1969 | 0 $ US | - | - |
| 1968 | 285 714 230 $ US | - | - |
| 1967 | 606 060 620 $ US | - | - |
| 1966 | 476 190 459 $ US | - | - |
| 1965 | 588 235 264 $ US | - | - |
| 1964 | 392 $ US | - | - |
| 1963 | 396 $ US | - | - |
| 1962 | −860 375 152 $ US | - | - |
| 1961 | 338 $ US | - | - |
| 1960 | 338 $ US | - | - |
En 2025, la balance commerciale de l'Argentine affichait un excédent de 5,1 milliards de dollars, contre un excédent de 338 dollars en 1960. Le plus grand déficit a été de 17 milliards de dollars, en 2017, et le plus grand excédent de 16,9 milliards de dollars, en 2009.
En 2025, le solde commercial de l'Argentine était le 5e plus élevé de 26 pays situés en Amérique latine, où les soldes allaient d'un déficit de 24,7 milliards de dollars en Colombie à un excédent de 27,2 milliards de dollars au Pérou. De 2016 à 2025, les soldes commerciaux de l'Argentine ont totalisé un excédent de 29,1 milliards de dollars, contre un excédent de 83 milliards de dollars de 2006 à 2015. En 2025, les transactions courantes de l'Argentine affichaient un déficit de 1,1 % du PIB.
Commerce de biens de l'Argentine avec ses 10 principaux partenaires commerciaux, selon l'Argentine, 2025
| Pays | Exportations vers | Importations depuis | Solde | |
|---|---|---|---|---|
 Brésil |
12,8 Md $US | 17,6 Md $US | −4,85 Md $US | vs Brésil |
 Chine |
9,71 Md $US | 16,6 Md $US | −6,88 Md $US | vs Chine |
 États-Unis |
8,34 Md $US | 6,35 Md $US | +1,99 Md $US | vs USA |
 Chili |
6,28 Md $US | 815 M $US | +5,47 Md $US | vs Chili |
 Inde |
5,47 Md $US | 1,36 Md $US | +4,11 Md $US | vs Inde |
 Allemagne |
1,11 Md $US | 3,04 Md $US | −1,94 Md $US | vs Allemagne |
 Paraguay |
1,37 Md $US | 2,78 Md $US | −1,41 Md $US | |
 Vietnam |
2,73 Md $US | 1,28 Md $US | +1,45 Md $US | |
 Pérou |
2,55 Md $US | 322 M $US | +2,23 Md $US | vs Pérou |
 Suisse |
2,06 Md $US | 689 M $US | +1,37 Md $US | vs Suisse |
Balance commerciale de l'Argentine : excédent (+) ou déficit (−)
Comparer la balance commerciale de l'Argentine avec celle d'autres pays
Sources :
- TradeMap (2025, mis à jour en octobre 2026)
- Banque mondiale | Économie et croissance (1960–2025, mis à jour en octobre 2026)
Creative Commons Attribution (CC BY) : vous pouvez copier, partager, adapter et réutiliser ce contenu, y compris à des fins commerciales, à condition de citer statistics.wiki et d’indiquer les modifications apportées. Les sources citées ci-dessus peuvent avoir leurs propres conditions de licence.