
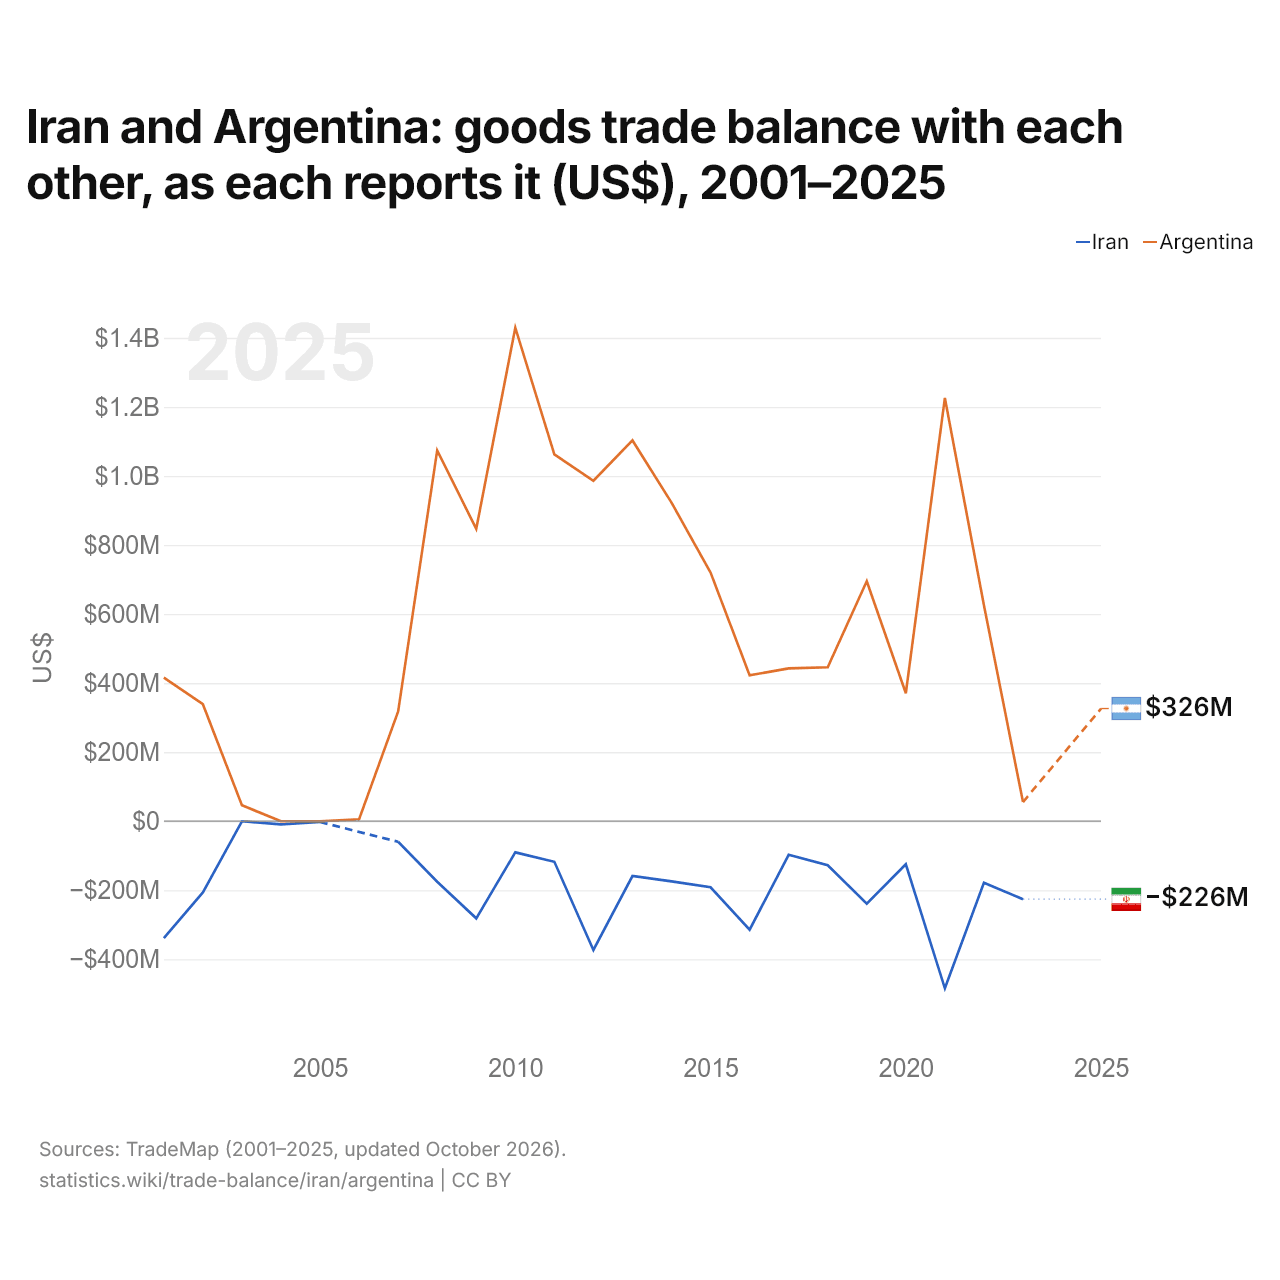
L'Iran et l'Argentine : solde de leur commerce de biens bilatéral, selon chacun ($ US), 2001–2025
| Année | $ US | |
|---|---|---|
| Iran | Argentine | |
| 2025 | - | 326 307 000 $ US |
| 2024 | - | - |
| 2023 | −226 038 000 $ US | 55 376 000 $ US |
| 2022 | −178 211 000 $ US | 625 349 000 $ US |
| 2021 | −484 198 000 $ US | 1 226 037 000 $ US |
| 2020 | −124 849 000 $ US | 370 632 000 $ US |
| 2019 | −238 889 000 $ US | 694 875 000 $ US |
| 2018 | −127 901 000 $ US | 445 882 000 $ US |
| 2017 | −97 299 000 $ US | 442 448 000 $ US |
| 2016 | −314 510 000 $ US | 422 541 000 $ US |
| 2015 | −191 553 000 $ US | 720 247 000 $ US |
| 2014 | −174 649 000 $ US | 922 728 000 $ US |
| 2013 | −158 842 000 $ US | 1 102 893 000 $ US |
| 2012 | −373 213 000 $ US | 985 978 000 $ US |
| 2011 | −117 770 000 $ US | 1 062 492 000 $ US |
| 2010 | −90 378 000 $ US | 1 429 452 000 $ US |
| 2009 | −281 562 000 $ US | 846 759 000 $ US |
| 2008 | −175 416 000 $ US | 1 074 045 000 $ US |
| 2007 | −59 829 000 $ US | 317 683 000 $ US |
| 2006 | - | 5 478 000 $ US |
| 2005 | −2 374 000 $ US | −291 000 $ US |
| 2004 | −9 142 000 $ US | −200 000 $ US |
| 2003 | −390 000 $ US | 46 006 000 $ US |
| 2002 | −206 351 000 $ US | 338 858 000 $ US |
| 2001 | −339 066 000 $ US | 415 606 000 $ US |
Selon l'Iran, son commerce de biens avec l'Argentine affichait un déficit de 226 millions de dollars ; selon l'Argentine, son commerce de biens avec l'Iran affichait un excédent de 55,4 millions de dollars. En 2001, les chiffres étaient un déficit de 339 millions de dollars pour l'Iran et un excédent de 416 millions de dollars pour l'Argentine.
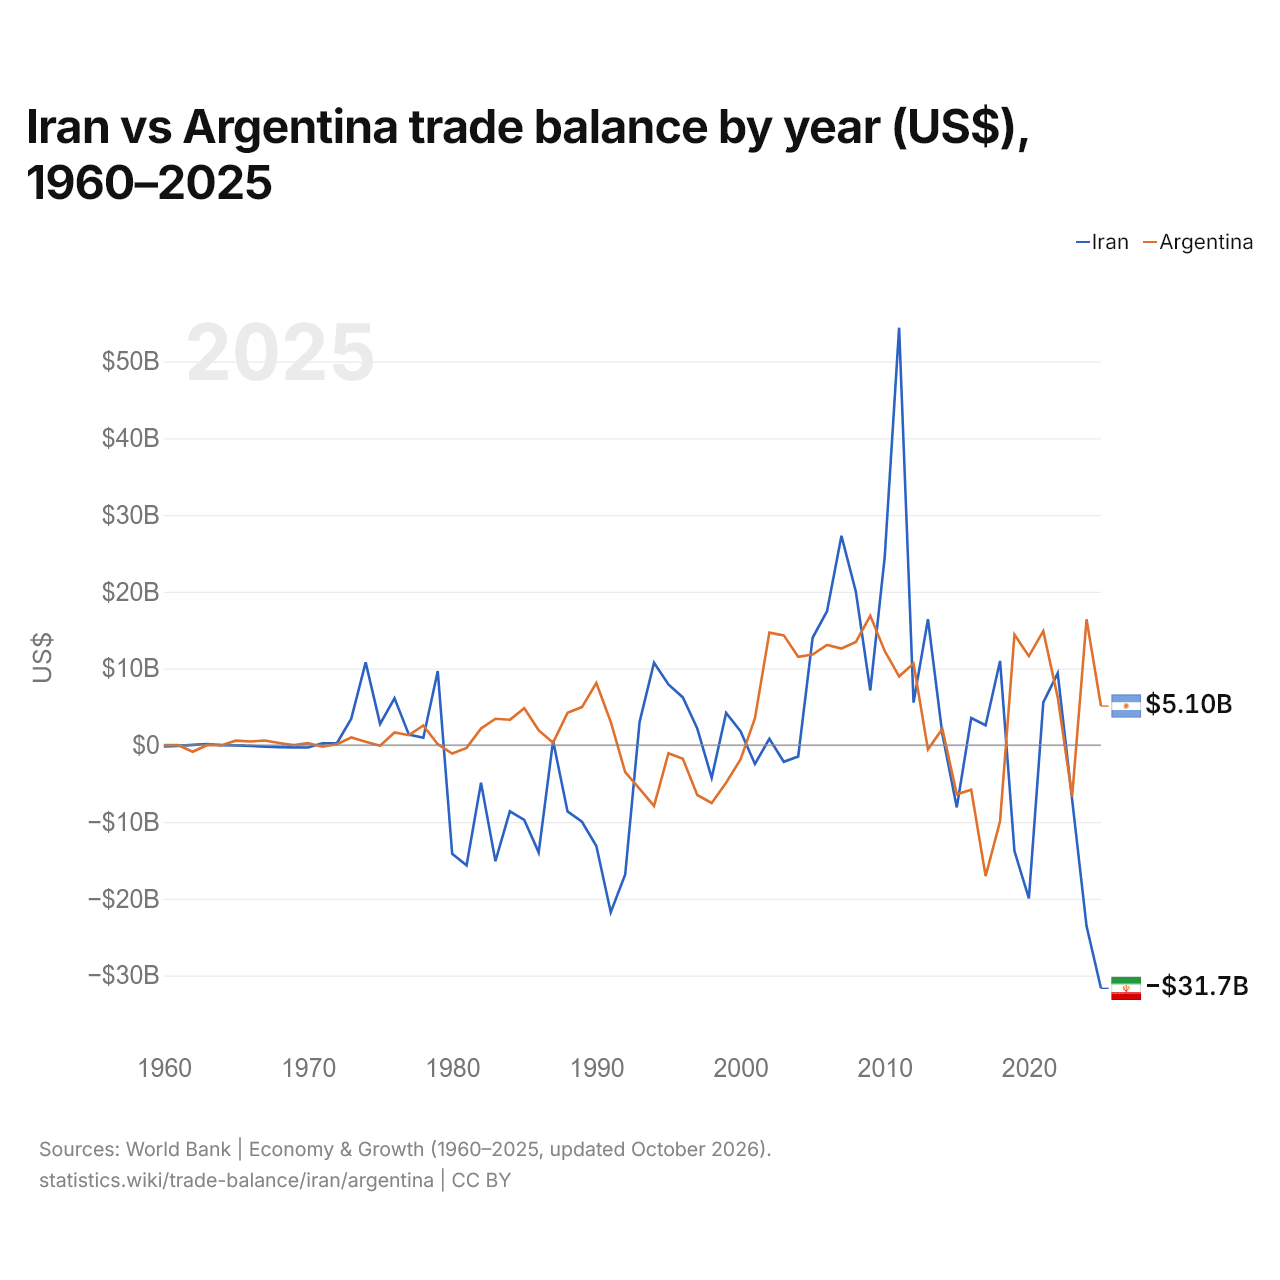
Iran vs Argentine : balance commerciale par année ($ US), 1960–2025
| Année | $ US | |
|---|---|---|
 Iran |
 Argentine |
|
| 2025 | −31 676 191 270 $ US | 5 100 613 800 $ US |
| 2024 | −23 568 637 367 $ US | 16 404 309 065 $ US |
| 2023 | −7 092 579 071 $ US | −6 704 568 723 $ US |
| 2022 | 9 361 488 157 $ US | 6 233 148 859 $ US |
| 2021 | 5 564 557 565 $ US | 14 863 213 107 $ US |
| 2020 | −19 956 781 850 $ US | 11 599 718 810 $ US |
| 2019 | −13 788 535 089 $ US | 14 413 857 778 $ US |
| 2018 | 10 973 263 186 $ US | −9 914 710 860 $ US |
| 2017 | 2 603 085 001 $ US | −17 049 937 664 $ US |
| 2016 | 3 552 884 583 $ US | −5 796 649 660 $ US |
| 2015 | −8 105 758 514 $ US | −6 393 090 843 $ US |
| 2014 | 1 432 734 468 $ US | 2 127 192 191 $ US |
| 2013 | 16 408 588 952 $ US | −549 718 918 $ US |
| 2012 | 5 546 640 294 $ US | 10 642 160 447 $ US |
| 2011 | 54 398 073 068 $ US | 8 971 671 281 $ US |
| 2010 | 24 493 086 440 $ US | 12 270 934 023 $ US |
| 2009 | 7 135 886 374 $ US | 16 864 736 859 $ US |
| 2008 | 19 998 393 809 $ US | 13 446 803 975 $ US |
| 2007 | 27 279 166 988 $ US | 12 594 785 133 $ US |
| 2006 | 17 451 954 234 $ US | 13 069 507 212 $ US |
| 2005 | 13 995 728 754 $ US | 11 805 942 344 $ US |
| 2004 | −1 464 487 186 $ US | 11 530 324 282 $ US |
| 2003 | −2 163 459 033 $ US | 14 311 606 659 $ US |
| 2002 | 842 657 775 $ US | 14 670 786 469 $ US |
| 2001 | −2 447 396 907 $ US | 3 508 536 600 $ US |
| 2000 | 1 837 707 919 $ US | −1 846 455 600 $ US |
| 1999 | 4 210 835 500 $ US | −4 900 400 000 $ US |
| 1998 | −4 258 296 496 $ US | −7 530 100 000 $ US |
| 1997 | 2 171 645 134 $ US | −6 485 300 000 $ US |
| 1996 | 6 223 632 673 $ US | −1 767 000 000 $ US |
| 1995 | 7 914 318 073 $ US | −1 059 485 000 $ US |
| 1994 | 10 749 816 311 $ US | −7 914 860 000 $ US |
| 1993 | 3 046 536 574 $ US | −5 692 332 332 $ US |
| 1992 | −16 849 952 852 $ US | −3 510 854 173 $ US |
| 1991 | −21 780 150 763 $ US | 3 029 889 879 $ US |
| 1990 | −13 134 204 728 $ US | 8 096 982 795 $ US |
| 1989 | −9 977 684 994 $ US | 4 964 855 541 $ US |
| 1988 | −8 630 857 567 $ US | 4 212 460 577 $ US |
| 1987 | 576 180 379 $ US | 323 648 995 $ US |
| 1986 | −13 970 909 215 $ US | 1 945 851 942 $ US |
| 1985 | −9 739 286 228 $ US | 4 815 481 324 $ US |
| 1984 | −8 612 447 582 $ US | 3 312 681 836 $ US |
| 1983 | −15 108 728 819 $ US | 3 447 293 430 $ US |
| 1982 | −4 890 560 840 $ US | 2 166 280 922 $ US |
| 1981 | −15 651 420 597 $ US | −354 736 981 $ US |
| 1980 | −14 164 364 821 $ US | −1 094 188 525 $ US |
| 1979 | 9 660 039 875 $ US | 125 448 026 $ US |
| 1978 | 978 445 643 $ US | 2 576 185 988 $ US |
| 1977 | 1 372 240 187 $ US | 1 300 000 008 $ US |
| 1976 | 6 107 914 246 $ US | 1 665 000 247 $ US |
| 1975 | 2 773 055 993 $ US | −81 081 003 $ US |
| 1974 | 10 783 896 083 $ US | 444 444 350 $ US |
| 1973 | 3 461 654 472 $ US | 1 000 000 034 $ US |
| 1972 | 247 261 280 $ US | 125 000 068 $ US |
| 1971 | 244 757 918 $ US | −199 999 955 $ US |
| 1970 | −300 301 792 $ US | 273 421 120 $ US |
| 1969 | −294 433 624 $ US | 0 $ US |
| 1968 | −261 589 868 $ US | 285 714 230 $ US |
| 1967 | −178 485 511 $ US | 606 060 620 $ US |
| 1966 | −89 504 575 $ US | 476 190 459 $ US |
| 1965 | −20 171 392 $ US | 588 235 264 $ US |
| 1964 | 3 653 727 $ US | 392 $ US |
| 1963 | 141 505 731 $ US | 396 $ US |
| 1962 | 38 426 764 $ US | −860 375 152 $ US |
| 1961 | −94 336 012 $ US | 338 $ US |
| 1960 | −148 623 522 $ US | 338 $ US |
En 2025, la balance commerciale de l'Iran affichait un déficit de 31,7 milliards de dollars et celle de l'Argentine un excédent de 5,1 milliards de dollars. En 1960, la balance commerciale de l'Iran affichait un déficit de 149 millions de dollars et celle de l'Argentine un excédent de 338 dollars.
Sur les années de 1960 à 2025 que les deux pays ont communiquées, la balance commerciale de l'Iran a été excédentaire pendant 36 des 65 années, et celle de l'Argentine pendant 45. Les balances commerciales de l'Iran et de l'Argentine ont été déficitaires en même temps pendant 6 de ces années, la dernière fois en 2023.
Iran vs Argentine : chiffres de la balance commerciale
|
Iran
|
Argentine
|
|
|---|---|---|
| Biens et services, $ US | −31,7 Md $US (2025) | +5,10 Md $US (2025) |
| % du PIB | −8,7 % (2025) | +0,7 % (2025) |
| Années d'excédent depuis 2000 | 17 sur 26 | 19 sur 26 |
| Solde des biens entre les deux, chiffres propres | −226 M $US (2023) | +326 M $US (2025) |
| Premier excédent en biens avec | Irak (+11,5 Md $US, 2023) | Chili (+5,47 Md $US, 2025) |
| Premier déficit en biens avec | Émirats arabes unis (−14,5 Md $US, 2023) | Chine (−6,88 Md $US, 2025) |
Comparer la balance commerciale de 2 pays au choix
Sources :
- Banque mondiale | Économie et croissance (1960–2025, mis à jour en octobre 2026)
- TradeMap (2001–2025, mis à jour en octobre 2026)
Creative Commons Attribution (CC BY) : vous pouvez copier, partager, adapter et réutiliser ce contenu, y compris à des fins commerciales, à condition de citer statistics.wiki et d’indiquer les modifications apportées. Les sources citées ci-dessus peuvent avoir leurs propres conditions de licence.