
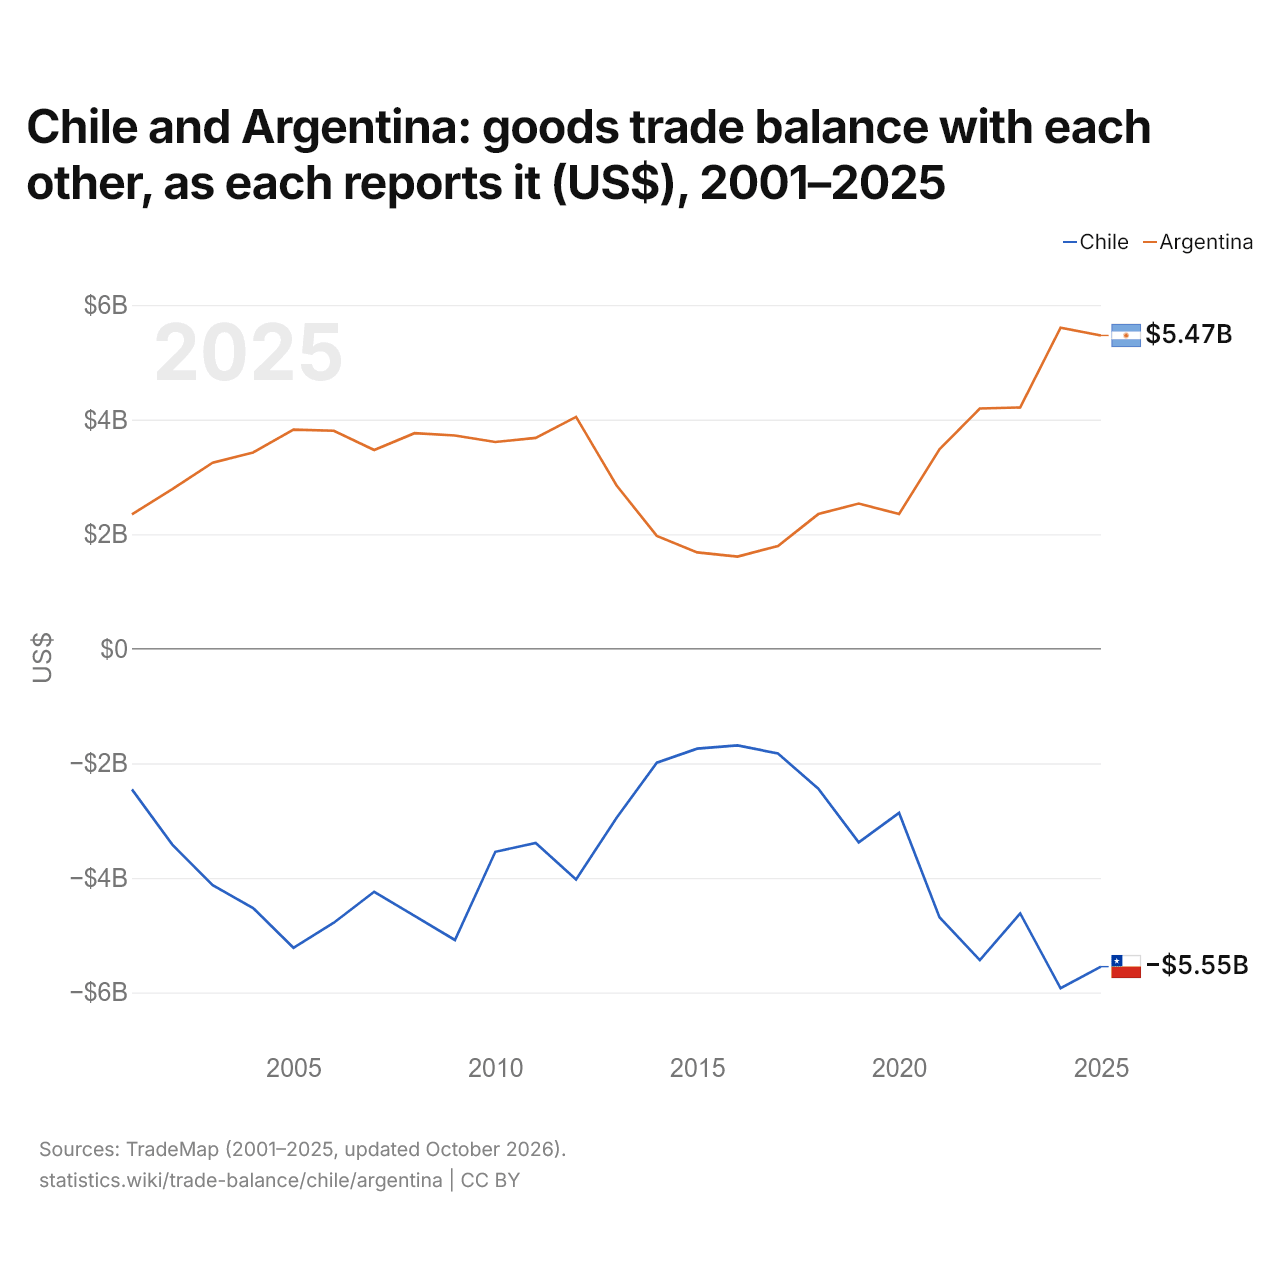
Le Chili et l'Argentine : solde de leur commerce de biens bilatéral, selon chacun ($ US), 2001–2025
| Année | $ US | |
|---|---|---|
| Chili | Argentine | |
| 2025 | −5 548 509 000 $ US | 5 467 825 000 $ US |
| 2024 | −5 927 335 000 $ US | 5 603 393 000 $ US |
| 2023 | −4 620 164 000 $ US | 4 211 695 000 $ US |
| 2022 | −5 434 609 000 $ US | 4 192 659 000 $ US |
| 2021 | −4 687 574 000 $ US | 3 480 503 000 $ US |
| 2020 | −2 865 715 000 $ US | 2 350 915 000 $ US |
| 2019 | −3 379 109 000 $ US | 2 534 192 000 $ US |
| 2018 | −2 442 184 000 $ US | 2 350 430 000 $ US |
| 2017 | −1 828 651 000 $ US | 1 793 830 000 $ US |
| 2016 | −1 687 689 000 $ US | 1 607 946 000 $ US |
| 2015 | −1 744 313 000 $ US | 1 681 039 000 $ US |
| 2014 | −1 988 901 000 $ US | 1 968 679 000 $ US |
| 2013 | −2 953 780 000 $ US | 2 852 662 000 $ US |
| 2012 | −4 030 242 000 $ US | 4 046 029 000 $ US |
| 2011 | −3 389 081 000 $ US | 3 679 518 000 $ US |
| 2010 | −3 544 582 000 $ US | 3 608 035 000 $ US |
| 2009 | −5 084 567 000 $ US | 3 721 673 000 $ US |
| 2008 | −4 661 947 000 $ US | 3 761 797 000 $ US |
| 2007 | −4 241 776 000 $ US | 3 467 716 000 $ US |
| 2006 | −4 783 134 000 $ US | 3 805 152 000 $ US |
| 2005 | −5 220 757 000 $ US | 3 825 224 000 $ US |
| 2004 | −4 525 704 000 $ US | 3 426 246 000 $ US |
| 2003 | −4 128 468 000 $ US | 3 246 491 000 $ US |
| 2002 | −3 420 046 000 $ US | 2 784 455 000 $ US |
| 2001 | −2 455 359 000 $ US | 2 345 970 000 $ US |
En 2025, selon le Chili, son commerce de biens avec l'Argentine affichait un déficit de 5,55 milliards de dollars ; selon l'Argentine, son commerce de biens avec le Chili affichait un excédent de 5,47 milliards de dollars. En 2001, les chiffres étaient un déficit de 2,46 milliards de dollars pour le Chili et un excédent de 2,35 milliards de dollars pour l'Argentine.
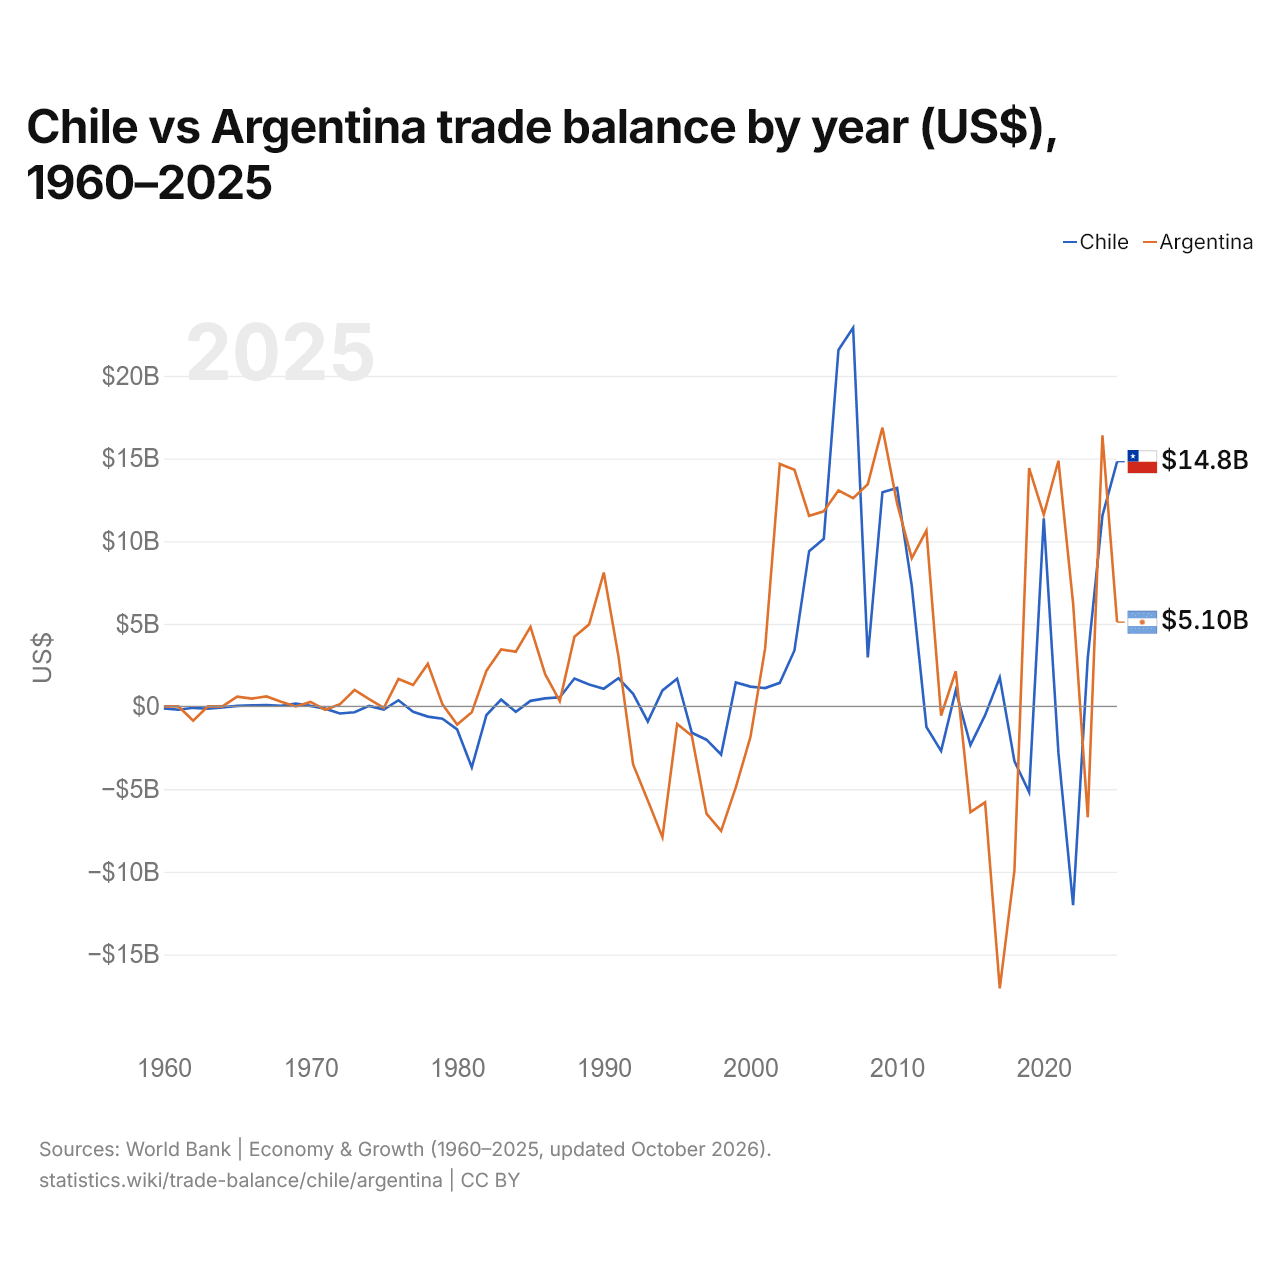
Chili vs Argentine : balance commerciale par année ($ US), 1960–2025
| Année | $ US | |
|---|---|---|
 Chili |
 Argentine |
|
| 2025 | 14 804 975 228 $ US | 5 100 613 800 $ US |
| 2024 | 11 545 176 279 $ US | 16 404 309 065 $ US |
| 2023 | 2 933 166 506 $ US | −6 704 568 723 $ US |
| 2022 | −12 014 002 658 $ US | 6 233 148 859 $ US |
| 2021 | −2 812 122 188 $ US | 14 863 213 107 $ US |
| 2020 | 11 375 796 052 $ US | 11 599 718 810 $ US |
| 2019 | −5 182 833 879 $ US | 14 413 857 778 $ US |
| 2018 | −3 310 530 298 $ US | −9 914 710 860 $ US |
| 2017 | 1 757 984 593 $ US | −17 049 937 664 $ US |
| 2016 | −527 476 210 $ US | −5 796 649 660 $ US |
| 2015 | −2 344 379 586 $ US | −6 393 090 843 $ US |
| 2014 | 968 625 055 $ US | 2 127 192 191 $ US |
| 2013 | −2 686 187 876 $ US | −549 718 918 $ US |
| 2012 | −1 241 559 881 $ US | 10 642 160 447 $ US |
| 2011 | 7 284 859 134 $ US | 8 971 671 281 $ US |
| 2010 | 13 219 086 595 $ US | 12 270 934 023 $ US |
| 2009 | 12 961 051 576 $ US | 16 864 736 859 $ US |
| 2008 | 2 965 553 776 $ US | 13 446 803 975 $ US |
| 2007 | 22 911 435 530 $ US | 12 594 785 133 $ US |
| 2006 | 21 568 421 478 $ US | 13 069 507 212 $ US |
| 2005 | 10 136 483 837 $ US | 11 805 942 344 $ US |
| 2004 | 9 394 522 805 $ US | 11 530 324 282 $ US |
| 2003 | 3 387 497 528 $ US | 14 311 606 659 $ US |
| 2002 | 1 426 773 699 $ US | 14 670 786 469 $ US |
| 2001 | 1 109 305 458 $ US | 3 508 536 600 $ US |
| 2000 | 1 202 974 079 $ US | −1 846 455 600 $ US |
| 1999 | 1 453 087 040 $ US | −4 900 400 000 $ US |
| 1998 | −2 909 838 412 $ US | −7 530 100 000 $ US |
| 1997 | −2 009 169 758 $ US | −6 485 300 000 $ US |
| 1996 | −1 587 287 186 $ US | −1 767 000 000 $ US |
| 1995 | 1 678 472 004 $ US | −1 059 485 000 $ US |
| 1994 | 975 504 071 $ US | −7 914 860 000 $ US |
| 1993 | −910 684 560 $ US | −5 692 332 332 $ US |
| 1992 | 767 144 020 $ US | −3 510 854 173 $ US |
| 1991 | 1 706 007 584 $ US | 3 029 889 879 $ US |
| 1990 | 1 074 813 125 $ US | 8 096 982 795 $ US |
| 1989 | 1 325 335 767 $ US | 4 964 855 541 $ US |
| 1988 | 1 690 789 705 $ US | 4 212 460 577 $ US |
| 1987 | 555 122 127 $ US | 323 648 995 $ US |
| 1986 | 488 799 123 $ US | 1 945 851 942 $ US |
| 1985 | 339 874 219 $ US | 4 815 481 324 $ US |
| 1984 | −326 526 915 $ US | 3 312 681 836 $ US |
| 1983 | 412 516 962 $ US | 3 447 293 430 $ US |
| 1982 | −515 371 499 $ US | 2 166 280 922 $ US |
| 1981 | −3 683 471 885 $ US | −354 736 981 $ US |
| 1980 | −1 387 218 822 $ US | −1 094 188 525 $ US |
| 1979 | −745 793 488 $ US | 125 448 026 $ US |
| 1978 | −613 837 751 $ US | 2 576 185 988 $ US |
| 1977 | −320 362 052 $ US | 1 300 000 008 $ US |
| 1976 | 375 782 332 $ US | 1 665 000 247 $ US |
| 1975 | −187 399 628 $ US | −81 081 003 $ US |
| 1974 | 37 116 935 $ US | 444 444 350 $ US |
| 1973 | −351 014 126 $ US | 1 000 000 034 $ US |
| 1972 | −426 238 589 $ US | 125 000 068 $ US |
| 1971 | −131 010 402 $ US | −199 999 955 $ US |
| 1970 | 35 341 639 $ US | 273 421 120 $ US |
| 1969 | 168 513 808 $ US | 0 $ US |
| 1968 | 43 189 791 $ US | 285 714 230 $ US |
| 1967 | 80 542 423 $ US | 606 060 620 $ US |
| 1966 | 67 017 398 $ US | 476 190 459 $ US |
| 1965 | 38 087 742 $ US | 588 235 264 $ US |
| 1964 | −58 309 926 $ US | 392 $ US |
| 1963 | −138 188 656 $ US | 396 $ US |
| 1962 | −81 469 754 $ US | −860 375 152 $ US |
| 1961 | −198 972 381 $ US | 338 $ US |
| 1960 | −114 140 000 $ US | 338 $ US |
En 2025, la balance commerciale du Chili affichait un excédent de 14,8 milliards de dollars et celle de l'Argentine un excédent de 5,1 milliards de dollars ; l'excédent du Chili était 2,9 fois plus grand. En 1960, la balance commerciale du Chili affichait un déficit de 114 millions de dollars et celle de l'Argentine un excédent de 338 dollars.
Sur les années de 1960 à 2025 que les deux pays ont communiquées, la balance commerciale du Chili a été excédentaire pendant 37 des 65 années, et celle de l'Argentine pendant 45. Les balances commerciales du Chili et de l'Argentine ont été déficitaires en même temps pendant 13 de ces années, la dernière fois en 2018.
Chili vs Argentine : chiffres de la balance commerciale
|
Chili
|
Argentine
|
|
|---|---|---|
| Biens et services, $ US | +14,8 Md $US (2025) | +5,10 Md $US (2025) |
| % du PIB | +4,1 % (2025) | +0,7 % (2025) |
| Années d'excédent depuis 2000 | 18 sur 26 | 19 sur 26 |
| Solde des biens entre les deux, chiffres propres | −5,55 Md $US (2025) | +5,47 Md $US (2025) |
| Premier excédent en biens avec | Chine (+15,1 Md $US, 2025) | Chili (+5,47 Md $US, 2025) |
| Premier déficit en biens avec | Argentine (−5,55 Md $US, 2025) | Chine (−6,88 Md $US, 2025) |
Comparer la balance commerciale de 2 pays au choix
Sources :
- Banque mondiale | Économie et croissance (1960–2025, mis à jour en octobre 2026)
- TradeMap (2001–2025, mis à jour en octobre 2026)
Creative Commons Attribution (CC BY) : vous pouvez copier, partager, adapter et réutiliser ce contenu, y compris à des fins commerciales, à condition de citer statistics.wiki et d’indiquer les modifications apportées. Les sources citées ci-dessus peuvent avoir leurs propres conditions de licence.