
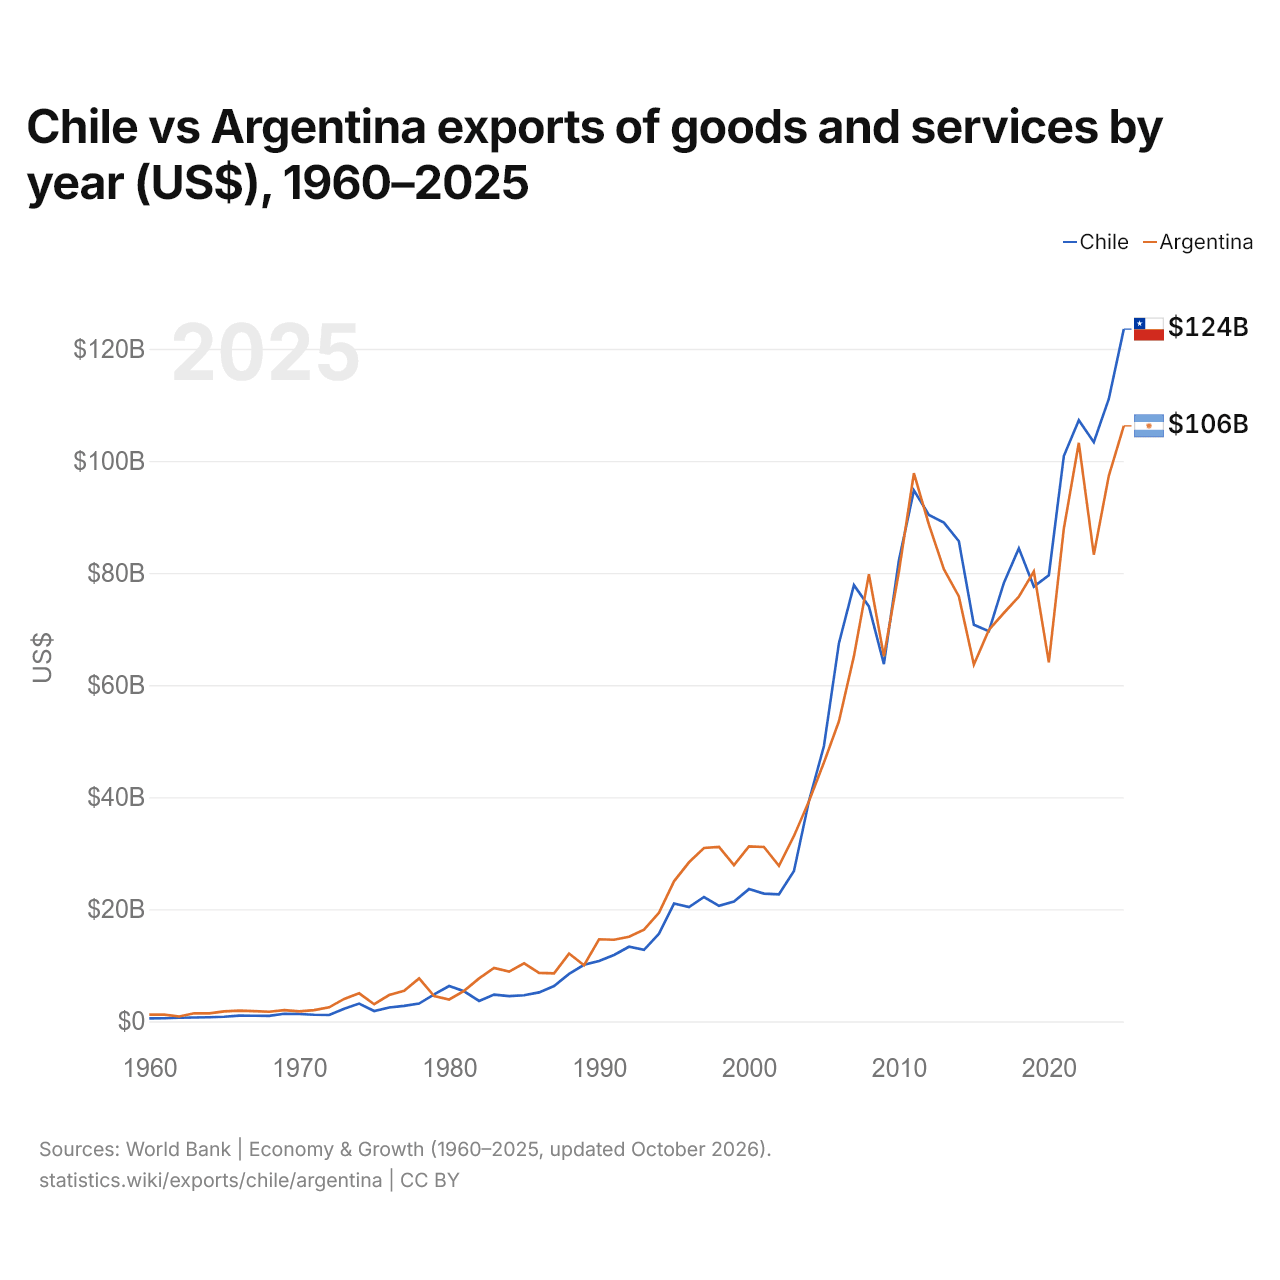
Chili vs Argentine : exportations de biens et services par année ($ US), 1960–2025
| Année | $ US | |
|---|---|---|
 Chili |
 Argentine |
|
| 2025 | 123 520 198 503 $ US | 106 260 393 151 $ US |
| 2024 | 111 066 428 902 $ US | 97 349 127 043 $ US |
| 2023 | 103 343 502 222 $ US | 83 276 004 575 $ US |
| 2022 | 107 256 627 766 $ US | 103 224 756 800 $ US |
| 2021 | 100 881 456 526 $ US | 87 906 118 245 $ US |
| 2020 | 79 592 398 711 $ US | 64 053 810 078 $ US |
| 2019 | 77 571 036 969 $ US | 80 259 482 469 $ US |
| 2018 | 84 405 337 955 $ US | 75 766 598 613 $ US |
| 2017 | 78 238 304 190 $ US | 72 860 557 903 $ US |
| 2016 | 69 624 959 647 $ US | 69 842 604 407 $ US |
| 2015 | 70 773 875 084 $ US | 63 671 789 069 $ US |
| 2014 | 85 665 253 039 $ US | 75 818 867 911 $ US |
| 2013 | 89 009 023 666 $ US | 80 690 471 898 $ US |
| 2012 | 90 376 117 071 $ US | 88 655 850 854 $ US |
| 2011 | 94 745 538 460 $ US | 97 809 980 731 $ US |
| 2010 | 82 271 077 297 $ US | 80 208 867 996 $ US |
| 2009 | 63 756 458 033 $ US | 65 133 480 388 $ US |
| 2008 | 74 049 222 066 $ US | 79 762 958 392 $ US |
| 2007 | 77 844 966 314 $ US | 65 162 321 195 $ US |
| 2006 | 67 484 496 355 $ US | 53 550 250 227 $ US |
| 2005 | 49 132 371 504 $ US | 46 198 180 131 $ US |
| 2004 | 39 319 047 777 $ US | 39 266 996 606 $ US |
| 2003 | 26 819 043 116 $ US | 33 084 505 278 $ US |
| 2002 | 22 665 229 050 $ US | 27 736 610 298 $ US |
| 2001 | 22 794 630 056 $ US | 31 112 418 400 $ US |
| 2000 | 23 598 874 231 $ US | 31 223 690 400 $ US |
| 1999 | 21 395 654 975 $ US | 27 862 300 000 $ US |
| 1998 | 20 615 225 914 $ US | 31 137 200 000 $ US |
| 1997 | 22 188 168 722 $ US | 30 928 400 000 $ US |
| 1996 | 20 392 925 082 $ US | 28 381 400 000 $ US |
| 1995 | 21 024 502 601 $ US | 24 978 532 000 $ US |
| 1994 | 15 653 663 029 $ US | 19 385 100 000 $ US |
| 1993 | 12 755 908 986 $ US | 16 357 317 317 $ US |
| 1992 | 13 307 830 022 $ US | 15 095 261 860 $ US |
| 1991 | 11 846 241 659 $ US | 14 561 091 033 $ US |
| 1990 | 10 767 995 923 $ US | 14 643 479 947 $ US |
| 1989 | 10 088 686 694 $ US | 10 006 623 327 $ US |
| 1988 | 8 456 927 621 $ US | 12 094 686 105 $ US |
| 1987 | 6 306 734 128 $ US | 8 566 904 947 $ US |
| 1986 | 5 162 723 063 $ US | 8 641 279 278 $ US |
| 1985 | 4 651 072 800 $ US | 10 345 475 059 $ US |
| 1984 | 4 485 352 694 $ US | 8 873 730 059 $ US |
| 1983 | 4 769 390 034 $ US | 9 515 669 467 $ US |
| 1982 | 3 635 010 932 $ US | 7 663 966 256 $ US |
| 1981 | 5 363 825 291 $ US | 5 445 263 190 $ US |
| 1980 | 6 292 627 054 $ US | 3 895 791 555 $ US |
| 1979 | 4 825 253 306 $ US | 4 508 960 597 $ US |
| 1978 | 3 169 461 902 $ US | 7 665 724 160 $ US |
| 1977 | 2 755 061 055 $ US | 5 459 999 881 $ US |
| 1976 | 2 475 236 058 $ US | 4 695 000 304 $ US |
| 1975 | 1 837 775 113 $ US | 3 054 054 017 $ US |
| 1974 | 3 166 203 510 $ US | 4 999 999 840 $ US |
| 1973 | 2 238 225 385 $ US | 4 000 000 136 $ US |
| 1972 | 1 131 291 625 $ US | 2 500 000 047 $ US |
| 1971 | 1 178 754 034 $ US | 2 000 000 003 $ US |
| 1970 | 1 312 710 942 $ US | 1 769 210 603 $ US |
| 1969 | 1 344 218 032 $ US | 2 000 000 041 $ US |
| 1968 | 985 246 219 $ US | 1 714 285 705 $ US |
| 1967 | 991 413 773 $ US | 1 818 181 858 $ US |
| 1966 | 1 027 139 444 $ US | 1 904 761 830 $ US |
| 1965 | 811 080 139 $ US | 1 764 705 803 $ US |
| 1964 | 730 563 069 $ US | 1 424 603 255 $ US |
| 1963 | 687 611 591 $ US | 1 441 753 550 $ US |
| 1962 | 639 219 282 $ US | 860 375 634 $ US |
| 1961 | 550 751 429 $ US | 1 206 915 940 $ US |
| 1960 | 536 609 091 $ US | 1 206 418 458 $ US |
En 2025, les exportations de biens et services du Chili s'élevaient à 124 milliards de dollars et celles de l'Argentine à 106 milliards de dollars : celles du Chili étaient supérieures de 16 %. En 1960, les exportations de l'Argentine étaient 2,2 fois plus élevées : 537 millions de dollars pour le Chili et 1,21 milliard de dollars pour l'Argentine.
Les exportations de biens et services du Chili sont supérieures à celles de l'Argentine chaque année depuis 2020.
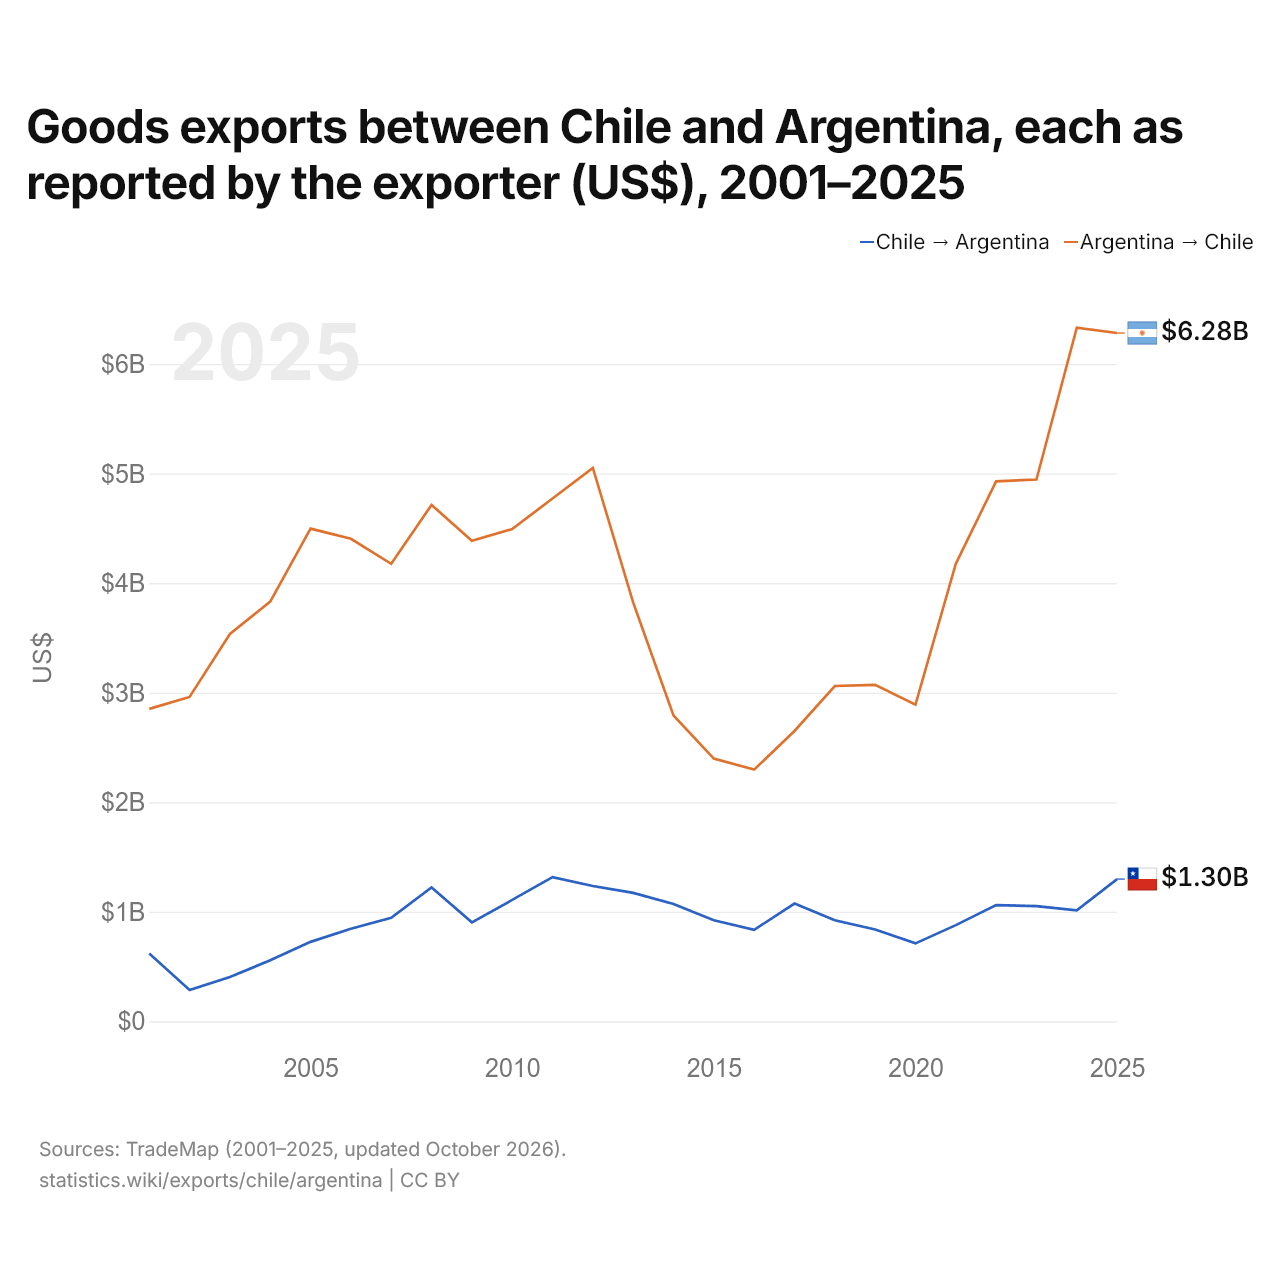
Exportations de biens entre le Chili et l'Argentine, selon chaque exportateur ($ US), 2001–2025
| Année | $ US | |
|---|---|---|
| Chili → Argentine | Argentine → Chili | |
| 2025 | 1 298 517 000 $ US | 6 282 459 000 $ US |
| 2024 | 1 013 720 000 $ US | 6 330 312 000 $ US |
| 2023 | 1 052 052 000 $ US | 4 945 036 000 $ US |
| 2022 | 1 061 236 000 $ US | 4 929 082 000 $ US |
| 2021 | 877 929 000 $ US | 4 176 196 000 $ US |
| 2020 | 711 686 000 $ US | 2 890 384 000 $ US |
| 2019 | 838 411 000 $ US | 3 070 778 000 $ US |
| 2018 | 921 938 000 $ US | 3 060 325 000 $ US |
| 2017 | 1 074 503 000 $ US | 2 650 077 000 $ US |
| 2016 | 835 568 000 $ US | 2 297 397 000 $ US |
| 2015 | 921 931 000 $ US | 2 398 278 000 $ US |
| 2014 | 1 071 425 000 $ US | 2 792 208 000 $ US |
| 2013 | 1 172 397 000 $ US | 3 823 118 000 $ US |
| 2012 | 1 235 287 000 $ US | 5 051 834 000 $ US |
| 2011 | 1 315 999 000 $ US | 4 772 318 000 $ US |
| 2010 | 1 108 251 000 $ US | 4 493 083 000 $ US |
| 2009 | 903 370 000 $ US | 4 386 659 000 $ US |
| 2008 | 1 222 708 000 $ US | 4 713 567 000 $ US |
| 2007 | 944 604 000 $ US | 4 176 201 000 $ US |
| 2006 | 845 127 000 $ US | 4 404 623 000 $ US |
| 2005 | 725 426 000 $ US | 4 497 161 000 $ US |
| 2004 | 556 968 000 $ US | 3 830 577 000 $ US |
| 2003 | 404 957 000 $ US | 3 536 326 000 $ US |
| 2002 | 285 770 000 $ US | 2 961 084 000 $ US |
| 2001 | 618 699 000 $ US | 2 851 693 000 $ US |
En 2025, les exportations de biens du Chili vers l'Argentine, selon le Chili, s'élevaient à 1,3 milliard de dollars, et celles de l'Argentine vers le Chili, selon l'Argentine, à 6,28 milliards de dollars : 4,8 fois plus pour celles de l'Argentine. En 2001, elles s'élevaient à 619 millions de dollars pour le Chili et à 2,85 milliards de dollars pour l'Argentine.
Chili vs Argentine : chiffres des exportations
|
Chili
|
Argentine
|
|
|---|---|---|
| Exportations | 124 Md $US (2025) | 106 Md $US (2025) |
| Rang mondial | 44/176 | 47/176 |
| Part mondiale | 0,35 % | 0,3 % |
| % du PIB | 34,6 % | 15,6 % |
| Première catégorie de biens | Pétrole, gaz, minerais et autres matières premières (41,2 %, 2025) | Aliments transformés, huiles, aliments pour animaux, boissons et tabac (25,6 %, 2025) |
| Première destination des biens | Chine (35 %, 2025) | Brésil (14,7 %, 2025) |
Comparer les exportations de 2 pays au choix
Sources :
- Banque mondiale | Économie et croissance (1960–2025, mis à jour en octobre 2026)
- TradeMap (2001–2025, mis à jour en octobre 2026)
Creative Commons Attribution (CC BY) : vous pouvez copier, partager, adapter et réutiliser ce contenu, y compris à des fins commerciales, à condition de citer statistics.wiki et d’indiquer les modifications apportées. Les sources citées ci-dessus peuvent avoir leurs propres conditions de licence.