
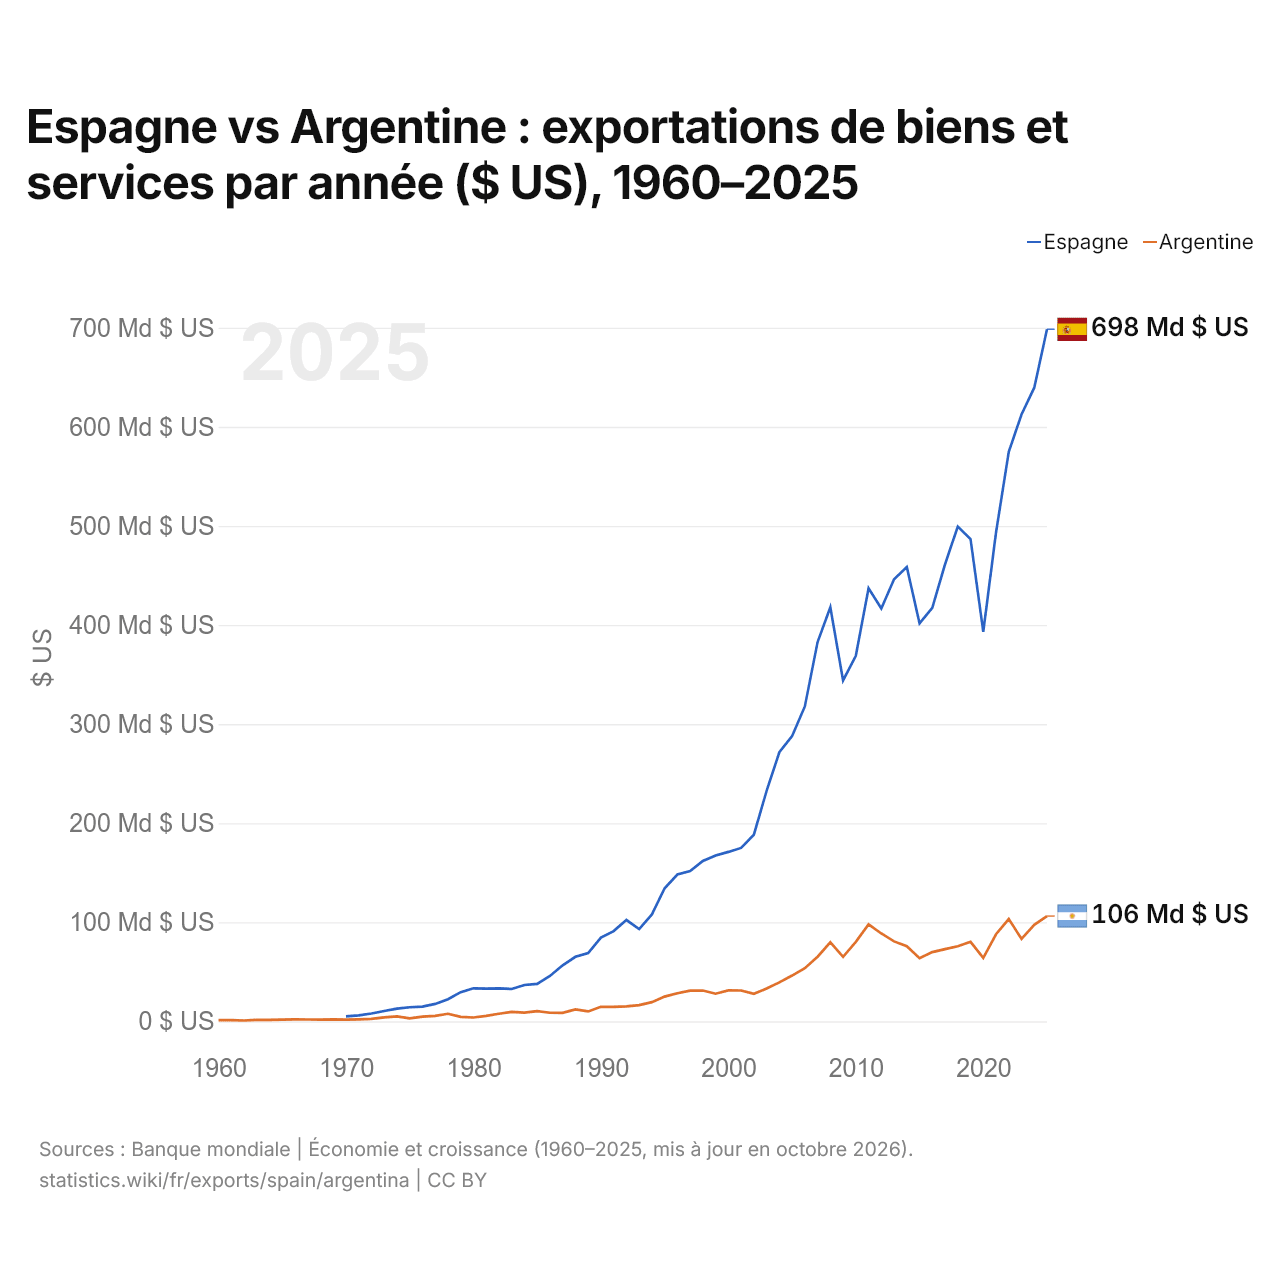
Espagne vs Argentine : exportations de biens et services par année ($ US), 1960–2025
| Année | $ US | |
|---|---|---|
 Espagne |
 Argentine |
|
| 2025 | 698 476 476 631 $ US | 106 260 393 151 $ US |
| 2024 | 639 462 804 274 $ US | 97 349 127 043 $ US |
| 2023 | 612 433 794 394 $ US | 83 276 004 575 $ US |
| 2022 | 574 783 432 054 $ US | 103 224 756 800 $ US |
| 2021 | 493 273 673 721 $ US | 87 906 118 245 $ US |
| 2020 | 393 139 331 916 $ US | 64 053 810 078 $ US |
| 2019 | 486 670 273 122 $ US | 80 259 482 469 $ US |
| 2018 | 499 282 766 700 $ US | 75 766 598 613 $ US |
| 2017 | 461 297 400 644 $ US | 72 860 557 903 $ US |
| 2016 | 417 367 780 825 $ US | 69 842 604 407 $ US |
| 2015 | 401 637 009 329 $ US | 63 671 789 069 $ US |
| 2014 | 458 508 132 692 $ US | 75 818 867 911 $ US |
| 2013 | 446 190 552 101 $ US | 80 690 471 898 $ US |
| 2012 | 416 597 866 010 $ US | 88 655 850 854 $ US |
| 2011 | 437 172 778 239 $ US | 97 809 980 731 $ US |
| 2010 | 368 818 353 817 $ US | 80 208 867 996 $ US |
| 2009 | 343 996 583 489 $ US | 65 133 480 388 $ US |
| 2008 | 417 991 645 730 $ US | 79 762 958 392 $ US |
| 2007 | 382 818 371 650 $ US | 65 162 321 195 $ US |
| 2006 | 317 776 995 049 $ US | 53 550 250 227 $ US |
| 2005 | 287 980 772 159 $ US | 46 198 180 131 $ US |
| 2004 | 271 611 046 439 $ US | 39 266 996 606 $ US |
| 2003 | 232 580 150 552 $ US | 33 084 505 278 $ US |
| 2002 | 188 324 245 464 $ US | 27 736 610 298 $ US |
| 2001 | 175 010 487 833 $ US | 31 112 418 400 $ US |
| 2000 | 170 991 162 038 $ US | 31 223 690 400 $ US |
| 1999 | 167 415 361 762 $ US | 27 862 300 000 $ US |
| 1998 | 161 797 527 564 $ US | 31 137 200 000 $ US |
| 1997 | 151 657 954 545 $ US | 30 928 400 000 $ US |
| 1996 | 148 187 311 178 $ US | 28 381 400 000 $ US |
| 1995 | 134 295 436 349 $ US | 24 978 532 000 $ US |
| 1994 | 107 879 062 228 $ US | 19 385 100 000 $ US |
| 1993 | 93 084 945 745 $ US | 16 357 317 317 $ US |
| 1992 | 102 239 554 689 $ US | 15 095 261 860 $ US |
| 1991 | 91 063 265 012 $ US | 14 561 091 033 $ US |
| 1990 | 84 463 395 364 $ US | 14 643 479 947 $ US |
| 1989 | 68 933 506 676 $ US | 10 006 623 327 $ US |
| 1988 | 65 156 156 263 $ US | 12 094 686 105 $ US |
| 1987 | 56 558 264 385 $ US | 8 566 904 947 $ US |
| 1986 | 45 782 844 244 $ US | 8 641 279 278 $ US |
| 1985 | 37 762 612 524 $ US | 10 345 475 059 $ US |
| 1984 | 36 702 571 931 $ US | 8 873 730 059 $ US |
| 1983 | 32 644 516 241 $ US | 9 515 669 467 $ US |
| 1982 | 33 310 336 211 $ US | 7 663 966 256 $ US |
| 1981 | 33 059 607 136 $ US | 5 445 263 190 $ US |
| 1980 | 33 299 965 189 $ US | 3 895 791 555 $ US |
| 1979 | 29 440 976 698 $ US | 4 508 960 597 $ US |
| 1978 | 22 314 444 444 $ US | 7 665 724 160 $ US |
| 1977 | 17 570 821 468 $ US | 5 459 999 881 $ US |
| 1976 | 14 908 642 129 $ US | 4 695 000 304 $ US |
| 1975 | 14 219 846 377 $ US | 3 054 054 017 $ US |
| 1974 | 12 838 993 366 $ US | 4 999 999 840 $ US |
| 1973 | 10 487 210 166 $ US | 4 000 000 136 $ US |
| 1972 | 7 896 181 724 $ US | 2 500 000 047 $ US |
| 1971 | 6 073 291 018 $ US | 2 000 000 003 $ US |
| 1970 | 4 978 036 606 $ US | 1 769 210 603 $ US |
| 1969 | - | 2 000 000 041 $ US |
| 1968 | - | 1 714 285 705 $ US |
| 1967 | - | 1 818 181 858 $ US |
| 1966 | - | 1 904 761 830 $ US |
| 1965 | - | 1 764 705 803 $ US |
| 1964 | - | 1 424 603 255 $ US |
| 1963 | - | 1 441 753 550 $ US |
| 1962 | - | 860 375 634 $ US |
| 1961 | - | 1 206 915 940 $ US |
| 1960 | - | 1 206 418 458 $ US |
En 2025, les exportations de biens et services de l'Espagne s'élevaient à 698 milliards de dollars et celles de l'Argentine à 106 milliards de dollars : celles de l'Espagne étaient 6,6 fois plus élevées. En 1970, les exportations de l'Espagne étaient 2,8 fois plus élevées : 4,98 milliards de dollars pour l'Espagne et 1,77 milliard de dollars pour l'Argentine.
Les exportations de biens et services de l'Espagne sont supérieures à celles de l'Argentine chaque année depuis 1970.
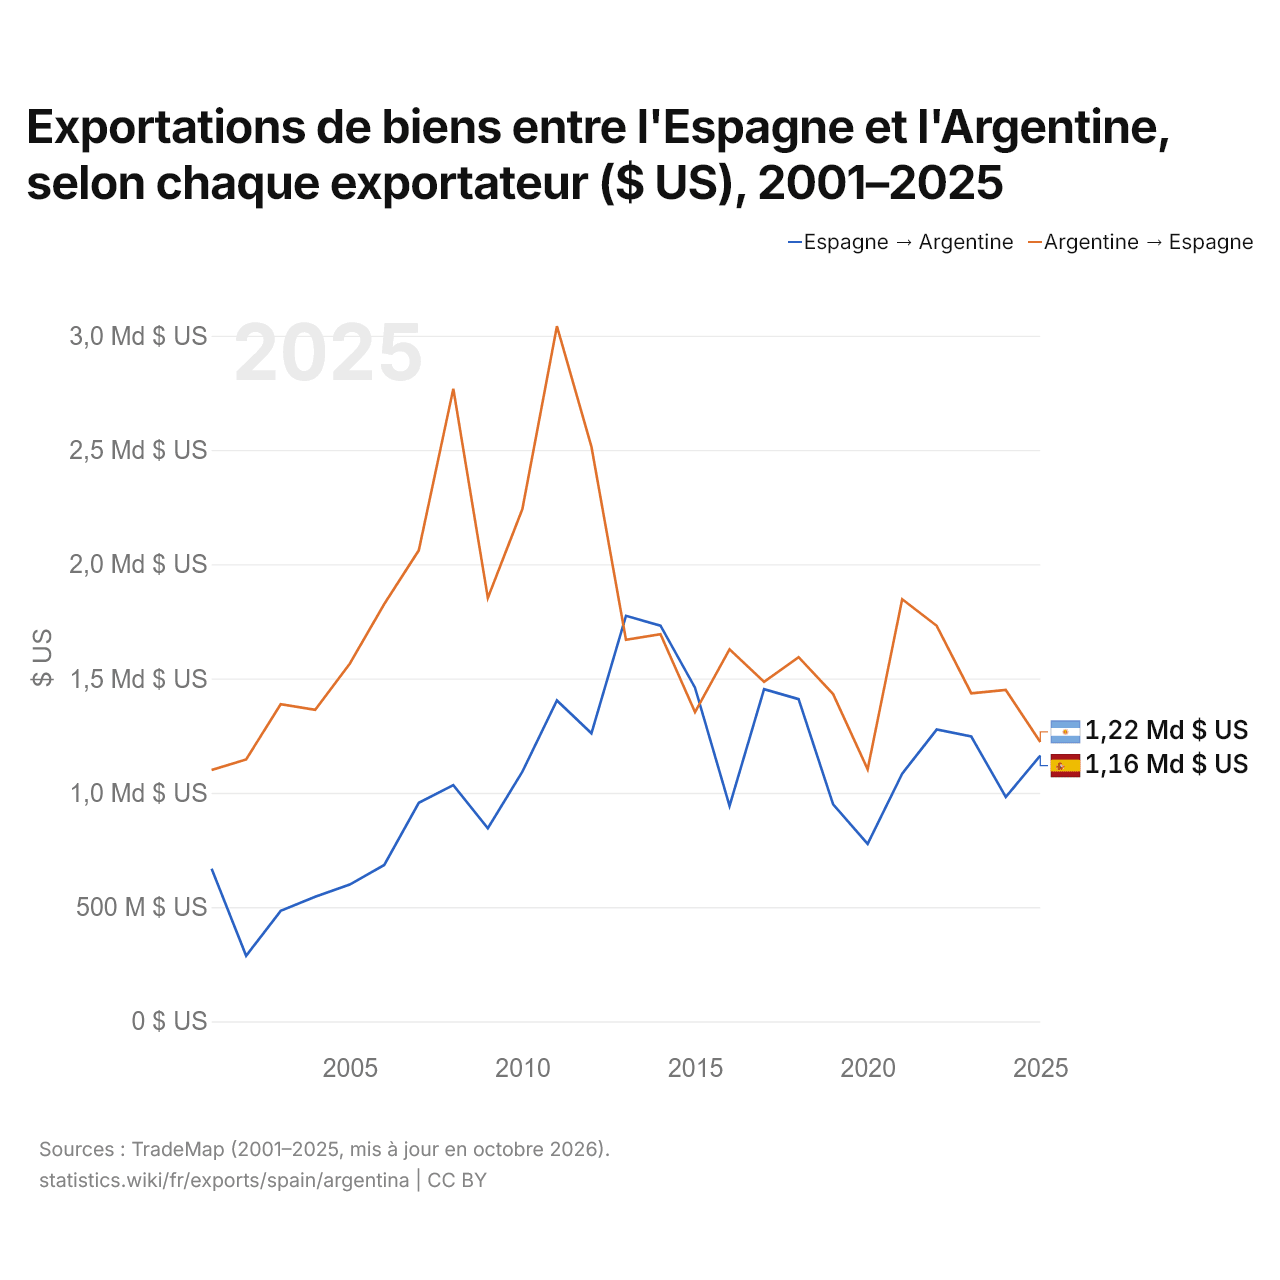
Exportations de biens entre l'Espagne et l'Argentine, selon chaque exportateur ($ US), 2001–2025
| Année | $ US | |
|---|---|---|
| Espagne → Argentine | Argentine → Espagne | |
| 2025 | 1 162 744 000 $ US | 1 222 299 000 $ US |
| 2024 | 981 517 000 $ US | 1 449 998 000 $ US |
| 2023 | 1 246 493 000 $ US | 1 435 695 000 $ US |
| 2022 | 1 276 821 000 $ US | 1 730 850 000 $ US |
| 2021 | 1 083 780 000 $ US | 1 846 778 000 $ US |
| 2020 | 776 720 000 $ US | 1 102 833 000 $ US |
| 2019 | 949 564 000 $ US | 1 431 720 000 $ US |
| 2018 | 1 409 945 000 $ US | 1 593 679 000 $ US |
| 2017 | 1 453 565 000 $ US | 1 485 679 000 $ US |
| 2016 | 942 859 000 $ US | 1 627 951 000 $ US |
| 2015 | 1 460 018 000 $ US | 1 352 932 000 $ US |
| 2014 | 1 731 168 000 $ US | 1 693 951 000 $ US |
| 2013 | 1 774 536 000 $ US | 1 669 472 000 $ US |
| 2012 | 1 260 219 000 $ US | 2 514 557 000 $ US |
| 2011 | 1 404 265 000 $ US | 3 041 933 000 $ US |
| 2010 | 1 092 302 000 $ US | 2 241 801 000 $ US |
| 2009 | 844 877 000 $ US | 1 852 418 000 $ US |
| 2008 | 1 033 913 000 $ US | 2 767 884 000 $ US |
| 2007 | 956 500 000 $ US | 2 060 903 000 $ US |
| 2006 | 684 524 000 $ US | 1 825 812 000 $ US |
| 2005 | 598 272 000 $ US | 1 564 775 000 $ US |
| 2004 | 544 975 000 $ US | 1 362 930 000 $ US |
| 2003 | 483 675 000 $ US | 1 387 896 000 $ US |
| 2002 | 286 752 000 $ US | 1 145 845 000 $ US |
| 2001 | 667 826 000 $ US | 1 099 533 000 $ US |
En 2025, les exportations de biens de l'Espagne vers l'Argentine, selon l'Espagne, s'élevaient à 1,16 milliard de dollars, et celles de l'Argentine vers l'Espagne, selon l'Argentine, à 1,22 milliard de dollars : 5,1 % de plus pour celles de l'Argentine. En 2001, elles s'élevaient à 668 millions de dollars pour l'Espagne et à 1,1 milliard de dollars pour l'Argentine.
Espagne vs Argentine : chiffres des exportations
|
Espagne
|
Argentine
|
|
|---|---|---|
| Exportations | 698 Md $US (2025) | 106 Md $US (2025) |
| Rang mondial | 16/176 | 47/176 |
| Part mondiale | 2 % | 0,3 % |
| % du PIB | 36,6 % | 15,6 % |
| Première catégorie de biens | Machines, électronique et véhicules (30,1 %, 2025) | Aliments transformés, huiles, aliments pour animaux, boissons et tabac (25,6 %, 2025) |
| Première destination des biens | France (14,1 %, 2025) | Brésil (14,7 %, 2025) |
Comparer les exportations de 2 pays au choix
Sources :
- Banque mondiale | Économie et croissance (1960–2025, mis à jour en octobre 2026)
- TradeMap (2001–2025, mis à jour en octobre 2026)
Creative Commons Attribution (CC BY) : vous pouvez copier, partager, adapter et réutiliser ce contenu, y compris à des fins commerciales, à condition de citer statistics.wiki et d’indiquer les modifications apportées. Les sources citées ci-dessus peuvent avoir leurs propres conditions de licence.