
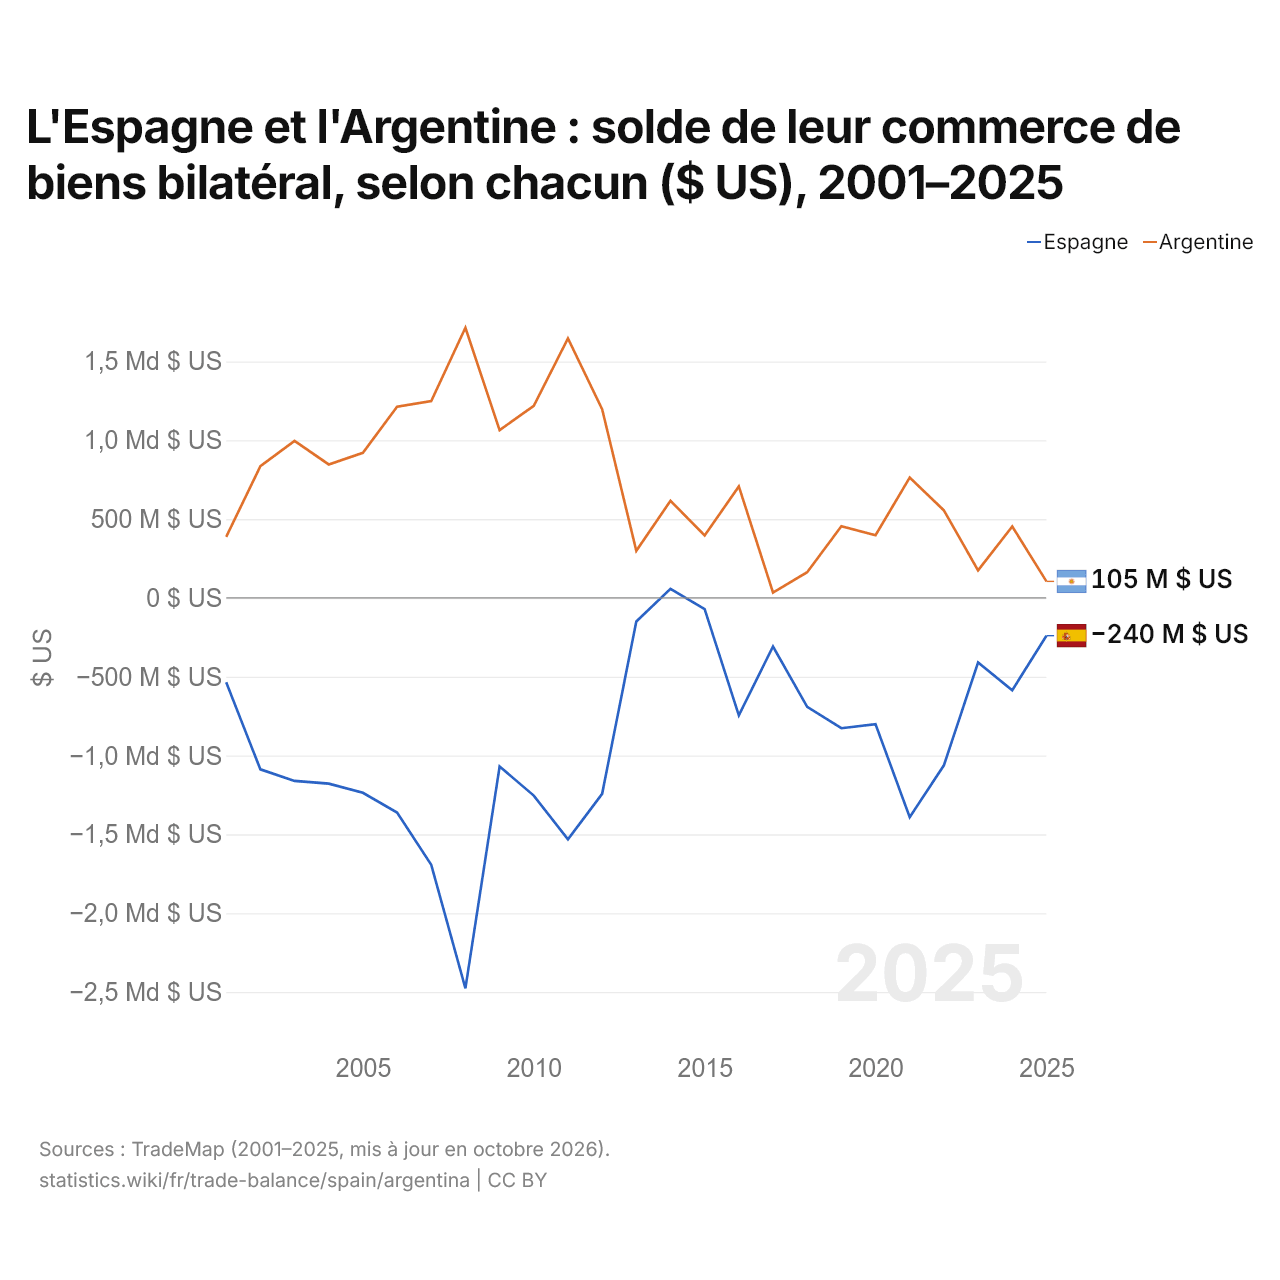
L'Espagne et l'Argentine : solde de leur commerce de biens bilatéral, selon chacun ($ US), 2001–2025
| Année | $ US | |
|---|---|---|
| Espagne | Argentine | |
| 2025 | −240 072 000 $ US | 104 506 000 $ US |
| 2024 | −585 951 000 $ US | 453 395 000 $ US |
| 2023 | −410 237 000 $ US | 174 601 000 $ US |
| 2022 | −1 062 313 000 $ US | 554 735 000 $ US |
| 2021 | −1 391 143 000 $ US | 763 165 000 $ US |
| 2020 | −801 057 000 $ US | 397 266 000 $ US |
| 2019 | −827 017 000 $ US | 454 489 000 $ US |
| 2018 | −691 425 000 $ US | 162 857 000 $ US |
| 2017 | −308 150 000 $ US | 33 809 000 $ US |
| 2016 | −744 998 000 $ US | 706 952 000 $ US |
| 2015 | −71 285 000 $ US | 395 779 000 $ US |
| 2014 | 57 373 000 $ US | 615 993 000 $ US |
| 2013 | −150 119 000 $ US | 298 280 000 $ US |
| 2012 | −1 242 912 000 $ US | 1 197 354 000 $ US |
| 2011 | −1 531 799 000 $ US | 1 646 293 000 $ US |
| 2010 | −1 254 142 000 $ US | 1 217 654 000 $ US |
| 2009 | −1 069 375 000 $ US | 1 064 377 000 $ US |
| 2008 | −2 476 739 000 $ US | 1 713 908 000 $ US |
| 2007 | −1 693 203 000 $ US | 1 248 257 000 $ US |
| 2006 | −1 361 365 000 $ US | 1 212 721 000 $ US |
| 2005 | −1 236 513 000 $ US | 919 723 000 $ US |
| 2004 | −1 178 136 000 $ US | 846 610 000 $ US |
| 2003 | −1 161 210 000 $ US | 995 658 000 $ US |
| 2002 | −1 087 923 000 $ US | 834 864 000 $ US |
| 2001 | −535 648 000 $ US | 387 175 000 $ US |
En 2025, selon l'Espagne, son commerce de biens avec l'Argentine affichait un déficit de 240 millions de dollars ; selon l'Argentine, son commerce de biens avec l'Espagne affichait un excédent de 105 millions de dollars. En 2001, les chiffres étaient un déficit de 536 millions de dollars pour l'Espagne et un excédent de 387 millions de dollars pour l'Argentine.
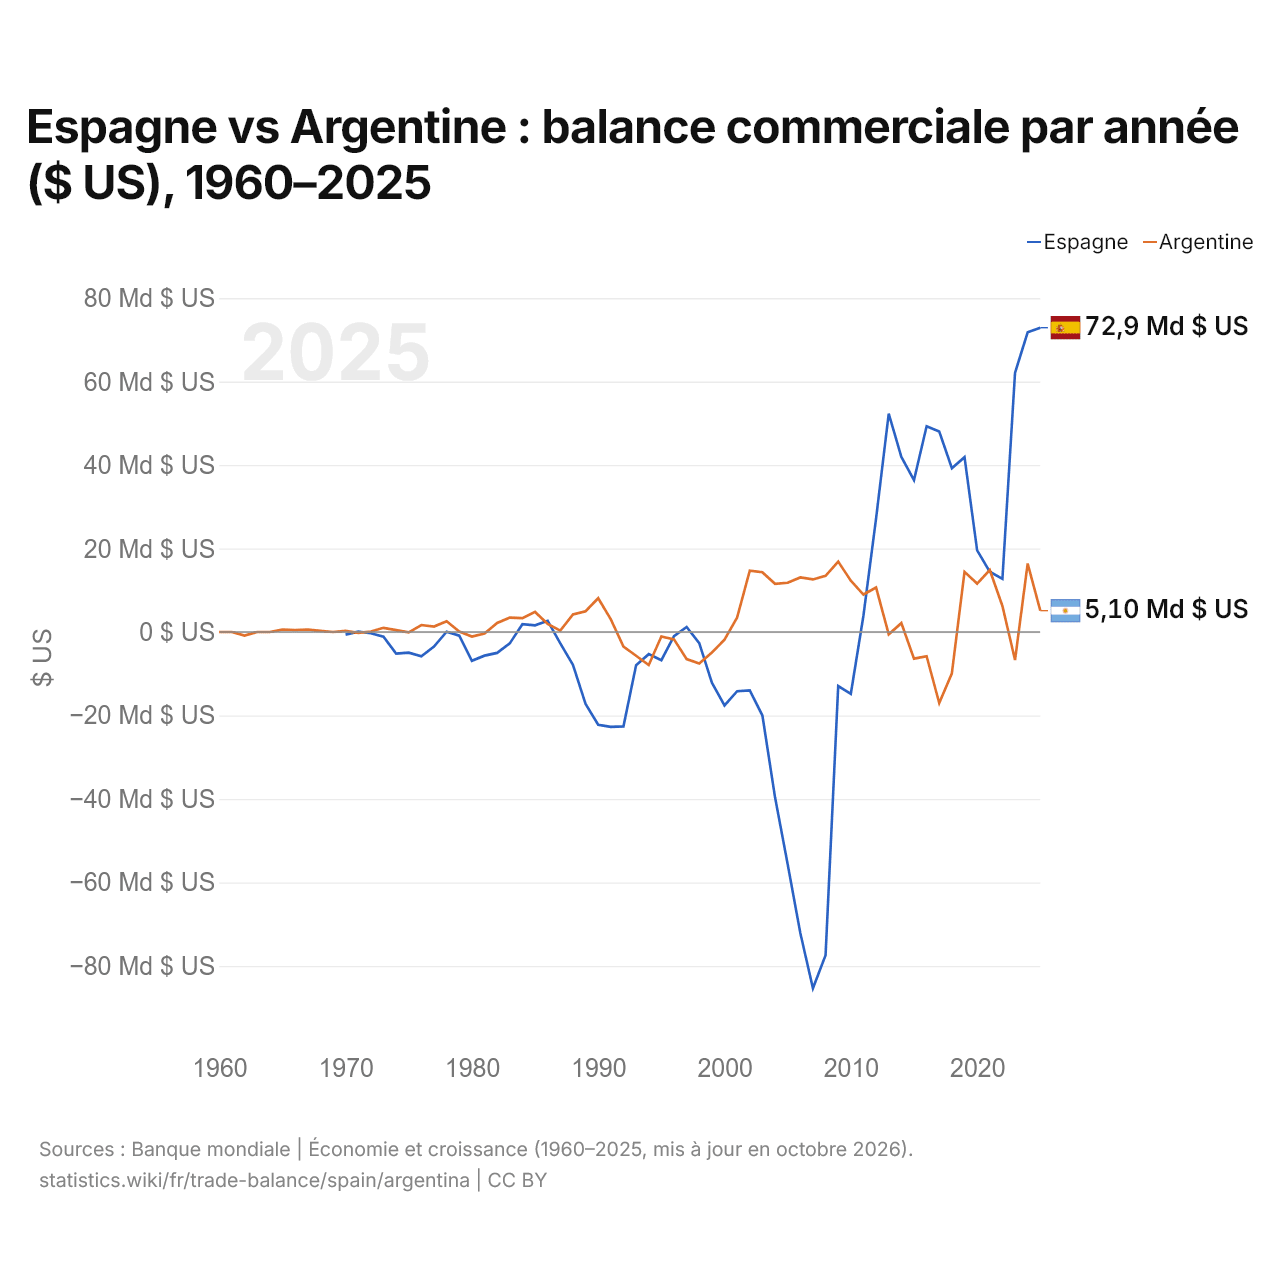
Espagne vs Argentine : balance commerciale par année ($ US), 1960–2025
| Année | $ US | |
|---|---|---|
 Espagne |
 Argentine |
|
| 2025 | 72 905 382 033 $ US | 5 100 613 800 $ US |
| 2024 | 71 813 779 341 $ US | 16 404 309 065 $ US |
| 2023 | 62 117 801 378 $ US | −6 704 568 723 $ US |
| 2022 | 12 715 562 305 $ US | 6 233 148 859 $ US |
| 2021 | 14 460 183 031 $ US | 14 863 213 107 $ US |
| 2020 | 19 552 112 993 $ US | 11 599 718 810 $ US |
| 2019 | 41 892 975 106 $ US | 14 413 857 778 $ US |
| 2018 | 39 230 127 861 $ US | −9 914 710 860 $ US |
| 2017 | 48 023 876 493 $ US | −17 049 937 664 $ US |
| 2016 | 49 290 395 615 $ US | −5 796 649 660 $ US |
| 2015 | 36 369 832 555 $ US | −6 393 090 843 $ US |
| 2014 | 41 951 397 767 $ US | 2 127 192 191 $ US |
| 2013 | 52 337 147 571 $ US | −549 718 918 $ US |
| 2012 | 27 224 671 957 $ US | 10 642 160 447 $ US |
| 2011 | 3 942 017 276 $ US | 8 971 671 281 $ US |
| 2010 | −14 818 860 900 $ US | 12 270 934 023 $ US |
| 2009 | −12 958 923 482 $ US | 16 864 736 859 $ US |
| 2008 | −77 429 392 408 $ US | 13 446 803 975 $ US |
| 2007 | −85 367 077 063 $ US | 12 594 785 133 $ US |
| 2006 | −72 139 174 807 $ US | 13 069 507 212 $ US |
| 2005 | −55 631 984 710 $ US | 11 805 942 344 $ US |
| 2004 | −39 615 800 979 $ US | 11 530 324 282 $ US |
| 2003 | −20 017 014 300 $ US | 14 311 606 659 $ US |
| 2002 | −13 991 654 416 $ US | 14 670 786 469 $ US |
| 2001 | −14 189 458 605 $ US | 3 508 536 600 $ US |
| 2000 | −17 606 826 022 $ US | −1 846 455 600 $ US |
| 1999 | −12 163 706 600 $ US | −4 900 400 000 $ US |
| 1998 | −2 663 993 763 $ US | −7 530 100 000 $ US |
| 1997 | 1 209 090 909 $ US | −6 485 300 000 $ US |
| 1996 | −973 335 085 $ US | −1 767 000 000 $ US |
| 1995 | −6 745 396 317 $ US | −1 059 485 000 $ US |
| 1994 | −5 306 615 327 $ US | −7 914 860 000 $ US |
| 1993 | −7 943 935 155 $ US | −5 692 332 332 $ US |
| 1992 | −22 619 393 792 $ US | −3 510 854 173 $ US |
| 1991 | −22 740 254 604 $ US | 3 029 889 879 $ US |
| 1990 | −22 235 288 932 $ US | 8 096 982 795 $ US |
| 1989 | −17 259 685 172 $ US | 4 964 855 541 $ US |
| 1988 | −7 858 501 643 $ US | 4 212 460 577 $ US |
| 1987 | −2 712 726 048 $ US | 323 648 995 $ US |
| 1986 | 2 681 646 667 $ US | 1 945 851 942 $ US |
| 1985 | 1 600 854 207 $ US | 4 815 481 324 $ US |
| 1984 | 1 872 076 175 $ US | 3 312 681 836 $ US |
| 1983 | −2 730 429 234 $ US | 3 447 293 430 $ US |
| 1982 | −5 009 245 797 $ US | 2 166 280 922 $ US |
| 1981 | −5 669 717 066 $ US | −354 736 981 $ US |
| 1980 | −6 898 052 913 $ US | −1 094 188 525 $ US |
| 1979 | −885 949 430 $ US | 125 448 026 $ US |
| 1978 | 78 546 007 $ US | 2 576 185 988 $ US |
| 1977 | −3 503 969 332 $ US | 1 300 000 008 $ US |
| 1976 | −5 842 516 787 $ US | 1 665 000 247 $ US |
| 1975 | −4 959 394 203 $ US | −81 081 003 $ US |
| 1974 | −5 167 078 166 $ US | 444 444 350 $ US |
| 1973 | −1 140 005 711 $ US | 1 000 000 034 $ US |
| 1972 | −288 646 130 $ US | 125 000 068 $ US |
| 1971 | 68 340 120 $ US | −199 999 955 $ US |
| 1970 | −634 228 667 $ US | 273 421 120 $ US |
| 1969 | - | 0 $ US |
| 1968 | - | 285 714 230 $ US |
| 1967 | - | 606 060 620 $ US |
| 1966 | - | 476 190 459 $ US |
| 1965 | - | 588 235 264 $ US |
| 1964 | - | 392 $ US |
| 1963 | - | 396 $ US |
| 1962 | - | −860 375 152 $ US |
| 1961 | - | 338 $ US |
| 1960 | - | 338 $ US |
En 2025, la balance commerciale de l'Espagne affichait un excédent de 72,9 milliards de dollars et celle de l'Argentine un excédent de 5,1 milliards de dollars ; l'excédent de l'Espagne était 14 fois plus grand. En 1970, la balance commerciale de l'Espagne affichait un déficit de 634 millions de dollars et celle de l'Argentine un excédent de 273 millions de dollars.
De 1970 à 2025, la balance commerciale de l'Espagne a été excédentaire pendant 21 des 56 années, et celle de l'Argentine pendant 37. Les balances commerciales de l'Espagne et de l'Argentine ont été déficitaires en même temps pendant 11 de ces années, la dernière fois en 2000.
Espagne vs Argentine : chiffres de la balance commerciale
|
Espagne
|
Argentine
|
|
|---|---|---|
| Biens et services, $ US | +72,9 Md $US (2025) | +5,10 Md $US (2025) |
| % du PIB | +3,8 % (2025) | +0,7 % (2025) |
| Années d'excédent depuis 2000 | 15 sur 26 | 19 sur 26 |
| Solde des biens entre les deux, chiffres propres | −240 M $US (2025) | +105 M $US (2025) |
| Premier excédent en biens avec | Portugal (+20,1 Md $US, 2025) | Chili (+5,47 Md $US, 2025) |
| Premier déficit en biens avec | Chine (−47,1 Md $US, 2025) | Chine (−6,88 Md $US, 2025) |
Comparer la balance commerciale de 2 pays au choix
Sources :
- Banque mondiale | Économie et croissance (1960–2025, mis à jour en octobre 2026)
- TradeMap (2001–2025, mis à jour en octobre 2026)
Creative Commons Attribution (CC BY) : vous pouvez copier, partager, adapter et réutiliser ce contenu, y compris à des fins commerciales, à condition de citer statistics.wiki et d’indiquer les modifications apportées. Les sources citées ci-dessus peuvent avoir leurs propres conditions de licence.