
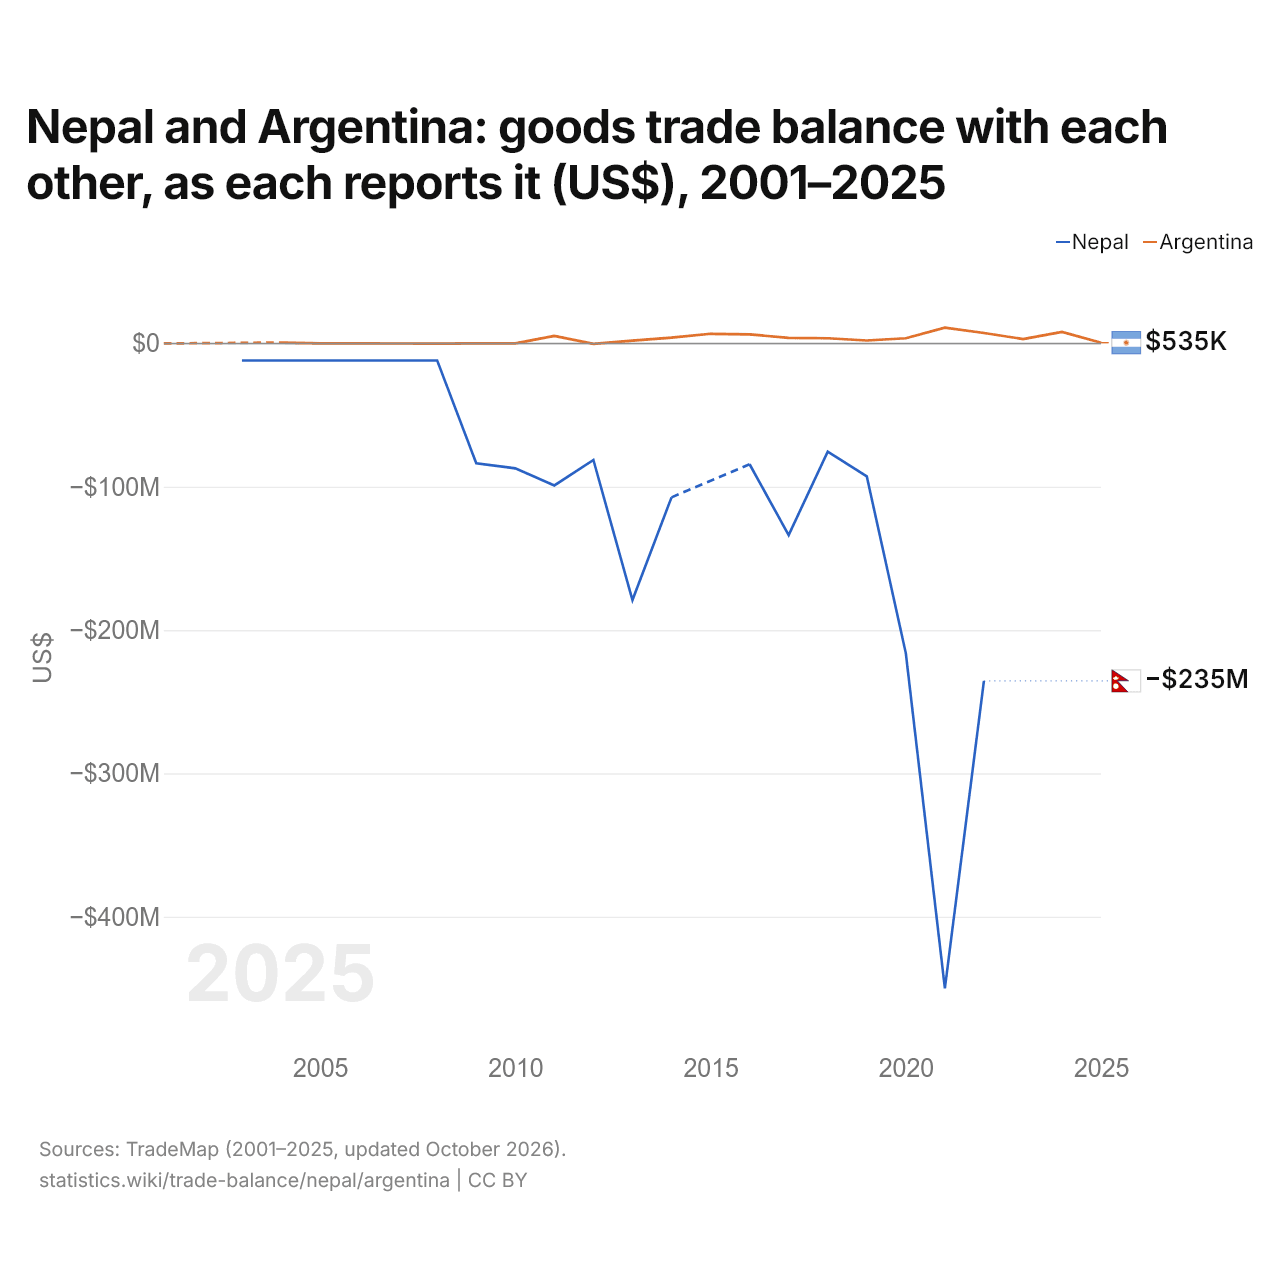
Le Népal et l'Argentine : solde de leur commerce de biens bilatéral, selon chacun ($ US), 2001–2025
| Année | $ US | |
|---|---|---|
| Népal | Argentine | |
| 2025 | - | 535 000 $ US |
| 2024 | - | 8 133 000 $ US |
| 2023 | - | 3 118 000 $ US |
| 2022 | −235 470 000 $ US | 7 354 000 $ US |
| 2021 | −450 013 000 $ US | 11 029 000 $ US |
| 2020 | −216 183 000 $ US | 3 634 000 $ US |
| 2019 | −92 705 000 $ US | 2 112 000 $ US |
| 2018 | −75 445 000 $ US | 3 662 000 $ US |
| 2017 | −133 699 000 $ US | 3 918 000 $ US |
| 2016 | −84 290 000 $ US | 6 348 000 $ US |
| 2015 | - | 6 775 000 $ US |
| 2014 | −107 389 000 $ US | 4 070 000 $ US |
| 2013 | −179 037 000 $ US | 2 000 000 $ US |
| 2012 | −81 303 000 $ US | −254 000 $ US |
| 2011 | −99 090 000 $ US | 5 250 000 $ US |
| 2010 | −87 109 000 $ US | 84 000 $ US |
| 2009 | −83 623 000 $ US | 43 000 $ US |
| 2008 | −11 869 000 $ US | −32 000 $ US |
| 2007 | −11 869 000 $ US | 11 000 $ US |
| 2006 | −11 869 000 $ US | 36 000 $ US |
| 2005 | −11 869 000 $ US | 114 000 $ US |
| 2004 | −11 869 000 $ US | 663 000 $ US |
| 2003 | −11 869 000 $ US | - |
| 2002 | - | - |
| 2001 | - | 30 000 $ US |
Selon le Népal, son commerce de biens avec l'Argentine affichait un déficit de 235 millions de dollars ; selon l'Argentine, son commerce de biens avec le Népal affichait un excédent de 7,35 millions de dollars. En 2004, les chiffres étaient un déficit de 11,9 millions de dollars pour le Népal et un excédent de 663 000 dollars pour l'Argentine.
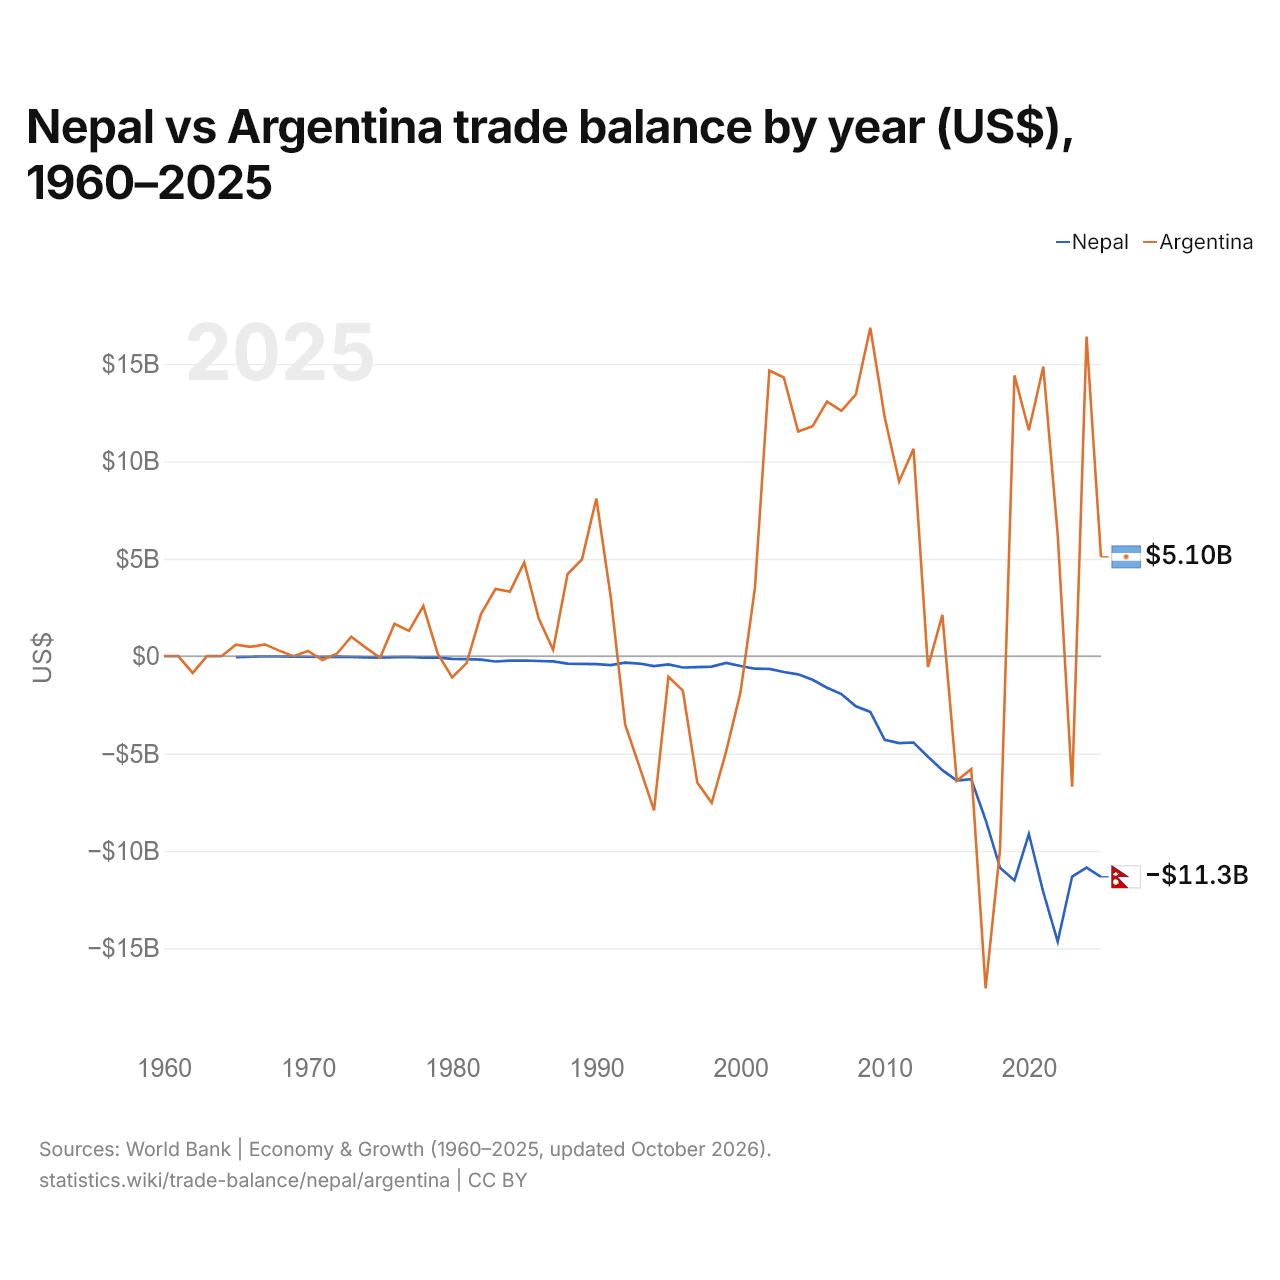
Népal vs Argentine : balance commerciale par année ($ US), 1960–2025
| Année | $ US | |
|---|---|---|
 Népal |
 Argentine |
|
| 2025 | −11 325 496 917 $ US | 5 100 613 800 $ US |
| 2024 | −10 851 375 469 $ US | 16 404 309 065 $ US |
| 2023 | −11 312 462 877 $ US | −6 704 568 723 $ US |
| 2022 | −14 648 203 159 $ US | 6 233 148 859 $ US |
| 2021 | −12 117 057 230 $ US | 14 863 213 107 $ US |
| 2020 | −9 130 156 432 $ US | 11 599 718 810 $ US |
| 2019 | −11 517 205 870 $ US | 14 413 857 778 $ US |
| 2018 | −10 865 912 856 $ US | −9 914 710 860 $ US |
| 2017 | −8 406 985 329 $ US | −17 049 937 664 $ US |
| 2016 | −6 316 510 579 $ US | −5 796 649 660 $ US |
| 2015 | −6 391 434 590 $ US | −6 393 090 843 $ US |
| 2014 | −5 849 879 970 $ US | 2 127 192 191 $ US |
| 2013 | −5 158 487 757 $ US | −549 718 918 $ US |
| 2012 | −4 432 060 436 $ US | 10 642 160 447 $ US |
| 2011 | −4 462 444 951 $ US | 8 971 671 281 $ US |
| 2010 | −4 291 885 800 $ US | 12 270 934 023 $ US |
| 2009 | −2 859 043 816 $ US | 16 864 736 859 $ US |
| 2008 | −2 569 878 630 $ US | 13 446 803 975 $ US |
| 2007 | −1 948 231 956 $ US | 12 594 785 133 $ US |
| 2006 | −1 616 003 938 $ US | 13 069 507 212 $ US |
| 2005 | −1 211 048 644 $ US | 11 805 942 344 $ US |
| 2004 | −929 747 245 $ US | 11 530 324 282 $ US |
| 2003 | −813 348 972 $ US | 14 311 606 659 $ US |
| 2002 | −650 860 003 $ US | 14 670 786 469 $ US |
| 2001 | −641 455 782 $ US | 3 508 536 600 $ US |
| 2000 | −502 316 491 $ US | −1 846 455 600 $ US |
| 1999 | −345 813 098 $ US | −4 900 400 000 $ US |
| 1998 | −537 368 846 $ US | −7 530 100 000 $ US |
| 1997 | −559 740 487 $ US | −6 485 300 000 $ US |
| 1996 | −579 784 999 $ US | −1 767 000 000 $ US |
| 1995 | −420 050 227 $ US | −1 059 485 000 $ US |
| 1994 | −506 077 551 $ US | −7 914 860 000 $ US |
| 1993 | −377 850 000 $ US | −5 692 332 332 $ US |
| 1992 | −332 501 114 $ US | −3 510 854 173 $ US |
| 1991 | −458 559 867 $ US | 3 029 889 879 $ US |
| 1990 | −403 897 488 $ US | 8 096 982 795 $ US |
| 1989 | −395 379 411 $ US | 4 964 855 541 $ US |
| 1988 | −381 294 038 $ US | 4 212 460 577 $ US |
| 1987 | −268 913 256 $ US | 323 648 995 $ US |
| 1986 | −246 320 174 $ US | 1 945 851 942 $ US |
| 1985 | −221 916 059 $ US | 4 815 481 324 $ US |
| 1984 | −227 059 769 $ US | 3 312 681 836 $ US |
| 1983 | −271 247 885 $ US | 3 447 293 430 $ US |
| 1982 | −172 846 486 $ US | 2 166 280 922 $ US |
| 1981 | −152 833 342 $ US | −354 736 981 $ US |
| 1980 | −139 916 667 $ US | −1 094 188 525 $ US |
| 1979 | −77 416 683 $ US | 125 448 026 $ US |
| 1978 | −78 614 682 $ US | 2 576 185 988 $ US |
| 1977 | −34 960 000 $ US | 1 300 000 008 $ US |
| 1976 | −49 445 265 $ US | 1 665 000 247 $ US |
| 1975 | −70 368 962 $ US | −81 081 003 $ US |
| 1974 | −62 095 863 $ US | 444 444 350 $ US |
| 1973 | −36 567 171 $ US | 1 000 000 034 $ US |
| 1972 | −23 111 102 $ US | 125 000 068 $ US |
| 1971 | −32 888 889 $ US | −199 999 955 $ US |
| 1970 | −29 432 099 $ US | 273 421 120 $ US |
| 1969 | −25 283 951 $ US | 0 $ US |
| 1968 | −5 059 929 $ US | 285 714 230 $ US |
| 1967 | −656 254 $ US | 606 060 620 $ US |
| 1966 | −28 218 926 $ US | 476 190 459 $ US |
| 1965 | −45 281 533 $ US | 588 235 264 $ US |
| 1964 | - | 392 $ US |
| 1963 | - | 396 $ US |
| 1962 | - | −860 375 152 $ US |
| 1961 | - | 338 $ US |
| 1960 | - | 338 $ US |
En 2025, la balance commerciale du Népal affichait un déficit de 11,3 milliards de dollars et celle de l'Argentine un excédent de 5,1 milliards de dollars. En 1965, la balance commerciale du Népal affichait un déficit de 45,3 millions de dollars et celle de l'Argentine un excédent de 588 millions de dollars.
Sur les années de 1965 à 2025 que les deux pays ont communiquées, la balance commerciale du Népal a été excédentaire pendant aucune des 60 années, et celle de l'Argentine pendant 41. Les balances commerciales du Népal et de l'Argentine ont été déficitaires en même temps pendant 19 de ces années, la dernière fois en 2023.
Népal vs Argentine : chiffres de la balance commerciale
|
Népal
|
Argentine
|
|
|---|---|---|
| Biens et services, $ US | −11,3 Md $US (2025) | +5,10 Md $US (2025) |
| % du PIB | −24,9 % (2025) | +0,7 % (2025) |
| Années d'excédent depuis 2000 | 0 sur 26 | 19 sur 26 |
| Solde des biens entre les deux, chiffres propres | −235 M $US (2022) | +535 k $US (2025) |
| Premier excédent en biens avec | Danemark (+3,63 M $US, 2022) | Chili (+5,47 Md $US, 2025) |
| Premier déficit en biens avec | Inde (−7,73 Md $US, 2022) | Chine (−6,88 Md $US, 2025) |
Comparer la balance commerciale de 2 pays au choix
Sources :
- Banque mondiale | Économie et croissance (1960–2025, mis à jour en octobre 2026)
- TradeMap (2001–2025, mis à jour en octobre 2026)
Creative Commons Attribution (CC BY) : vous pouvez copier, partager, adapter et réutiliser ce contenu, y compris à des fins commerciales, à condition de citer statistics.wiki et d’indiquer les modifications apportées. Les sources citées ci-dessus peuvent avoir leurs propres conditions de licence.