
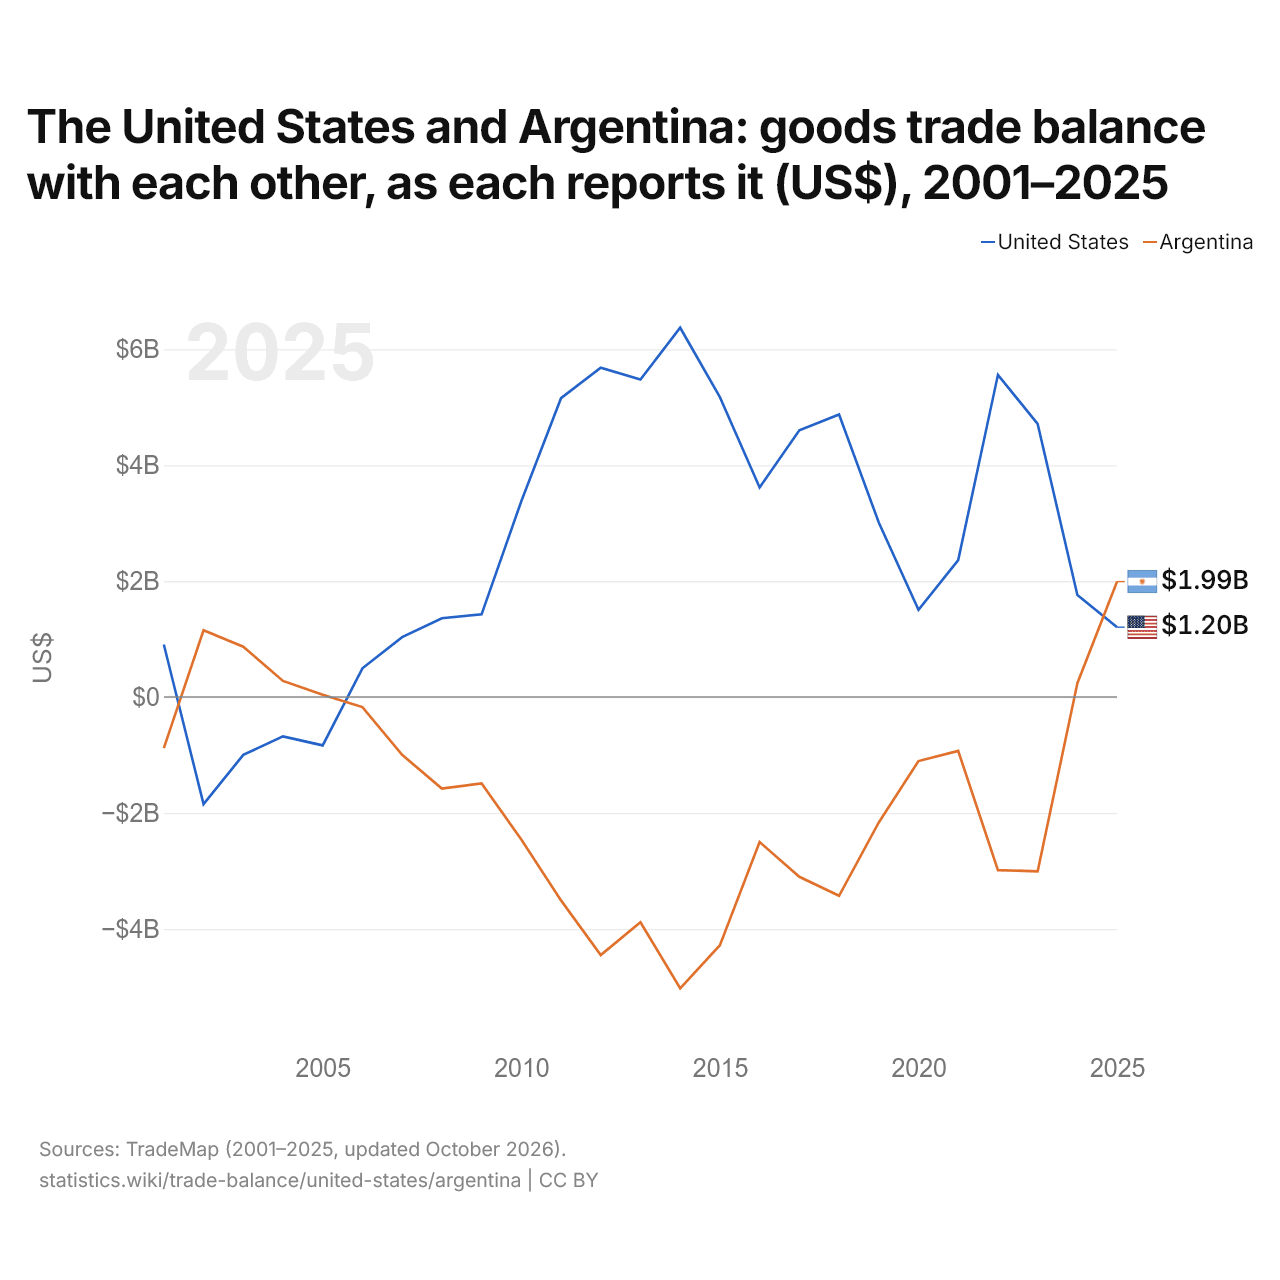
Les États-Unis et l'Argentine : solde de leur commerce de biens bilatéral, selon chacun ($ US), 2001–2025
| Année | $ US | |
|---|---|---|
| États-Unis | Argentine | |
| 2025 | 1 204 820 000 $ US | 1 991 936 000 $ US |
| 2024 | 1 760 246 000 $ US | 238 597 000 $ US |
| 2023 | 4 711 672 000 $ US | −3 008 450 000 $ US |
| 2022 | 5 558 851 000 $ US | −2 985 520 000 $ US |
| 2021 | 2 362 783 000 $ US | −930 290 000 $ US |
| 2020 | 1 503 870 000 $ US | −1 104 542 000 $ US |
| 2019 | 3 011 373 000 $ US | −2 164 104 000 $ US |
| 2018 | 4 874 952 000 $ US | −3 429 663 000 $ US |
| 2017 | 4 602 232 000 $ US | −3 100 534 000 $ US |
| 2016 | 3 615 579 000 $ US | −2 502 033 000 $ US |
| 2015 | 5 174 634 000 $ US | −4 283 107 000 $ US |
| 2014 | 6 372 077 000 $ US | −5 025 177 000 $ US |
| 2013 | 5 477 978 000 $ US | −3 886 956 000 $ US |
| 2012 | 5 682 484 000 $ US | −4 452 987 000 $ US |
| 2011 | 5 156 610 000 $ US | −3 509 033 000 $ US |
| 2010 | 3 378 841 000 $ US | −2 456 572 000 $ US |
| 2009 | 1 426 275 000 $ US | −1 489 275 000 $ US |
| 2008 | 1 360 165 000 $ US | −1 578 120 000 $ US |
| 2007 | 1 034 459 000 $ US | −997 897 000 $ US |
| 2006 | 495 891 000 $ US | −173 018 000 $ US |
| 2005 | −834 722 000 $ US | 38 195 000 $ US |
| 2004 | −679 192 000 $ US | 277 954 000 $ US |
| 2003 | −998 250 000 $ US | 869 520 000 $ US |
| 2002 | −1 848 708 000 $ US | 1 152 853 000 $ US |
| 2001 | 906 740 000 $ US | −881 077 000 $ US |
En 2025, selon les États-Unis, leur commerce de biens avec l'Argentine affichait un excédent de 1,2 milliard de dollars ; selon l'Argentine, son commerce de biens avec les États-Unis affichait un excédent de 1,99 milliard de dollars. En 2001, les chiffres étaient un excédent de 907 millions de dollars pour les États-Unis et un déficit de 881 millions de dollars pour l'Argentine.
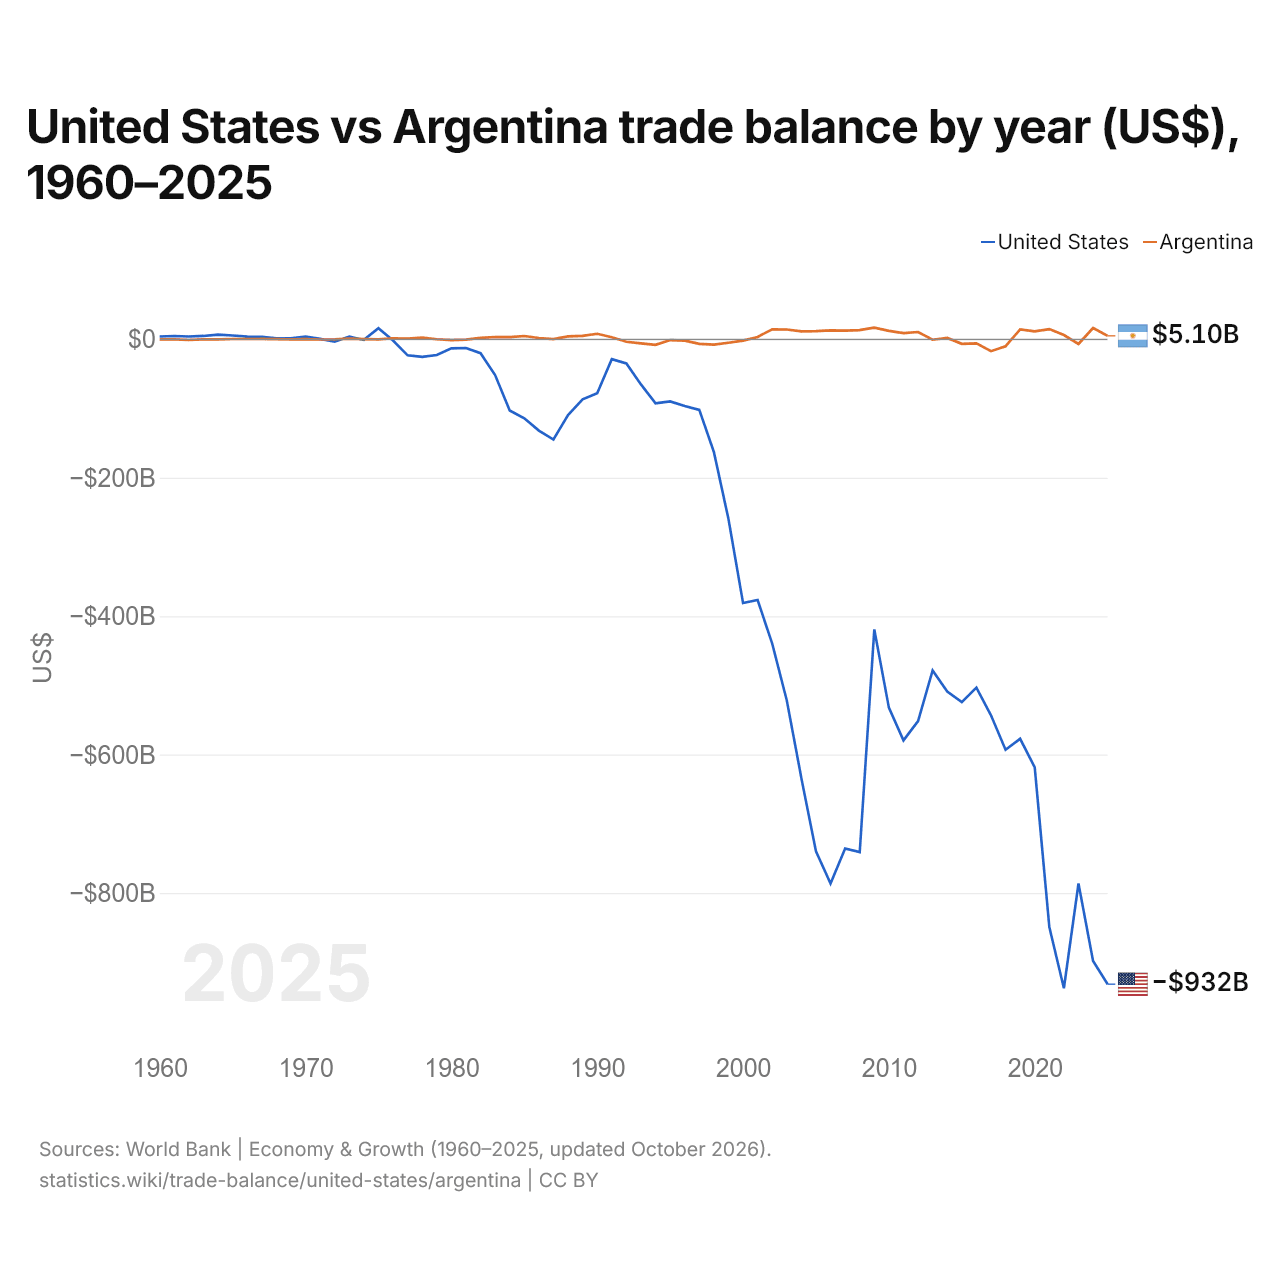
États-Unis vs Argentine : balance commerciale par année ($ US), 1960–2025
| Année | $ US | |
|---|---|---|
 États-Unis |
 Argentine |
|
| 2025 | −931 962 000 000 $ US | 5 100 613 800 $ US |
| 2024 | −898 460 000 000 $ US | 16 404 309 065 $ US |
| 2023 | −786 496 000 000 $ US | −6 704 568 723 $ US |
| 2022 | −937 889 000 000 $ US | 6 233 148 859 $ US |
| 2021 | −849 233 000 000 $ US | 14 863 213 107 $ US |
| 2020 | −618 554 000 000 $ US | 11 599 718 810 $ US |
| 2019 | −577 290 000 000 $ US | 14 413 857 778 $ US |
| 2018 | −593 077 000 000 $ US | −9 914 710 860 $ US |
| 2017 | −543 329 000 000 $ US | −17 049 937 664 $ US |
| 2016 | −503 272 000 000 $ US | −5 796 649 660 $ US |
| 2015 | −524 320 000 000 $ US | −6 393 090 843 $ US |
| 2014 | −508 900 000 000 $ US | 2 127 192 191 $ US |
| 2013 | −478 453 000 000 $ US | −549 718 918 $ US |
| 2012 | −551 617 000 000 $ US | 10 642 160 447 $ US |
| 2011 | −579 616 000 000 $ US | 8 971 671 281 $ US |
| 2010 | −532 308 000 000 $ US | 12 270 934 023 $ US |
| 2009 | −419 153 000 000 $ US | 16 864 736 859 $ US |
| 2008 | −740 871 000 000 $ US | 13 446 803 975 $ US |
| 2007 | −735 933 000 000 $ US | 12 594 785 133 $ US |
| 2006 | −786 453 000 000 $ US | 13 069 507 212 $ US |
| 2005 | −739 902 000 000 $ US | 11 805 942 344 $ US |
| 2004 | −634 141 000 000 $ US | 11 530 324 282 $ US |
| 2003 | −521 955 000 000 $ US | 14 311 606 659 $ US |
| 2002 | −439 745 000 000 $ US | 14 670 786 469 $ US |
| 2001 | −376 747 000 000 $ US | 3 508 536 600 $ US |
| 2000 | −381 073 000 000 $ US | −1 846 455 600 $ US |
| 1999 | −259 550 000 000 $ US | −4 900 400 000 $ US |
| 1998 | −162 711 000 000 $ US | −7 530 100 000 $ US |
| 1997 | −101 971 000 000 $ US | −6 485 300 000 $ US |
| 1996 | −96 377 000 000 $ US | −1 767 000 000 $ US |
| 1995 | −89 762 000 000 $ US | −1 059 485 000 $ US |
| 1994 | −92 487 000 000 $ US | −7 914 860 000 $ US |
| 1993 | −65 174 000 000 $ US | −5 692 332 332 $ US |
| 1992 | −34 738 000 000 $ US | −3 510 854 173 $ US |
| 1991 | −28 613 000 000 $ US | 3 029 889 879 $ US |
| 1990 | −77 855 000 000 $ US | 8 096 982 795 $ US |
| 1989 | −86 741 000 000 $ US | 4 964 855 541 $ US |
| 1988 | −109 392 000 000 $ US | 4 212 460 577 $ US |
| 1987 | −144 770 000 000 $ US | 323 648 995 $ US |
| 1986 | −131 869 000 000 $ US | 1 945 851 942 $ US |
| 1985 | −114 018 000 000 $ US | 4 815 481 324 $ US |
| 1984 | −102 727 000 000 $ US | 3 312 681 836 $ US |
| 1983 | −51 642 000 000 $ US | 3 447 293 430 $ US |
| 1982 | −19 974 000 000 $ US | 2 166 280 922 $ US |
| 1981 | −12 519 000 000 $ US | −354 736 981 $ US |
| 1980 | −13 056 000 000 $ US | −1 094 188 525 $ US |
| 1979 | −22 545 000 000 $ US | 125 448 026 $ US |
| 1978 | −25 367 000 000 $ US | 2 576 185 988 $ US |
| 1977 | −23 094 000 000 $ US | 1 300 000 008 $ US |
| 1976 | −1 631 000 000 $ US | 1 665 000 247 $ US |
| 1975 | 15 976 000 000 $ US | −81 081 003 $ US |
| 1974 | −815 000 000 $ US | 444 444 350 $ US |
| 1973 | 4 110 000 000 $ US | 1 000 000 034 $ US |
| 1972 | −3 373 000 000 $ US | 125 000 068 $ US |
| 1971 | 621 000 000 $ US | −199 999 955 $ US |
| 1970 | 3 949 000 000 $ US | 273 421 120 $ US |
| 1969 | 1 429 548 641 $ US | 0 $ US |
| 1968 | 1 347 972 646 $ US | 285 714 230 $ US |
| 1967 | 3 550 386 094 $ US | 606 060 620 $ US |
| 1966 | 3 858 020 910 $ US | 476 190 459 $ US |
| 1965 | 5 604 920 537 $ US | 588 235 264 $ US |
| 1964 | 6 900 003 028 $ US | 392 $ US |
| 1963 | 4 928 769 439 $ US | 396 $ US |
| 1962 | 4 093 606 558 $ US | −860 375 152 $ US |
| 1961 | 4 907 882 243 $ US | 338 $ US |
| 1960 | 4 200 885 010 $ US | 338 $ US |
En 2025, la balance commerciale des États-Unis affichait un déficit de 932 milliards de dollars et celle de l'Argentine un excédent de 5,1 milliards de dollars. En 1960, la balance commerciale des États-Unis affichait un excédent de 4,2 milliards de dollars et celle de l'Argentine un excédent de 338 dollars.
Sur les années de 1960 à 2025 que les deux pays ont communiquées, la balance commerciale des États-Unis a été excédentaire pendant 13 des 65 années, et celle de l'Argentine pendant 45. Les balances commerciales des États-Unis et de l'Argentine ont été déficitaires en même temps pendant 17 de ces années, la dernière fois en 2023.
États-Unis vs Argentine : chiffres de la balance commerciale
|
États-Unis
|
Argentine
|
|
|---|---|---|
| Biens et services, $ US | −932 Md $US (2025) | +5,10 Md $US (2025) |
| % du PIB | −3,0 % (2025) | +0,7 % (2025) |
| Années d'excédent depuis 2000 | 0 sur 26 | 19 sur 26 |
| Solde des biens entre les deux, chiffres propres | +1,20 Md $US (2025) | +1,99 Md $US (2025) |
| Premier excédent en biens avec | Pays-Bas (+59,9 Md $US, 2025) | Chili (+5,47 Md $US, 2025) |
| Premier déficit en biens avec | Chine (−221 Md $US, 2025) | Chine (−6,88 Md $US, 2025) |
Comparer la balance commerciale de 2 pays au choix
Sources :
- Banque mondiale | Économie et croissance (1960–2025, mis à jour en octobre 2026)
- TradeMap (2001–2025, mis à jour en octobre 2026)
Creative Commons Attribution (CC BY) : vous pouvez copier, partager, adapter et réutiliser ce contenu, y compris à des fins commerciales, à condition de citer statistics.wiki et d’indiquer les modifications apportées. Les sources citées ci-dessus peuvent avoir leurs propres conditions de licence.