
La France et l'Argentine : solde de leur commerce de biens bilatéral, selon chacun ($ US), 2001–2025
| Année | $ US | |
|---|---|---|
| France | Argentine | |
| 2025 | 373 323 000 $ US | −685 781 000 $ US |
| 2024 | 386 431 000 $ US | −593 117 000 $ US |
| 2023 | 522 647 000 $ US | −755 018 000 $ US |
| 2022 | 233 131 000 $ US | −556 722 000 $ US |
| 2021 | 322 448 000 $ US | −563 938 000 $ US |
| 2020 | 227 572 000 $ US | −415 420 000 $ US |
| 2019 | 261 958 000 $ US | −528 113 000 $ US |
| 2018 | 473 352 000 $ US | −696 414 000 $ US |
| 2017 | 661 103 000 $ US | −1 036 603 000 $ US |
| 2016 | 765 267 000 $ US | −1 083 300 000 $ US |
| 2015 | 946 652 000 $ US | −1 086 858 000 $ US |
| 2014 | 684 899 000 $ US | −1 103 125 000 $ US |
| 2013 | 1 027 067 000 $ US | −1 308 561 000 $ US |
| 2012 | 785 135 000 $ US | −1 177 334 000 $ US |
| 2011 | 794 412 000 $ US | −945 092 000 $ US |
| 2010 | 629 918 000 $ US | −1 002 145 000 $ US |
| 2009 | 241 441 000 $ US | −364 879 000 $ US |
| 2008 | 108 488 000 $ US | −568 812 000 $ US |
| 2007 | 502 993 000 $ US | −456 558 000 $ US |
| 2006 | 229 196 000 $ US | −355 708 000 $ US |
| 2005 | 172 034 000 $ US | −327 175 000 $ US |
| 2004 | 156 095 000 $ US | −290 206 000 $ US |
| 2003 | −136 286 000 $ US | 10 043 000 $ US |
| 2002 | −131 452 000 $ US | 50 796 000 $ US |
| 2001 | 281 623 000 $ US | −479 218 000 $ US |
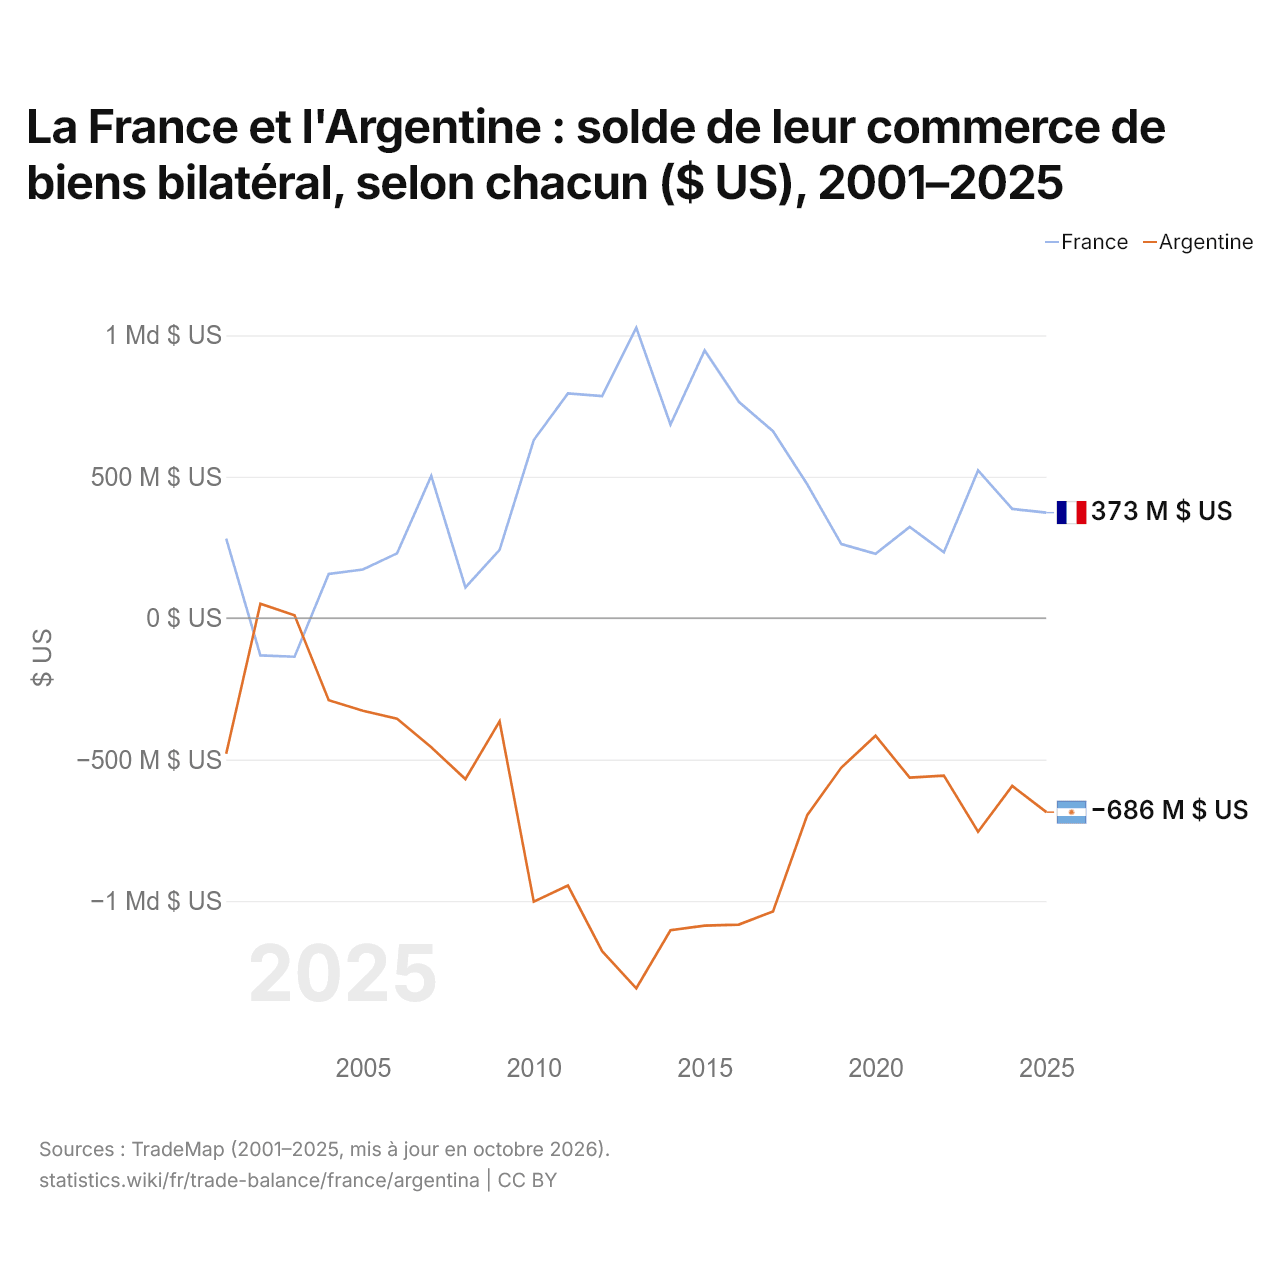
En 2025, selon la France, son commerce de biens avec l'Argentine affichait un excédent de 373 millions de dollars ; selon l'Argentine, son commerce de biens avec la France affichait un déficit de 686 millions de dollars. En 2001, les chiffres étaient un excédent de 282 millions de dollars pour la France et un déficit de 479 millions de dollars pour l'Argentine.
France vs Argentine : balance commerciale par année ($ US), 1960–2025
| Année | $ US | |
|---|---|---|
 France |
 Argentine |
|
| 2025 | −13 691 892 676 $ US | 5 100 613 800 $ US |
| 2024 | −10 387 713 597 $ US | 16 404 309 065 $ US |
| 2023 | −52 372 867 874 $ US | −6 704 568 723 $ US |
| 2022 | −76 323 175 109 $ US | 6 233 148 859 $ US |
| 2021 | −35 964 530 801 $ US | 14 863 213 107 $ US |
| 2020 | −45 662 030 726 $ US | 11 599 718 810 $ US |
| 2019 | −17 694 749 944 $ US | 14 413 857 778 $ US |
| 2018 | −26 878 288 452 $ US | −9 914 710 860 $ US |
| 2017 | −19 990 725 131 $ US | −17 049 937 664 $ US |
| 2016 | −8 555 918 301 $ US | −5 796 649 660 $ US |
| 2015 | −2 874 747 900 $ US | −6 393 090 843 $ US |
| 2014 | −20 476 182 589 $ US | 2 127 192 191 $ US |
| 2013 | −17 928 929 470 $ US | −549 718 918 $ US |
| 2012 | −25 424 169 112 $ US | 10 642 160 447 $ US |
| 2011 | −43 858 143 696 $ US | 8 971 671 281 $ US |
| 2010 | −24 731 111 845 $ US | 12 270 934 023 $ US |
| 2009 | −11 805 159 462 $ US | 16 864 736 859 $ US |
| 2008 | −22 878 042 543 $ US | 13 446 803 975 $ US |
| 2007 | −11 565 875 316 $ US | 12 594 785 133 $ US |
| 2006 | −314 778 625 $ US | 13 069 507 212 $ US |
| 2005 | 11 054 488 524 $ US | 11 805 942 344 $ US |
| 2004 | 27 985 189 929 $ US | 11 530 324 282 $ US |
| 2003 | 30 738 831 193 $ US | 14 311 606 659 $ US |
| 2002 | 34 756 831 657 $ US | 14 670 786 469 $ US |
| 2001 | 26 968 658 956 $ US | 3 508 536 600 $ US |
| 2000 | 23 545 285 267 $ US | −1 846 455 600 $ US |
| 1999 | 40 790 461 990 $ US | −4 900 400 000 $ US |
| 1998 | 46 166 110 740 $ US | −7 530 100 000 $ US |
| 1997 | 50 108 338 953 $ US | −6 485 300 000 $ US |
| 1996 | 34 112 706 757 $ US | −1 767 000 000 $ US |
| 1995 | 31 069 260 087 $ US | −1 059 485 000 $ US |
| 1994 | 24 247 400 756 $ US | −7 914 860 000 $ US |
| 1993 | 25 065 323 141 $ US | −5 692 332 332 $ US |
| 1992 | 12 888 475 836 $ US | −3 510 854 173 $ US |
| 1991 | −1 575 747 006 $ US | 3 029 889 879 $ US |
| 1990 | −7 657 631 611 $ US | 8 096 982 795 $ US |
| 1989 | −4 238 741 518 $ US | 4 964 855 541 $ US |
| 1988 | −3 842 638 476 $ US | 4 212 460 577 $ US |
| 1987 | −7 038 415 366 $ US | 323 648 995 $ US |
| 1986 | 2 015 437 068 $ US | 1 945 851 942 $ US |
| 1985 | −286 173 164 $ US | 4 815 481 324 $ US |
| 1984 | 2 161 975 531 $ US | 3 312 681 836 $ US |
| 1983 | −632 756 692 $ US | 3 447 293 430 $ US |
| 1982 | −13 723 325 681 $ US | 2 166 280 922 $ US |
| 1981 | −7 579 843 090 $ US | −354 736 981 $ US |
| 1980 | −8 643 123 254 $ US | −1 094 188 525 $ US |
| 1979 | 4 816 373 728 $ US | 125 448 026 $ US |
| 1978 | 7 241 133 721 $ US | 2 576 185 988 $ US |
| 1977 | 868 280 289 $ US | 1 300 000 008 $ US |
| 1976 | −2 147 364 108 $ US | 1 665 000 247 $ US |
| 1975 | 4 812 605 171 $ US | −81 081 003 $ US |
| 1974 | −2 215 630 115 $ US | 444 444 350 $ US |
| 1973 | 2 527 401 296 $ US | 1 000 000 034 $ US |
| 1972 | 2 245 383 615 $ US | 125 000 068 $ US |
| 1971 | 2 159 464 899 $ US | −199 999 955 $ US |
| 1970 | 1 297 980 394 $ US | 273 421 120 $ US |
| 1969 | −146 618 606 $ US | 0 $ US |
| 1968 | 612 901 162 $ US | 285 714 230 $ US |
| 1967 | 840 231 291 $ US | 606 060 620 $ US |
| 1966 | 1 011 891 447 $ US | 476 190 459 $ US |
| 1965 | 1 521 823 088 $ US | 588 235 264 $ US |
| 1964 | 442 835 372 $ US | 392 $ US |
| 1963 | 841 559 930 $ US | 396 $ US |
| 1962 | 1 154 587 274 $ US | −860 375 152 $ US |
| 1961 | 1 666 644 737 $ US | 338 $ US |
| 1960 | 1 710 489 823 $ US | 338 $ US |
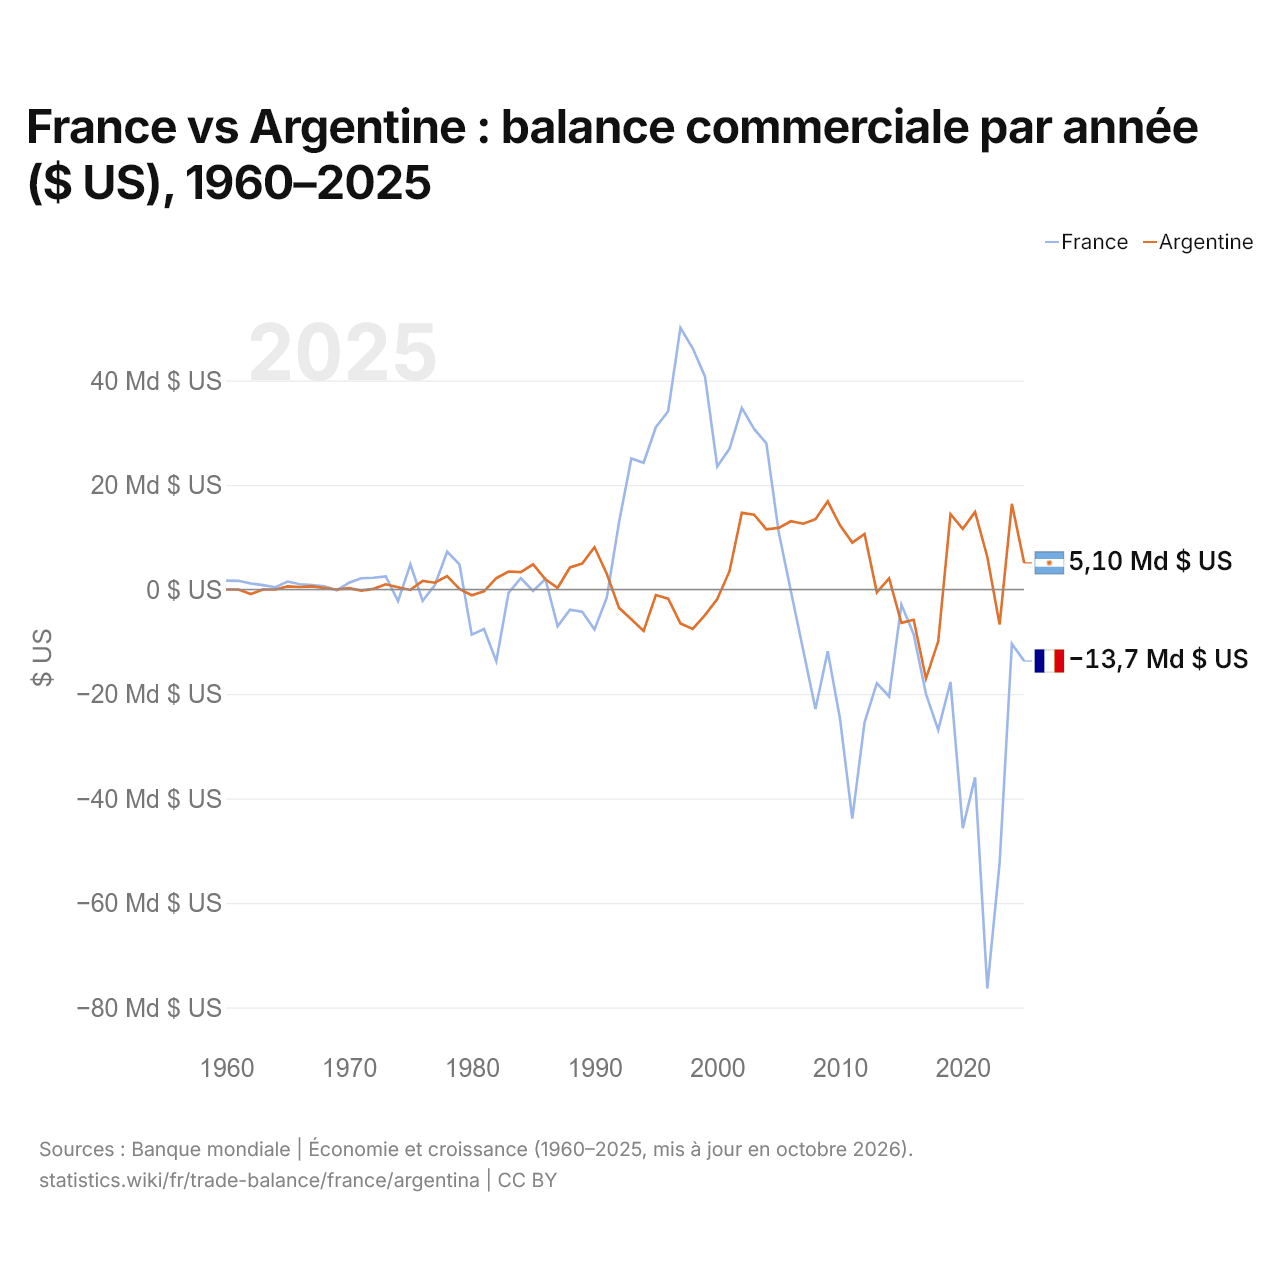
En 2025, la balance commerciale de la France affichait un déficit de 13,7 milliards de dollars et celle de l'Argentine un excédent de 5,1 milliards de dollars. En 1960, la balance commerciale de la France affichait un excédent de 1,71 milliard de dollars et celle de l'Argentine un excédent de 338 dollars.
Sur les années de 1960 à 2025 que les deux pays ont communiquées, la balance commerciale de la France a été excédentaire pendant 33 des 65 années, et celle de l'Argentine pendant 45. Les balances commerciales de la France et de l'Argentine ont été déficitaires en même temps pendant 8 de ces années, la dernière fois en 2023.
France vs Argentine : chiffres de la balance commerciale
|
France
|
Argentine
|
|
|---|---|---|
| Biens et services, $ US | −13,7 Md $US (2025) | +5,10 Md $US (2025) |
| % du PIB | −0,4 % (2025) | +0,7 % (2025) |
| Années d'excédent depuis 2000 | 6 sur 26 | 19 sur 26 |
| Solde des biens entre les deux, chiffres propres | +373 M $US (2025) | −686 M $US (2025) |
| Premier excédent en biens avec | Royaume-Uni (+15,2 Md $US, 2025) | Chili (+5,47 Md $US, 2025) |
| Premier déficit en biens avec | Chine (−56,4 Md $US, 2025) | Chine (−6,88 Md $US, 2025) |
Comparer la balance commerciale de 2 pays au choix
Sources :
- Banque mondiale | Économie et croissance (1960–2025, mis à jour en octobre 2026)
- TradeMap (2001–2025, mis à jour en octobre 2026)
Creative Commons Attribution (CC BY) : vous pouvez copier, partager, adapter et réutiliser ce contenu, y compris à des fins commerciales, à condition de citer statistics.wiki et d’indiquer les modifications apportées. Les sources citées ci-dessus peuvent avoir leurs propres conditions de licence.