
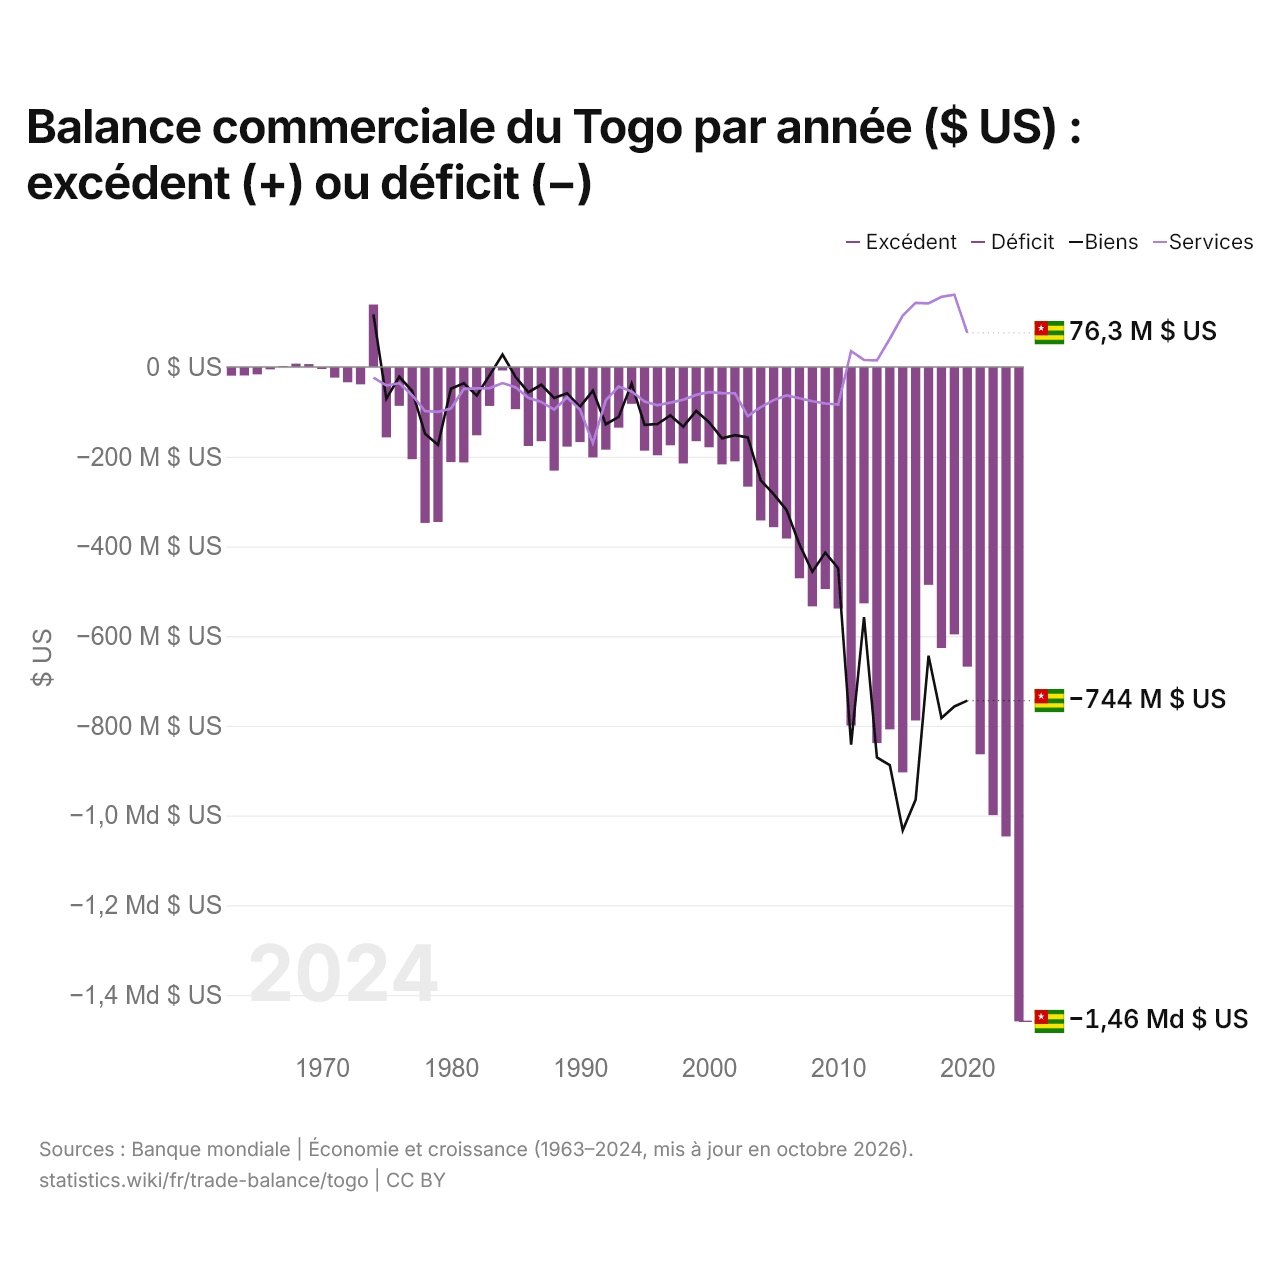
Balance commerciale du Togo par année ($ US) : excédent (+) ou déficit (−)
| Année | $ US | ||
|---|---|---|---|
| Biens et services | Biens | Services | |
| 2024 | −1 458 991 923 $ US | - | - |
| 2023 | −1 046 720 513 $ US | - | - |
| 2022 | −999 242 175 $ US | - | - |
| 2021 | −863 474 324 $ US | - | - |
| 2020 | −668 160 790 $ US | −743 893 212 $ US | 76 263 578 $ US |
| 2019 | −596 247 540 $ US | −756 882 854 $ US | 161 277 050 $ US |
| 2018 | −626 559 041 $ US | −782 473 426 $ US | 156 459 246 $ US |
| 2017 | −485 744 805 $ US | −643 771 343 $ US | 141 777 999 $ US |
| 2016 | −788 161 617 $ US | −964 676 414 $ US | 142 922 125 $ US |
| 2015 | −904 002 749 $ US | −1 033 133 707 $ US | 114 720 381 $ US |
| 2014 | −807 977 879 $ US | −887 874 097 $ US | 62 919 095 $ US |
| 2013 | −838 559 051 $ US | −870 717 643 $ US | 14 643 126 $ US |
| 2012 | −526 999 628 $ US | −557 937 858 $ US | 15 669 887 $ US |
| 2011 | −799 431 509 $ US | −842 105 649 $ US | 35 260 771 $ US |
| 2010 | −538 553 133 $ US | −448 672 589 $ US | −83 822 718 $ US |
| 2009 | −495 214 240 $ US | −413 799 319 $ US | −81 493 527 $ US |
| 2008 | −533 645 691 $ US | −456 488 233 $ US | −76 392 370 $ US |
| 2007 | −471 120 173 $ US | −395 605 331 $ US | −69 531 248 $ US |
| 2006 | −382 484 470 $ US | −318 996 857 $ US | −63 484 635 $ US |
| 2005 | −357 277 737 $ US | −283 447 116 $ US | −73 819 863 $ US |
| 2004 | −342 211 069 $ US | −252 670 947 $ US | −89 517 534 $ US |
| 2003 | −266 850 191 $ US | −157 087 877 $ US | −109 760 791 $ US |
| 2002 | −210 489 485 $ US | −152 026 293 $ US | −58 454 990 $ US |
| 2001 | −217 202 587 $ US | −158 991 489 $ US | −58 197 889 $ US |
| 2000 | −178 970 129 $ US | −122 940 044 $ US | −56 023 026 $ US |
| 1999 | −165 418 891 $ US | −97 984 746 $ US | −62 187 908 $ US |
| 1998 | −215 086 072 $ US | −133 175 292 $ US | −73 222 934 $ US |
| 1997 | −174 557 318 $ US | −108 049 185 $ US | −79 382 271 $ US |
| 1996 | −196 858 456 $ US | −127 126 754 $ US | −85 197 523 $ US |
| 1995 | −186 521 935 $ US | −129 059 808 $ US | −76 935 032 $ US |
| 1994 | −82 192 917 $ US | −37 128 649 $ US | −54 453 790 $ US |
| 1993 | −135 238 578 $ US | −111 282 360 $ US | −43 596 862 $ US |
| 1992 | −184 284 413 $ US | −127 718 350 $ US | −74 048 384 $ US |
| 1991 | −201 621 961 $ US | −52 579 357 $ US | −169 815 054 $ US |
| 1990 | −167 419 233 $ US | −88 895 080 $ US | −95 021 469 $ US |
| 1989 | −177 517 346 $ US | −58 427 947 $ US | −67 778 801 $ US |
| 1988 | −231 056 754 $ US | −69 115 740 $ US | −95 031 624 $ US |
| 1987 | −165 402 312 $ US | −39 625 794 $ US | −77 764 249 $ US |
| 1986 | −176 165 176 $ US | −56 204 644 $ US | −68 615 637 $ US |
| 1985 | −93 986 789 $ US | −21 748 955 $ US | −44 855 690 $ US |
| 1984 | −7 756 559 $ US | 27 771 633 $ US | −35 847 948 $ US |
| 1983 | −86 728 710 $ US | −18 269 799 $ US | −47 099 448 $ US |
| 1982 | −152 302 303 $ US | −63 337 200 $ US | −47 731 898 $ US |
| 1981 | −212 808 834 $ US | −36 226 944 $ US | −48 890 181 $ US |
| 1980 | −212 048 502 $ US | −48 348 265 $ US | −92 895 879 $ US |
| 1979 | −345 615 402 $ US | −173 757 589 $ US | −100 159 060 $ US |
| 1978 | −347 727 998 $ US | −148 934 754 $ US | −98 162 751 $ US |
| 1977 | −205 529 887 $ US | −53 439 502 $ US | −62 634 401 $ US |
| 1976 | −86 633 909 $ US | −21 766 015 $ US | −36 241 817 $ US |
| 1975 | −156 961 473 $ US | −70 560 381 $ US | −41 178 109 $ US |
| 1974 | 139 275 877 $ US | 117 018 919 $ US | −23 738 634 $ US |
| 1973 | −38 734 392 $ US | - | - |
| 1972 | −34 092 200 $ US | - | - |
| 1971 | −23 715 655 $ US | - | - |
| 1970 | −4 379 907 $ US | - | - |
| 1969 | 6 518 824 $ US | - | - |
| 1968 | 7 415 677 $ US | - | - |
| 1967 | 2 296 252 $ US | - | - |
| 1966 | −5 173 349 $ US | - | - |
| 1965 | −16 417 583 $ US | - | - |
| 1964 | −18 936 817 $ US | - | - |
| 1963 | −19 356 425 $ US | - | - |
La balance commerciale du Togo affiche un déficit de 1,46 milliard de dollars (2024), contre un déficit de 19,4 millions de dollars en 1963. Le plus grand excédent a été de 139 millions de dollars, en 1974. La balance commerciale du Togo est déficitaire chaque année depuis 1975. Le commerce de biens affiche un déficit de 744 millions de dollars et celui de services un excédent de 76,3 millions de dollars.
Le solde commercial du Togo est le 31e plus élevé de 50 pays situés en Afrique, où les soldes vont d'un déficit de 42,7 milliards de dollars en Égypte en 2025 à un excédent de 13,8 milliards de dollars en Angola en 2025. Sur les dix années à partir de 2015, les soldes commerciaux du Togo ont totalisé un déficit de 8,44 milliards de dollars, contre un déficit de 5,75 milliards de dollars de 2005 à 2014. Les transactions courantes du Togo affichent un déficit de 0,3 % du PIB (2020).
Commerce de biens du Togo avec ses 10 principaux partenaires commerciaux, selon le Togo, 2025
| Pays | Exportations vers | Importations depuis | Solde | |
|---|---|---|---|---|
 Chine |
18,2 M $US | 890 M $US | −872 M $US | |
 Inde |
330 M $US | 190 M $US | +140 M $US | |
 France |
100 M $US | 259 M $US | −159 M $US | vs France |
 Burkina Faso |
178 M $US | 75,9 M $US | +102 M $US | vs Burkina Faso |
 Côte d’Ivoire |
203 M $US | 35,3 M $US | +168 M $US | vs Côte d’Ivoire |
 Nigeria |
17,2 M $US | 185 M $US | −168 M $US | |
 Ghana |
103 M $US | 84,5 M $US | +18,6 M $US | vs Ghana |
 États-Unis |
69,5 M $US | 88,1 M $US | −18,5 M $US | |
 Bénin |
126 M $US | 14,8 M $US | +111 M $US | vs Bénin |
 Japon |
9,68 M $US | 125 M $US | −115 M $US |
Balance commerciale du Togo : excédent (+) ou déficit (−)
| Biens et services, $ US, 2024 | −1,46 Md $US |
|---|---|
| % du PIB, 2024 | −13,7 % |
| Années d'excédent, 2000–2024 | 0 |
| Biens, $ US, 2020 | −744 M $US |
| Services, $ US, 2020 | +76,3 M $US |
| Premier excédent en biens, 2025 | Côte d’Ivoire +168 M $US |
| Premier déficit en biens, 2025 | Chine −872 M $US |
Comparer la balance commerciale du Togo avec celle d'autres pays
Sources :
- TradeMap (2025, mis à jour en octobre 2026)
- Banque mondiale | Économie et croissance (1963–2024, mis à jour en octobre 2026)
Creative Commons Attribution (CC BY) : vous pouvez copier, partager, adapter et réutiliser ce contenu, y compris à des fins commerciales, à condition de citer statistics.wiki et d’indiquer les modifications apportées. Les sources citées ci-dessus peuvent avoir leurs propres conditions de licence.