
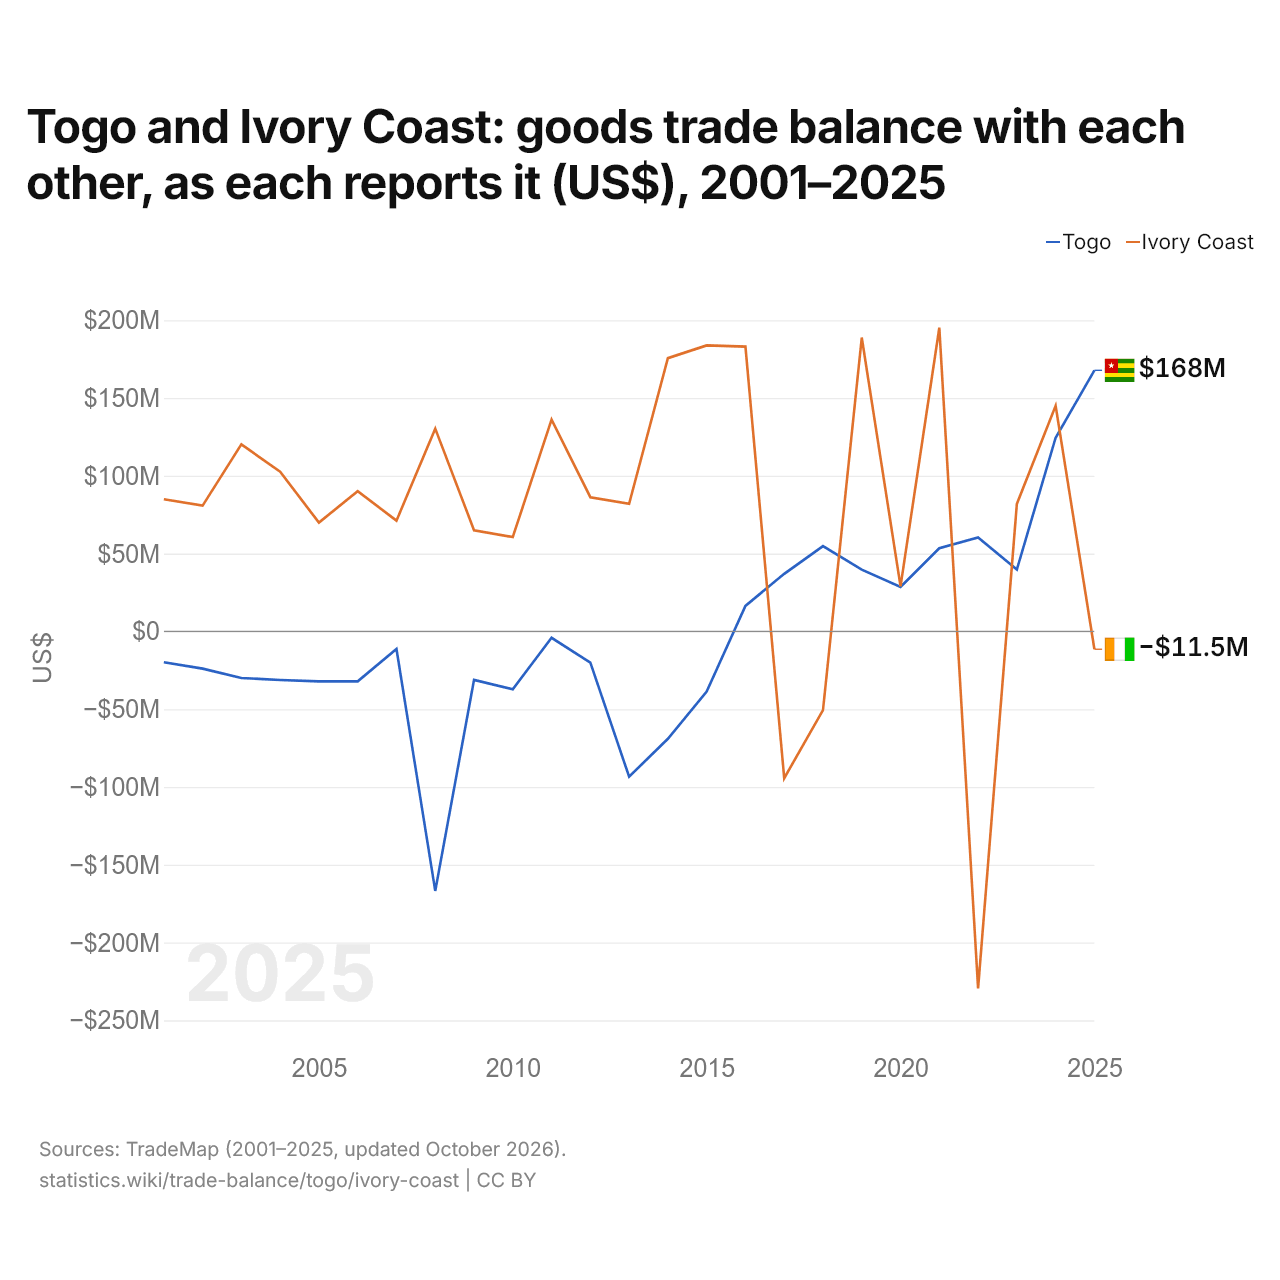
Le Togo et la Côte d’Ivoire : solde de leur commerce de biens bilatéral, selon chacun ($ US), 2001–2025
| Année | $ US | |
|---|---|---|
| Togo | Côte d’Ivoire | |
| 2025 | 167 792 000 $ US | −11 473 000 $ US |
| 2024 | 124 458 000 $ US | 145 035 000 $ US |
| 2023 | 39 713 000 $ US | 81 938 000 $ US |
| 2022 | 60 317 000 $ US | −229 422 000 $ US |
| 2021 | 53 472 000 $ US | 195 182 000 $ US |
| 2020 | 28 563 000 $ US | 28 923 000 $ US |
| 2019 | 39 655 000 $ US | 188 859 000 $ US |
| 2018 | 54 785 000 $ US | −50 581 000 $ US |
| 2017 | 36 997 000 $ US | −94 409 000 $ US |
| 2016 | 16 412 000 $ US | 183 065 000 $ US |
| 2015 | −38 673 000 $ US | 183 825 000 $ US |
| 2014 | −69 083 000 $ US | 175 601 000 $ US |
| 2013 | −93 392 000 $ US | 82 013 000 $ US |
| 2012 | −20 078 000 $ US | 86 224 000 $ US |
| 2011 | −4 124 000 $ US | 136 164 000 $ US |
| 2010 | −37 266 000 $ US | 60 634 000 $ US |
| 2009 | −31 235 000 $ US | 65 018 000 $ US |
| 2008 | −166 804 000 $ US | 130 331 000 $ US |
| 2007 | −11 336 000 $ US | 71 149 000 $ US |
| 2006 | −32 116 000 $ US | 90 130 000 $ US |
| 2005 | −32 116 000 $ US | 69 909 000 $ US |
| 2004 | −31 251 000 $ US | 102 589 000 $ US |
| 2003 | −29 970 000 $ US | 120 186 000 $ US |
| 2002 | −23 938 000 $ US | 80 805 000 $ US |
| 2001 | −19 851 000 $ US | 84 937 000 $ US |
En 2025, selon le Togo, son commerce de biens avec la Côte d’Ivoire affichait un excédent de 168 millions de dollars ; selon la Côte d’Ivoire, son commerce de biens avec le Togo affichait un déficit de 11,5 millions de dollars. En 2001, les chiffres étaient un déficit de 19,9 millions de dollars pour le Togo et un excédent de 84,9 millions de dollars pour la Côte d’Ivoire.
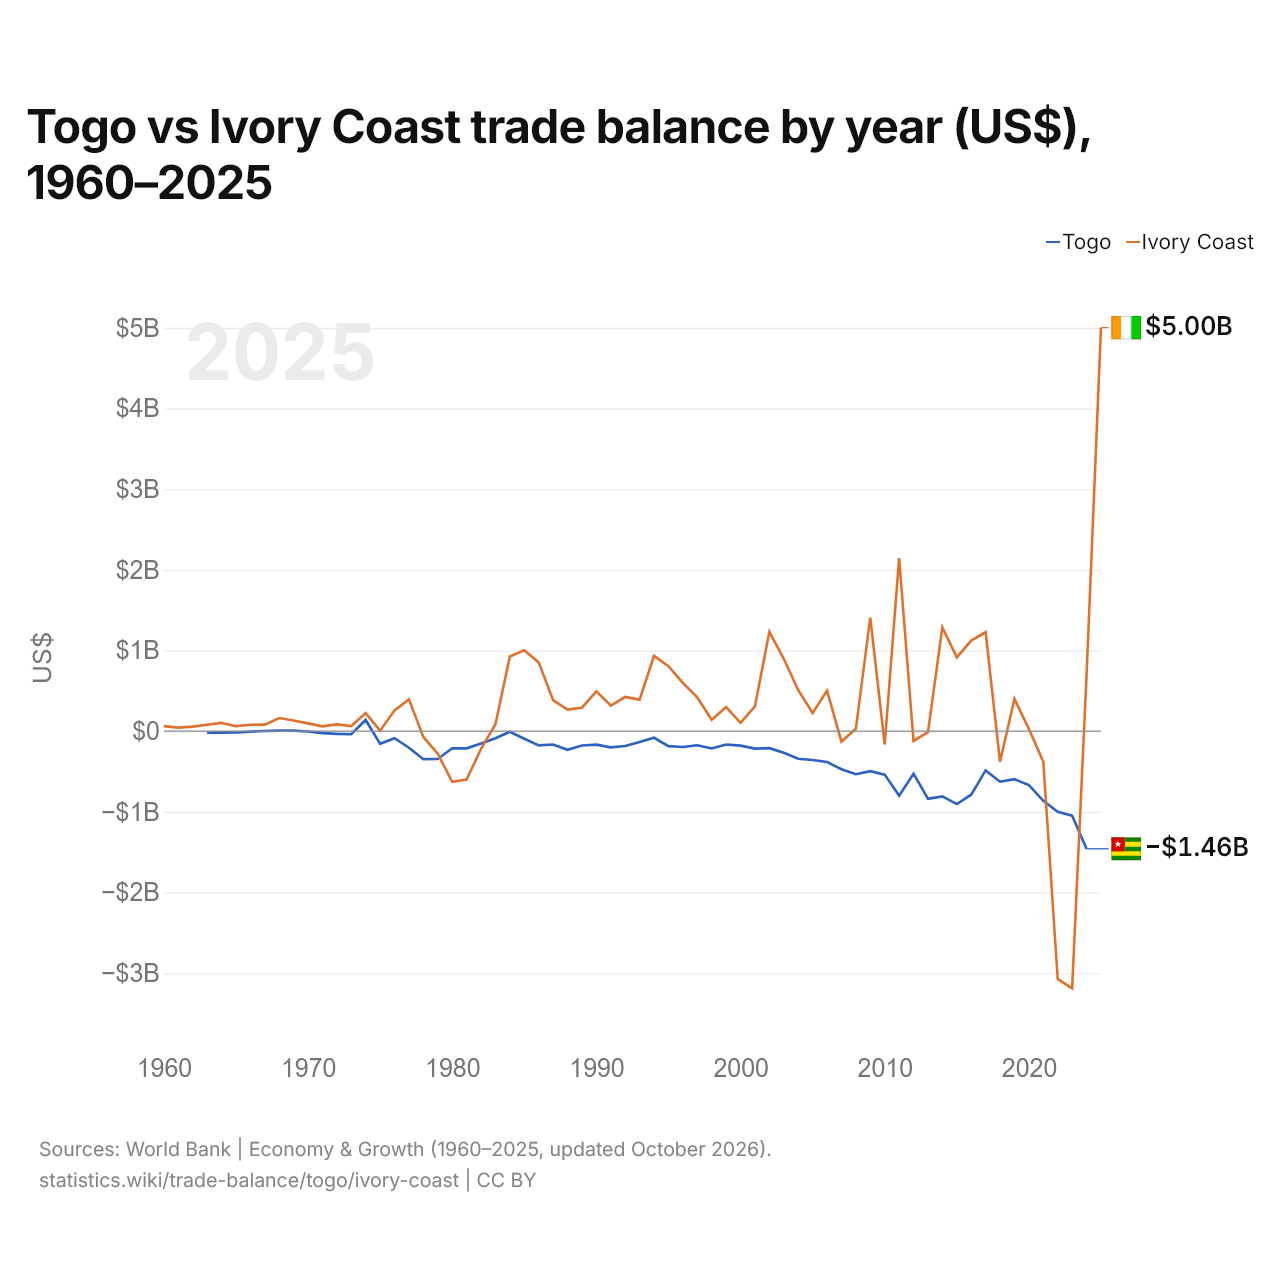
Togo vs Côte d’Ivoire : balance commerciale par année ($ US), 1960–2025
| Année | $ US | |
|---|---|---|
 Togo |
 Côte d’Ivoire |
|
| 2025 | - | 5 001 533 084 $ US |
| 2024 | −1 458 991 923 $ US | 689 098 069 $ US |
| 2023 | −1 046 720 513 $ US | −3 187 854 323 $ US |
| 2022 | −999 242 175 $ US | −3 072 143 001 $ US |
| 2021 | −863 474 324 $ US | −379 621 921 $ US |
| 2020 | −668 160 790 $ US | 27 924 584 $ US |
| 2019 | −596 247 540 $ US | 398 869 444 $ US |
| 2018 | −626 559 041 $ US | −379 874 598 $ US |
| 2017 | −485 744 805 $ US | 1 226 197 749 $ US |
| 2016 | −788 161 617 $ US | 1 122 162 840 $ US |
| 2015 | −904 002 749 $ US | 914 200 449 $ US |
| 2014 | −807 977 879 $ US | 1 286 280 537 $ US |
| 2013 | −838 559 051 $ US | −13 629 371 $ US |
| 2012 | −526 999 628 $ US | −122 015 134 $ US |
| 2011 | −799 431 509 $ US | 2 145 426 099 $ US |
| 2010 | −538 553 133 $ US | −165 525 048 $ US |
| 2009 | −495 214 240 $ US | 1 407 176 644 $ US |
| 2008 | −533 645 691 $ US | 29 551 575 $ US |
| 2007 | −471 120 173 $ US | −129 143 421 $ US |
| 2006 | −382 484 470 $ US | 503 475 150 $ US |
| 2005 | −357 277 737 $ US | 225 231 796 $ US |
| 2004 | −342 211 069 $ US | 508 835 024 $ US |
| 2003 | −266 850 191 $ US | 897 241 871 $ US |
| 2002 | −210 489 485 $ US | 1 231 376 583 $ US |
| 2001 | −217 202 587 $ US | 306 880 479 $ US |
| 2000 | −178 970 129 $ US | 102 138 413 $ US |
| 1999 | −165 418 891 $ US | 298 433 532 $ US |
| 1998 | −215 086 072 $ US | 140 294 992 $ US |
| 1997 | −174 557 318 $ US | 418 272 325 $ US |
| 1996 | −196 858 456 $ US | 597 310 044 $ US |
| 1995 | −186 521 935 $ US | 804 798 798 $ US |
| 1994 | −82 192 917 $ US | 932 626 995 $ US |
| 1993 | −135 238 578 $ US | 390 620 488 $ US |
| 1992 | −184 284 413 $ US | 423 133 527 $ US |
| 1991 | −201 621 961 $ US | 317 468 262 $ US |
| 1990 | −167 419 233 $ US | 494 261 432 $ US |
| 1989 | −177 517 346 $ US | 290 588 103 $ US |
| 1988 | −231 056 754 $ US | 266 427 821 $ US |
| 1987 | −165 402 312 $ US | 384 312 612 $ US |
| 1986 | −176 165 176 $ US | 853 046 354 $ US |
| 1985 | −93 986 789 $ US | 1 003 198 621 $ US |
| 1984 | −7 756 559 $ US | 925 034 590 $ US |
| 1983 | −86 728 710 $ US | 84 762 231 $ US |
| 1982 | −152 302 303 $ US | −219 715 929 $ US |
| 1981 | −212 808 834 $ US | −599 489 001 $ US |
| 1980 | −212 048 502 $ US | −628 551 057 $ US |
| 1979 | −345 615 402 $ US | −279 708 272 $ US |
| 1978 | −347 727 998 $ US | −72 233 812 $ US |
| 1977 | −205 529 887 $ US | 394 416 093 $ US |
| 1976 | −86 633 909 $ US | 256 120 028 $ US |
| 1975 | −156 961 473 $ US | 5 599 275 $ US |
| 1974 | 139 275 877 $ US | 224 756 758 $ US |
| 1973 | −38 734 392 $ US | 63 260 158 $ US |
| 1972 | −34 092 200 $ US | 83 324 180 $ US |
| 1971 | −23 715 655 $ US | 59 922 294 $ US |
| 1970 | −4 379 907 $ US | 96 959 815 $ US |
| 1969 | 6 518 824 $ US | 131 943 093 $ US |
| 1968 | 7 415 677 $ US | 162 785 614 $ US |
| 1967 | 2 296 252 $ US | 80 487 491 $ US |
| 1966 | −5 173 349 $ US | 78 964 840 $ US |
| 1965 | −16 417 583 $ US | 61 617 237 $ US |
| 1964 | −18 936 817 $ US | 102 820 694 $ US |
| 1963 | −19 356 425 $ US | 79 267 524 $ US |
| 1962 | - | 55 789 331 $ US |
| 1961 | - | 44 445 573 $ US |
| 1960 | - | 61 912 319 $ US |
La balance commerciale du Togo affichait un déficit de 1,46 milliard de dollars (2024) et celle de la Côte d’Ivoire un excédent de 689 millions de dollars (2024). En 1963, la balance commerciale du Togo affichait un déficit de 19,4 millions de dollars et celle de la Côte d’Ivoire un excédent de 79,3 millions de dollars.
Depuis 1963, la balance commerciale du Togo a été excédentaire pendant 4 des 62 années, et celle de la Côte d’Ivoire pendant 49. Les balances commerciales du Togo et de la Côte d’Ivoire ont été déficitaires en même temps pendant 13 de ces années, la dernière fois en 2023.
Togo vs Côte d’Ivoire : chiffres de la balance commerciale
|
Togo
|
Côte d’Ivoire
|
|
|---|---|---|
| Biens et services, $ US | −1,46 Md $US (2024) | +5,00 Md $US (2025) |
| % du PIB | −13,7 % (2024) | +5,0 % (2025) |
| Années d'excédent depuis 2000 | 0 sur 25 | 18 sur 26 |
| Solde des biens entre les deux, chiffres propres | +168 M $US (2025) | −11,5 M $US (2025) |
| Premier excédent en biens avec | Côte d’Ivoire (+168 M $US, 2025) | Suisse (+4,21 Md $US, 2025) |
| Premier déficit en biens avec | Chine (−872 M $US, 2025) | Chine (−2,74 Md $US, 2025) |
Comparer la balance commerciale de 2 pays au choix
Sources :
- Banque mondiale | Économie et croissance (1960–2025, mis à jour en octobre 2026)
- TradeMap (2001–2025, mis à jour en octobre 2026)
Creative Commons Attribution (CC BY) : vous pouvez copier, partager, adapter et réutiliser ce contenu, y compris à des fins commerciales, à condition de citer statistics.wiki et d’indiquer les modifications apportées. Les sources citées ci-dessus peuvent avoir leurs propres conditions de licence.