
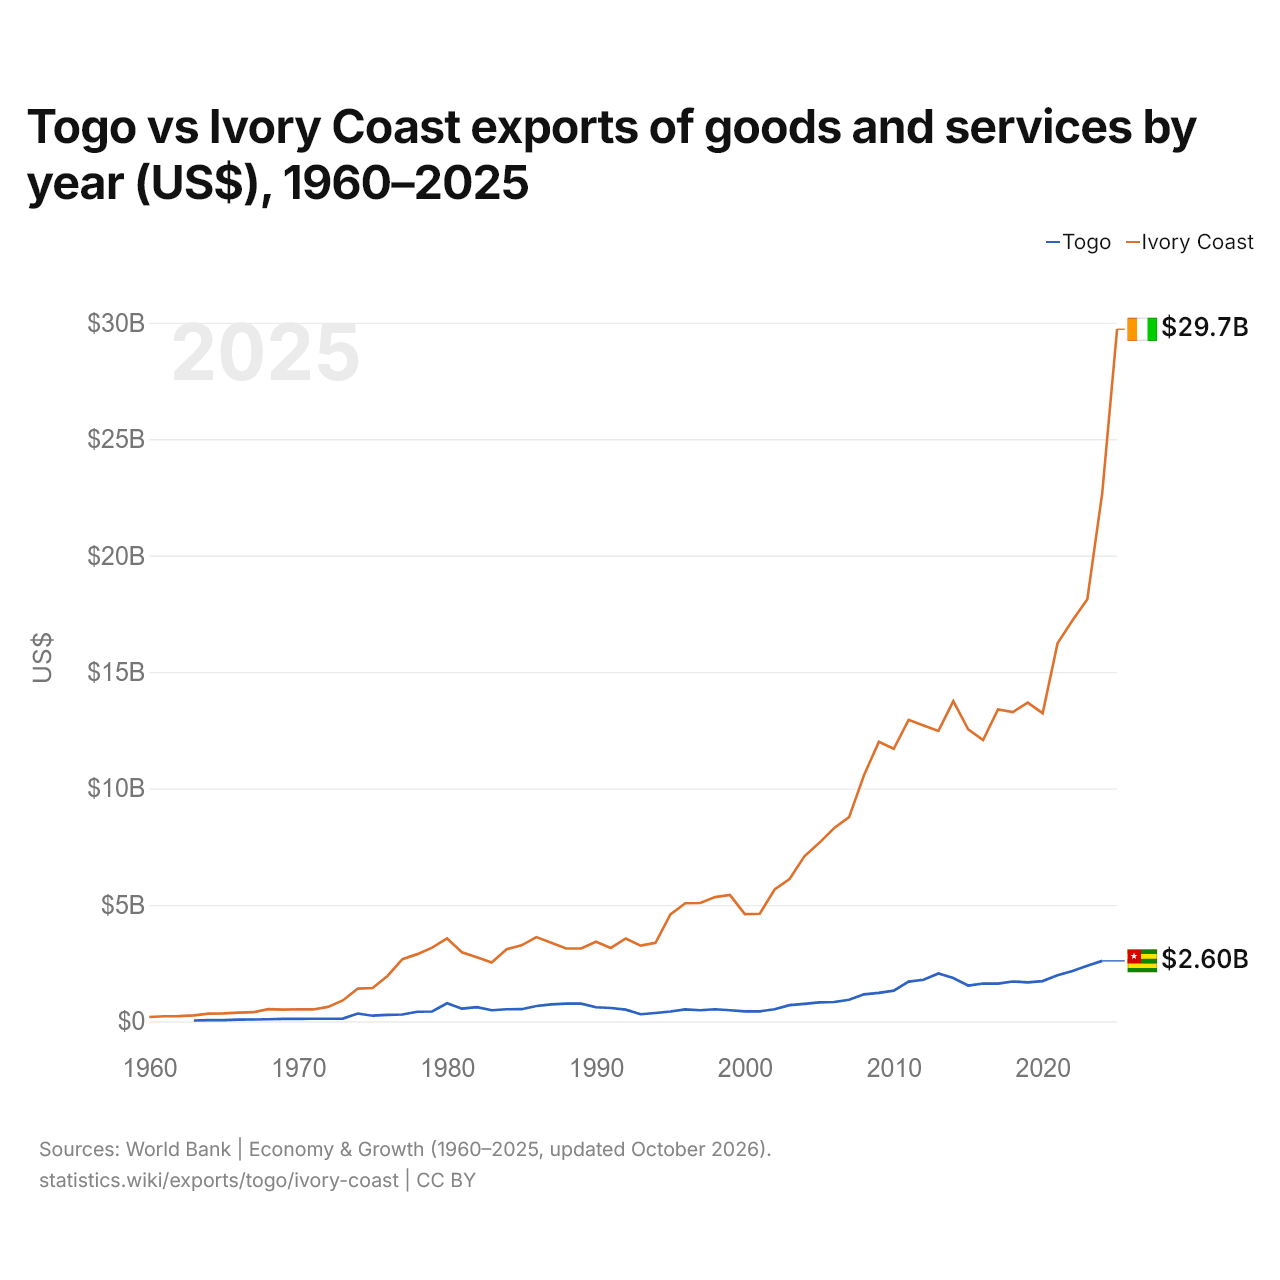
Togo vs Côte d’Ivoire : exportations de biens et services par année ($ US), 1960–2025
| Année | $ US | |
|---|---|---|
 Togo |
 Côte d’Ivoire |
|
| 2025 | - | 29 717 948 364 $ US |
| 2024 | 2 595 208 462 $ US | 22 673 827 946 $ US |
| 2023 | 2 390 186 784 $ US | 18 123 337 011 $ US |
| 2022 | 2 162 409 655 $ US | 17 211 097 451 $ US |
| 2021 | 1 976 054 796 $ US | 16 230 487 159 $ US |
| 2020 | 1 727 046 855 $ US | 13 231 732 415 $ US |
| 2019 | 1 671 782 879 $ US | 13 683 059 069 $ US |
| 2018 | 1 710 211 644 $ US | 13 281 208 105 $ US |
| 2017 | 1 616 151 022 $ US | 13 390 010 535 $ US |
| 2016 | 1 622 914 086 $ US | 12 073 797 175 $ US |
| 2015 | 1 537 319 040 $ US | 12 532 872 785 $ US |
| 2014 | 1 862 941 457 $ US | 13 752 704 950 $ US |
| 2013 | 2 054 079 312 $ US | 12 469 056 845 $ US |
| 2012 | 1 785 883 226 $ US | 12 699 449 618 $ US |
| 2011 | 1 707 777 924 $ US | 12 946 046 205 $ US |
| 2010 | 1 315 957 055 $ US | 11 703 514 551 $ US |
| 2009 | 1 221 146 144 $ US | 12 000 249 513 $ US |
| 2008 | 1 159 663 571 $ US | 10 568 912 670 $ US |
| 2007 | 925 780 996 $ US | 8 769 225 736 $ US |
| 2006 | 831 810 885 $ US | 8 302 651 292 $ US |
| 2005 | 811 362 054 $ US | 7 662 724 560 $ US |
| 2004 | 752 390 244 $ US | 7 086 390 531 $ US |
| 2003 | 694 096 765 $ US | 6 107 969 564 $ US |
| 2002 | 516 701 879 $ US | 5 662 064 300 $ US |
| 2001 | 429 366 653 $ US | 4 617 823 364 $ US |
| 2000 | 424 670 348 $ US | 4 606 906 377 $ US |
| 1999 | 475 147 222 $ US | 5 423 051 765 $ US |
| 1998 | 517 181 588 $ US | 5 333 495 973 $ US |
| 1997 | 475 868 141 $ US | 5 082 544 459 $ US |
| 1996 | 516 316 176 $ US | 5 069 827 395 $ US |
| 1995 | 420 808 142 $ US | 4 593 584 043 $ US |
| 1994 | 358 302 927 $ US | 3 369 268 861 $ US |
| 1993 | 304 394 721 $ US | 3 252 142 767 $ US |
| 1992 | 501 433 055 $ US | 3 558 855 911 $ US |
| 1991 | 571 926 371 $ US | 3 149 018 976 $ US |
| 1990 | 603 505 041 $ US | 3 421 191 519 $ US |
| 1989 | 762 306 409 $ US | 3 125 624 101 $ US |
| 1988 | 761 211 516 $ US | 3 126 609 348 $ US |
| 1987 | 730 213 616 $ US | 3 372 301 899 $ US |
| 1986 | 658 172 673 $ US | 3 617 154 609 $ US |
| 1985 | 521 170 889 $ US | 3 263 790 017 $ US |
| 1984 | 519 366 253 $ US | 3 100 078 629 $ US |
| 1983 | 475 737 820 $ US | 2 527 383 513 $ US |
| 1982 | 612 220 841 $ US | 2 756 186 089 $ US |
| 1981 | 544 664 193 $ US | 2 966 163 807 $ US |
| 1980 | 773 472 155 $ US | 3 561 631 958 $ US |
| 1979 | 423 733 952 $ US | 3 163 758 914 $ US |
| 1978 | 411 848 054 $ US | 2 885 367 253 $ US |
| 1977 | 292 684 965 $ US | 2 670 550 588 $ US |
| 1976 | 278 511 973 $ US | 1 946 009 811 $ US |
| 1975 | 241 897 335 $ US | 1 430 151 941 $ US |
| 1974 | 334 262 104 $ US | 1 402 964 049 $ US |
| 1973 | 118 108 145 $ US | 896 858 258 $ US |
| 1972 | 111 476 082 $ US | 619 773 297 $ US |
| 1971 | 112 649 362 $ US | 510 247 677 $ US |
| 1970 | 105 117 779 $ US | 520 616 379 $ US |
| 1969 | 107 560 601 $ US | 500 460 515 $ US |
| 1968 | 89 558 558 $ US | 521 479 841 $ US |
| 1967 | 76 924 426 $ US | 392 274 888 $ US |
| 1966 | 73 576 520 $ US | 372 845 040 $ US |
| 1965 | 55 333 336 $ US | 338 691 142 $ US |
| 1964 | 53 756 126 $ US | 330 533 062 $ US |
| 1963 | 34 342 045 $ US | 258 264 804 $ US |
| 1962 | - | 221 930 266 $ US |
| 1961 | - | 218 194 460 $ US |
| 1960 | - | 187 017 625 $ US |
Les exportations de biens et services du Togo s'élevaient à 2,6 milliards de dollars (2024) et celles de la Côte d’Ivoire à 22,7 milliards de dollars (2024) : celles de la Côte d’Ivoire étaient 8,7 fois plus élevées. En 1963, les exportations de la Côte d’Ivoire étaient 7,5 fois plus élevées : 34,3 millions de dollars pour le Togo et 258 millions de dollars pour la Côte d’Ivoire.
Les exportations de biens et services de la Côte d’Ivoire sont supérieures à celles du Togo chaque année depuis 1963.
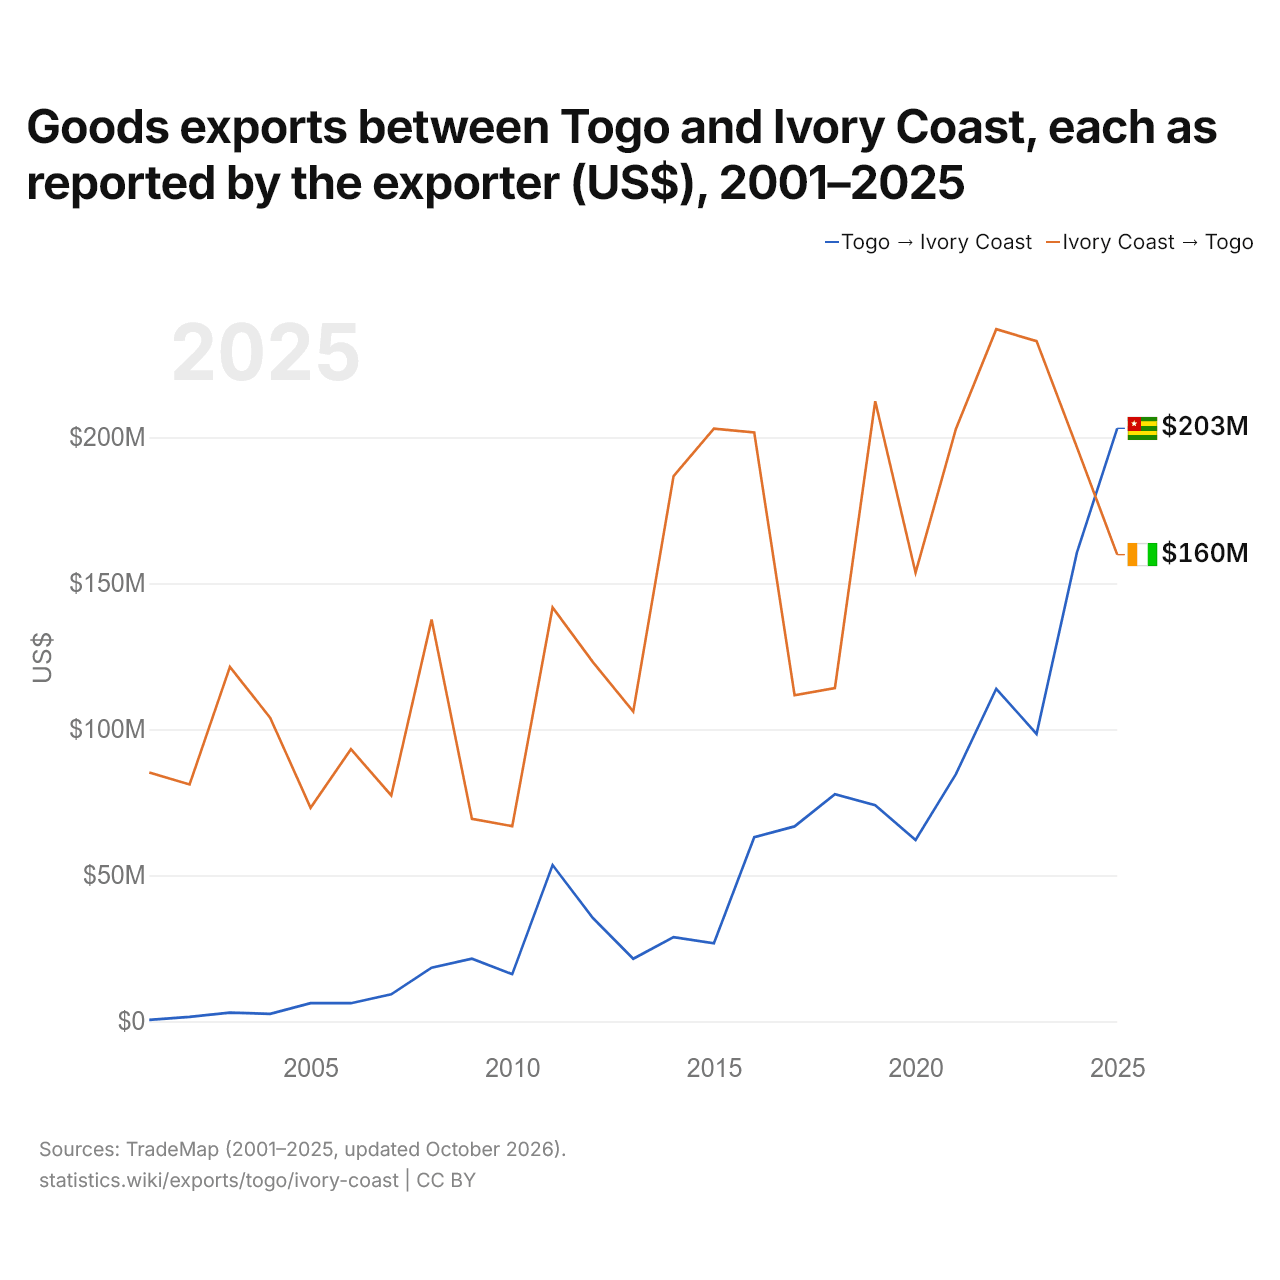
Exportations de biens entre le Togo et la Côte d’Ivoire, selon chaque exportateur ($ US), 2001–2025
| Année | $ US | |
|---|---|---|
| Togo → Côte d’Ivoire | Côte d’Ivoire → Togo | |
| 2025 | 203 078 000 $ US | 159 837 000 $ US |
| 2024 | 160 509 000 $ US | 196 641 000 $ US |
| 2023 | 98 444 000 $ US | 232 952 000 $ US |
| 2022 | 113 907 000 $ US | 237 038 000 $ US |
| 2021 | 84 666 000 $ US | 202 877 000 $ US |
| 2020 | 62 126 000 $ US | 153 633 000 $ US |
| 2019 | 73 982 000 $ US | 212 356 000 $ US |
| 2018 | 77 821 000 $ US | 114 154 000 $ US |
| 2017 | 66 757 000 $ US | 111 654 000 $ US |
| 2016 | 63 080 000 $ US | 201 650 000 $ US |
| 2015 | 26 751 000 $ US | 203 002 000 $ US |
| 2014 | 28 841 000 $ US | 186 733 000 $ US |
| 2013 | 21 431 000 $ US | 106 091 000 $ US |
| 2012 | 35 369 000 $ US | 123 018 000 $ US |
| 2011 | 53 527 000 $ US | 141 751 000 $ US |
| 2010 | 16 154 000 $ US | 66 838 000 $ US |
| 2009 | 21 476 000 $ US | 69 354 000 $ US |
| 2008 | 18 384 000 $ US | 137 590 000 $ US |
| 2007 | 9 257 000 $ US | 77 386 000 $ US |
| 2006 | 6 213 000 $ US | 93 199 000 $ US |
| 2005 | 6 213 000 $ US | 73 124 000 $ US |
| 2004 | 2 568 000 $ US | 103 937 000 $ US |
| 2003 | 2 993 000 $ US | 121 411 000 $ US |
| 2002 | 1 533 000 $ US | 81 120 000 $ US |
| 2001 | 506 000 $ US | 85 248 000 $ US |
En 2025, les exportations de biens du Togo vers la Côte d’Ivoire, selon le Togo, s'élevaient à 203 millions de dollars, et celles de la Côte d’Ivoire vers le Togo, selon la Côte d’Ivoire, à 160 millions de dollars : 27 % de plus pour celles du Togo. En 2001, elles s'élevaient à 506 000 dollars pour le Togo et à 85,2 millions de dollars pour la Côte d’Ivoire.
Togo vs Côte d’Ivoire : chiffres des exportations
|
Togo
|
Côte d’Ivoire
|
|
|---|---|---|
| Exportations | 2,60 Md $US (2024) | 29,7 Md $US (2025) |
| Rang mondial | 148/176 | 82/176 |
| Part mondiale | 0,008 % | 0,09 % |
| % du PIB | 24,4 % | 29,8 % |
| Première catégorie de biens | Pétrole, gaz, minerais et autres matières premières (31,4 %, 2025) | Aliments transformés, huiles, aliments pour animaux, boissons et tabac (42,8 %, 2025) |
| Première destination des biens | Inde (19,4 %, 2025) | Suisse (14,9 %, 2025) |
Comparer les exportations de 2 pays au choix
Sources :
- Banque mondiale | Économie et croissance (1960–2025, mis à jour en octobre 2026)
- TradeMap (2001–2025, mis à jour en octobre 2026)
Creative Commons Attribution (CC BY) : vous pouvez copier, partager, adapter et réutiliser ce contenu, y compris à des fins commerciales, à condition de citer statistics.wiki et d’indiquer les modifications apportées. Les sources citées ci-dessus peuvent avoir leurs propres conditions de licence.