
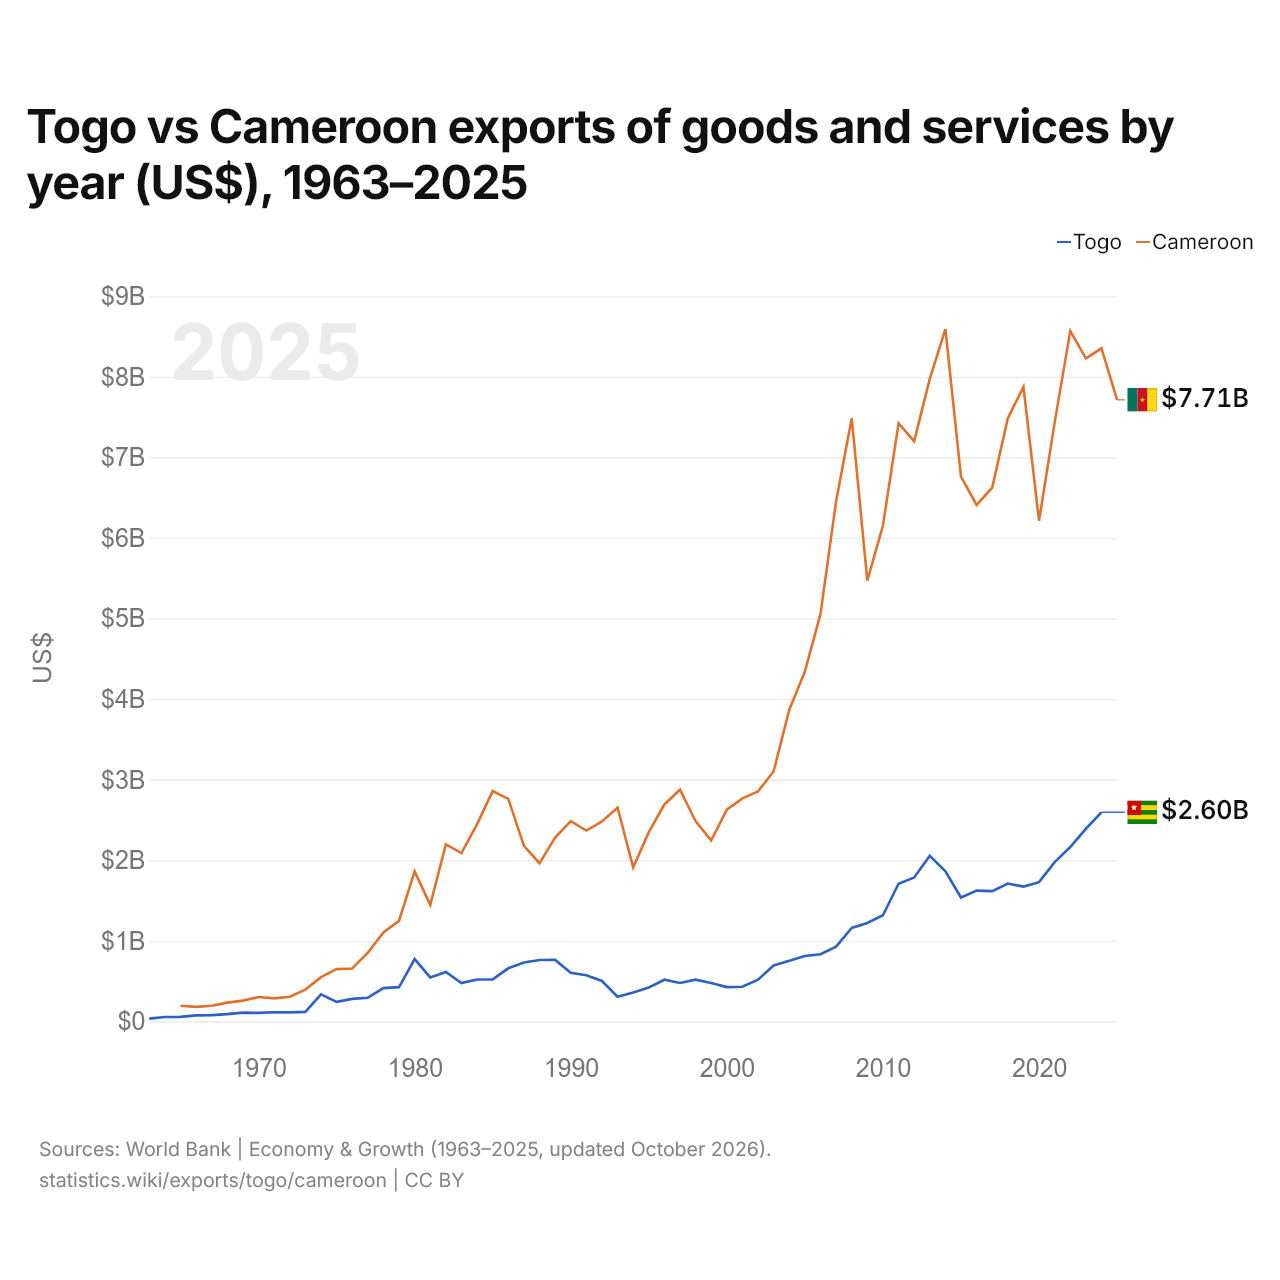
Togo vs Cameroun : exportations de biens et services par année ($ US), 1963–2025
| Année | $ US | |
|---|---|---|
 Togo |
 Cameroun |
|
| 2025 | - | 7 713 888 549 $ US |
| 2024 | 2 595 208 462 $ US | 8 353 326 094 $ US |
| 2023 | 2 390 186 784 $ US | 8 226 588 945 $ US |
| 2022 | 2 162 409 655 $ US | 8 568 684 369 $ US |
| 2021 | 1 976 054 796 $ US | 7 430 968 539 $ US |
| 2020 | 1 727 046 855 $ US | 6 212 103 785 $ US |
| 2019 | 1 671 782 879 $ US | 7 874 085 867 $ US |
| 2018 | 1 710 211 644 $ US | 7 486 173 533 $ US |
| 2017 | 1 616 151 022 $ US | 6 624 479 953 $ US |
| 2016 | 1 622 914 086 $ US | 6 407 809 686 $ US |
| 2015 | 1 537 319 040 $ US | 6 760 654 005 $ US |
| 2014 | 1 862 941 457 $ US | 8 590 854 303 $ US |
| 2013 | 2 054 079 312 $ US | 7 973 145 413 $ US |
| 2012 | 1 785 883 226 $ US | 7 200 040 957 $ US |
| 2011 | 1 707 777 924 $ US | 7 421 773 623 $ US |
| 2010 | 1 315 957 055 $ US | 6 153 122 906 $ US |
| 2009 | 1 221 146 144 $ US | 5 469 950 249 $ US |
| 2008 | 1 159 663 571 $ US | 7 485 406 851 $ US |
| 2007 | 925 780 996 $ US | 6 455 516 974 $ US |
| 2006 | 831 810 885 $ US | 5 055 972 600 $ US |
| 2005 | 811 362 054 $ US | 4 340 055 666 $ US |
| 2004 | 752 390 244 $ US | 3 868 330 225 $ US |
| 2003 | 694 096 765 $ US | 3 104 135 993 $ US |
| 2002 | 516 701 879 $ US | 2 854 249 060 $ US |
| 2001 | 429 366 653 $ US | 2 766 983 730 $ US |
| 2000 | 424 670 348 $ US | 2 626 514 828 $ US |
| 1999 | 475 147 222 $ US | 2 247 078 226 $ US |
| 1998 | 517 181 588 $ US | 2 483 240 189 $ US |
| 1997 | 475 868 141 $ US | 2 875 461 379 $ US |
| 1996 | 516 316 176 $ US | 2 691 568 972 $ US |
| 1995 | 420 808 142 $ US | 2 348 799 529 $ US |
| 1994 | 358 302 927 $ US | 1 912 336 306 $ US |
| 1993 | 304 394 721 $ US | 2 652 315 493 $ US |
| 1992 | 501 433 055 $ US | 2 480 390 364 $ US |
| 1991 | 571 926 371 $ US | 2 367 905 904 $ US |
| 1990 | 603 505 041 $ US | 2 485 421 488 $ US |
| 1989 | 762 306 409 $ US | 2 280 376 117 $ US |
| 1988 | 761 211 516 $ US | 1 961 804 002 $ US |
| 1987 | 730 213 616 $ US | 2 178 543 701 $ US |
| 1986 | 658 172 673 $ US | 2 760 485 196 $ US |
| 1985 | 521 170 889 $ US | 2 858 134 101 $ US |
| 1984 | 519 366 253 $ US | 2 447 934 060 $ US |
| 1983 | 475 737 820 $ US | 2 088 376 143 $ US |
| 1982 | 612 220 841 $ US | 2 195 884 893 $ US |
| 1981 | 544 664 193 $ US | 1 445 617 474 $ US |
| 1980 | 773 472 155 $ US | 1 861 186 771 $ US |
| 1979 | 423 733 952 $ US | 1 247 639 814 $ US |
| 1978 | 411 848 054 $ US | 1 103 007 002 $ US |
| 1977 | 292 684 965 $ US | 850 701 204 $ US |
| 1976 | 278 511 973 $ US | 656 202 836 $ US |
| 1975 | 241 897 335 $ US | 648 117 760 $ US |
| 1974 | 334 262 104 $ US | 548 805 301 $ US |
| 1973 | 118 108 145 $ US | 393 469 131 $ US |
| 1972 | 111 476 082 $ US | 305 521 571 $ US |
| 1971 | 112 649 362 $ US | 284 721 122 $ US |
| 1970 | 105 117 779 $ US | 301 733 187 $ US |
| 1969 | 107 560 601 $ US | 257 346 672 $ US |
| 1968 | 89 558 558 $ US | 231 454 655 $ US |
| 1967 | 76 924 426 $ US | 193 088 700 $ US |
| 1966 | 73 576 520 $ US | 178 688 820 $ US |
| 1965 | 55 333 336 $ US | 193 421 238 $ US |
| 1964 | 53 756 126 $ US | - |
| 1963 | 34 342 045 $ US | - |
Les exportations de biens et services du Togo s'élevaient à 2,6 milliards de dollars (2024) et celles du Cameroun à 8,35 milliards de dollars (2024) : celles du Cameroun étaient 3,2 fois plus élevées. En 1965, les exportations du Cameroun étaient 3,5 fois plus élevées : 55,3 millions de dollars pour le Togo et 193 millions de dollars pour le Cameroun.
Les exportations de biens et services du Cameroun sont supérieures à celles du Togo chaque année depuis 1965.
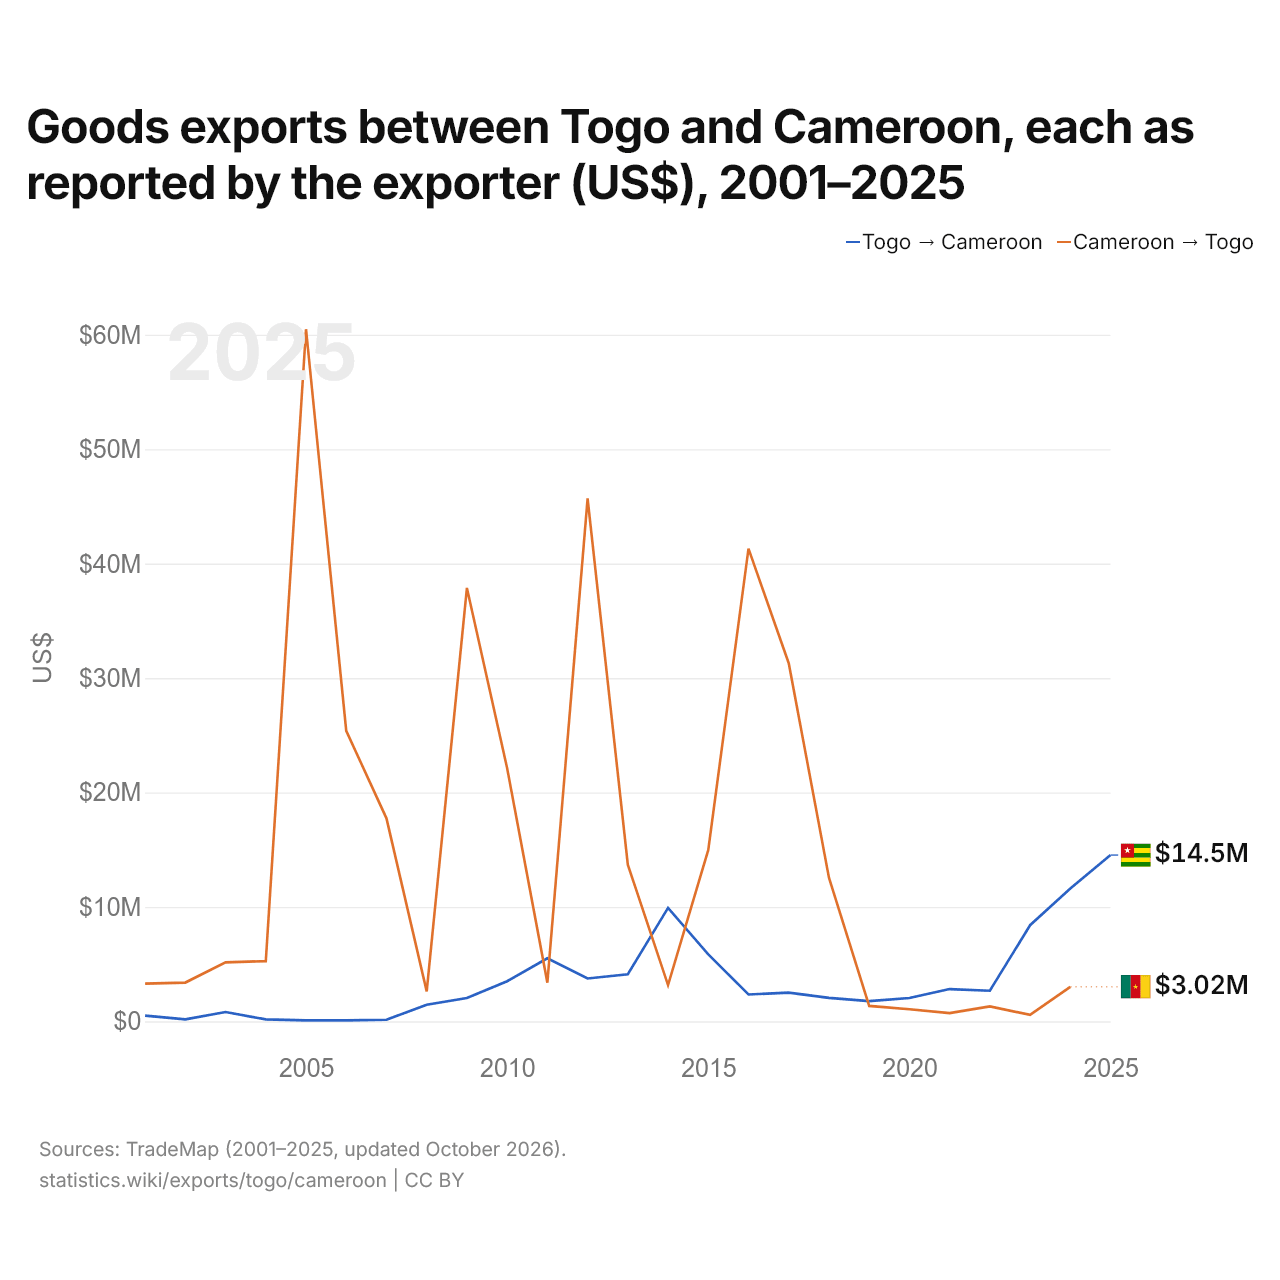
Exportations de biens entre le Togo et le Cameroun, selon chaque exportateur ($ US), 2001–2025
| Année | $ US | |
|---|---|---|
| Togo → Cameroun | Cameroun → Togo | |
| 2025 | 14 529 000 $ US | - |
| 2024 | 11 604 000 $ US | 3 020 000 $ US |
| 2023 | 8 399 000 $ US | 560 000 $ US |
| 2022 | 2 674 000 $ US | 1 304 000 $ US |
| 2021 | 2 821 000 $ US | 717 000 $ US |
| 2020 | 2 037 000 $ US | 1 055 000 $ US |
| 2019 | 1 765 000 $ US | 1 347 000 $ US |
| 2018 | 2 044 000 $ US | 12 555 000 $ US |
| 2017 | 2 506 000 $ US | 31 300 000 $ US |
| 2016 | 2 346 000 $ US | 41 309 000 $ US |
| 2015 | 5 852 000 $ US | 14 974 000 $ US |
| 2014 | 9 913 000 $ US | 3 169 000 $ US |
| 2013 | 4 110 000 $ US | 13 683 000 $ US |
| 2012 | 3 747 000 $ US | 45 695 000 $ US |
| 2011 | 5 508 000 $ US | 3 383 000 $ US |
| 2010 | 3 501 000 $ US | 22 120 000 $ US |
| 2009 | 2 033 000 $ US | 37 871 000 $ US |
| 2008 | 1 455 000 $ US | 2 613 000 $ US |
| 2007 | 141 000 $ US | 17 741 000 $ US |
| 2006 | 78 000 $ US | 25 389 000 $ US |
| 2005 | 78 000 $ US | 60 483 000 $ US |
| 2004 | 168 000 $ US | 5 263 000 $ US |
| 2003 | 812 000 $ US | 5 149 000 $ US |
| 2002 | 179 000 $ US | 3 389 000 $ US |
| 2001 | 501 000 $ US | 3 299 000 $ US |
Les exportations de biens du Togo vers le Cameroun, selon le Togo, s'élevaient à 11,6 millions de dollars, et celles du Cameroun vers le Togo, selon le Cameroun, à 3,02 millions de dollars : 3,8 fois plus pour celles du Togo. En 2001, elles s'élevaient à 501 000 dollars pour le Togo et à 3,3 millions de dollars pour le Cameroun.
Togo vs Cameroun : chiffres des exportations
|
Togo
|
Cameroun
|
|
|---|---|---|
| Exportations | 2,60 Md $US (2024) | 7,71 Md $US (2025) |
| Rang mondial | 148/176 | 119/176 |
| Part mondiale | 0,008 % | 0,02 % |
| % du PIB | 24,4 % | 13,1 % |
| Première catégorie de biens | Pétrole, gaz, minerais et autres matières premières (31,4 %, 2025) | Pétrole, gaz, minerais et autres matières premières (45,8 %, 2024) |
| Première destination des biens | Inde (19,4 %, 2025) | Pays-Bas (19,2 %, 2024) |
Comparer les exportations de 2 pays au choix
Sources :
- Banque mondiale | Économie et croissance (1963–2025, mis à jour en octobre 2026)
- TradeMap (2001–2025, mis à jour en octobre 2026)
Creative Commons Attribution (CC BY) : vous pouvez copier, partager, adapter et réutiliser ce contenu, y compris à des fins commerciales, à condition de citer statistics.wiki et d’indiquer les modifications apportées. Les sources citées ci-dessus peuvent avoir leurs propres conditions de licence.