
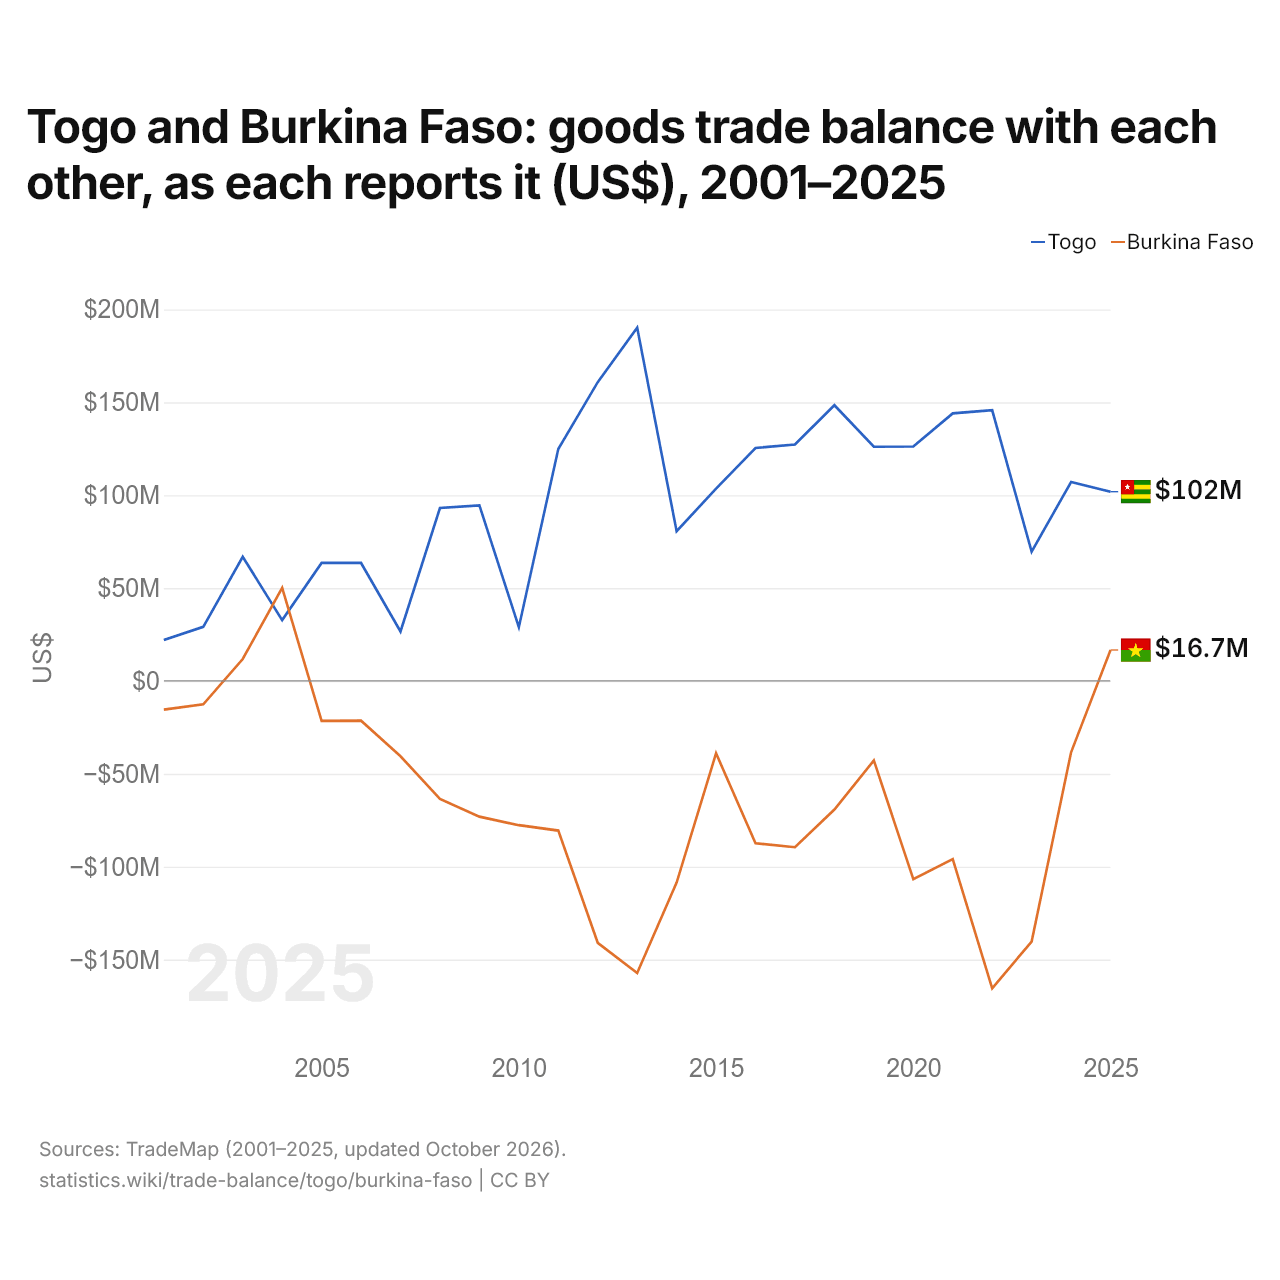
Le Togo et le Burkina Faso : solde de leur commerce de biens bilatéral, selon chacun ($ US), 2001–2025
| Année | $ US | |
|---|---|---|
| Togo | Burkina Faso | |
| 2025 | 101 891 000 $ US | 16 655 000 $ US |
| 2024 | 107 133 000 $ US | −38 392 000 $ US |
| 2023 | 69 587 000 $ US | −140 269 000 $ US |
| 2022 | 145 730 000 $ US | −165 461 000 $ US |
| 2021 | 144 055 000 $ US | −95 914 000 $ US |
| 2020 | 126 212 000 $ US | −106 666 000 $ US |
| 2019 | 126 071 000 $ US | −42 794 000 $ US |
| 2018 | 148 448 000 $ US | −69 198 000 $ US |
| 2017 | 127 306 000 $ US | −89 513 000 $ US |
| 2016 | 125 394 000 $ US | −87 372 000 $ US |
| 2015 | 103 564 000 $ US | −38 957 000 $ US |
| 2014 | 80 598 000 $ US | −108 522 000 $ US |
| 2013 | 190 178 000 $ US | −157 225 000 $ US |
| 2012 | 160 866 000 $ US | −140 962 000 $ US |
| 2011 | 124 897 000 $ US | −80 546 000 $ US |
| 2010 | 28 943 000 $ US | −77 646 000 $ US |
| 2009 | 94 540 000 $ US | −73 040 000 $ US |
| 2008 | 93 125 000 $ US | −63 513 000 $ US |
| 2007 | 26 634 000 $ US | −40 524 000 $ US |
| 2006 | 63 532 000 $ US | −21 378 000 $ US |
| 2005 | 63 532 000 $ US | −21 477 000 $ US |
| 2004 | 32 748 000 $ US | 50 106 000 $ US |
| 2003 | 66 877 000 $ US | 11 806 000 $ US |
| 2002 | 29 129 000 $ US | −12 565 000 $ US |
| 2001 | 21 997 000 $ US | −15 428 000 $ US |
En 2025, selon le Togo, son commerce de biens avec le Burkina Faso affichait un excédent de 102 millions de dollars ; selon le Burkina Faso, son commerce de biens avec le Togo affichait un excédent de 16,7 millions de dollars. En 2001, les chiffres étaient un excédent de 22 millions de dollars pour le Togo et un déficit de 15,4 millions de dollars pour le Burkina Faso.
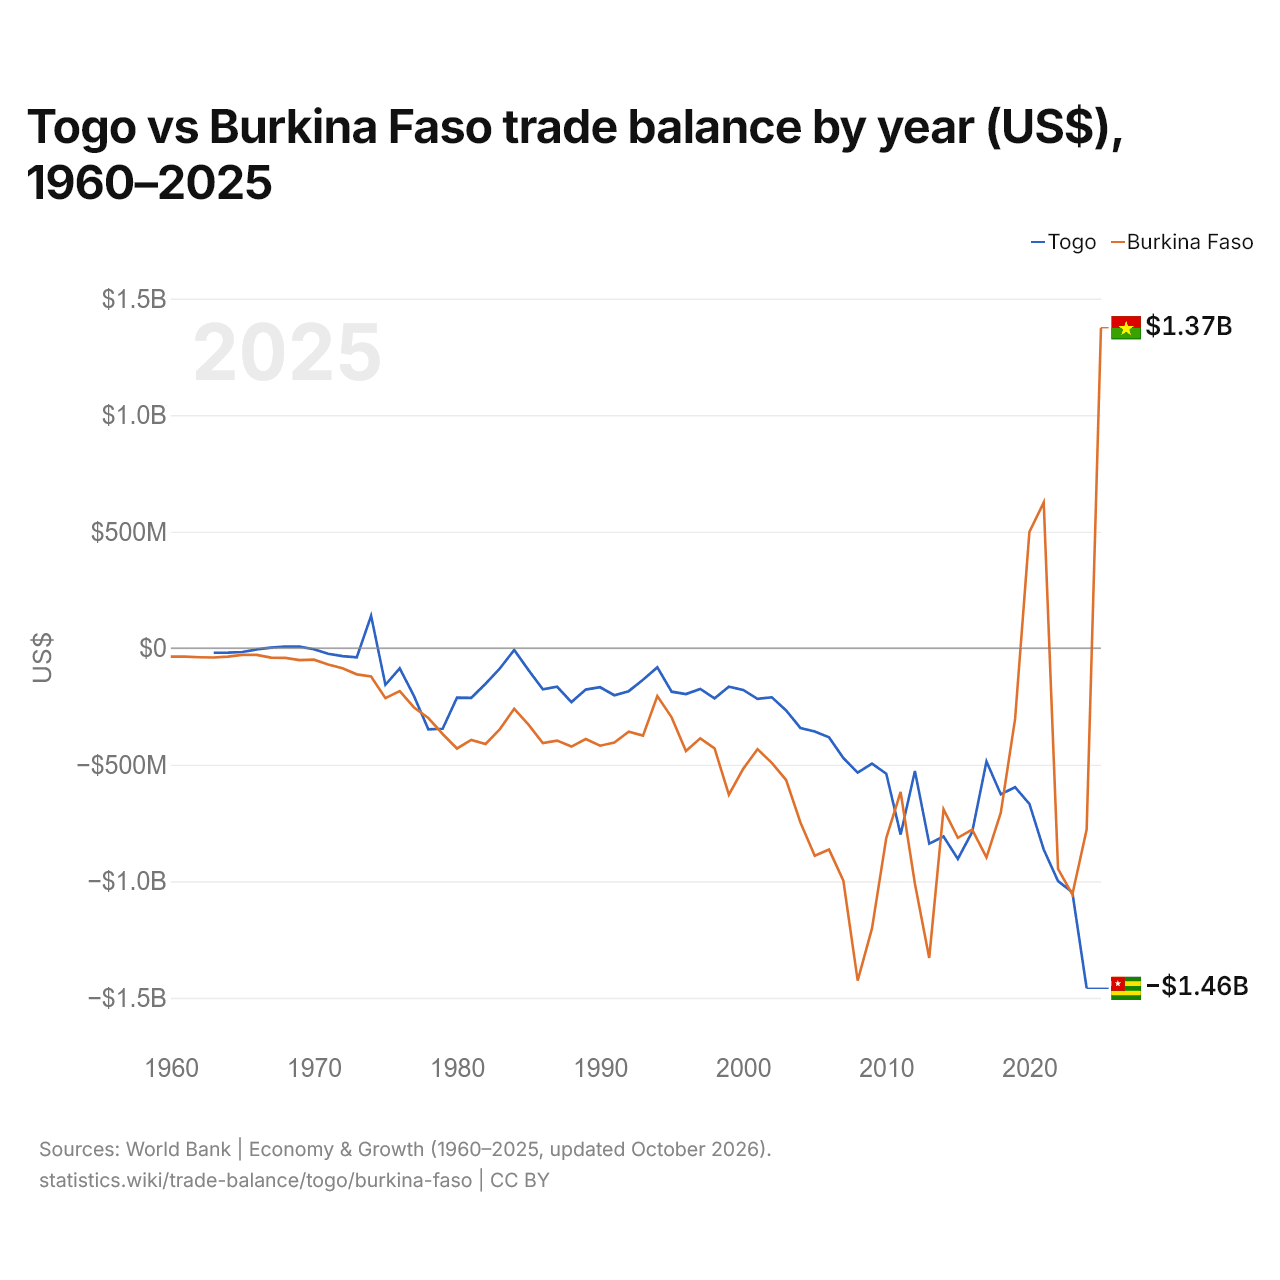
Togo vs Burkina Faso : balance commerciale par année ($ US), 1960–2025
| Année | $ US | |
|---|---|---|
 Togo |
 Burkina Faso |
|
| 2025 | - | 1 374 969 029 $ US |
| 2024 | −1 458 991 923 $ US | −778 304 322 $ US |
| 2023 | −1 046 720 513 $ US | −1 056 411 279 $ US |
| 2022 | −999 242 175 $ US | −946 790 589 $ US |
| 2021 | −863 474 324 $ US | 625 157 481 $ US |
| 2020 | −668 160 790 $ US | 498 773 420 $ US |
| 2019 | −596 247 540 $ US | −303 549 508 $ US |
| 2018 | −626 559 041 $ US | −705 171 478 $ US |
| 2017 | −485 744 805 $ US | −897 767 915 $ US |
| 2016 | −788 161 617 $ US | −777 861 344 $ US |
| 2015 | −904 002 749 $ US | −813 329 644 $ US |
| 2014 | −807 977 879 $ US | −691 511 437 $ US |
| 2013 | −838 559 051 $ US | −1 328 549 694 $ US |
| 2012 | −526 999 628 $ US | −1 010 211 749 $ US |
| 2011 | −799 431 509 $ US | −616 850 363 $ US |
| 2010 | −538 553 133 $ US | −812 969 199 $ US |
| 2009 | −495 214 240 $ US | −1 201 943 593 $ US |
| 2008 | −533 645 691 $ US | −1 425 906 209 $ US |
| 2007 | −471 120 173 $ US | −997 645 321 $ US |
| 2006 | −382 484 470 $ US | −863 789 007 $ US |
| 2005 | −357 277 737 $ US | −890 512 831 $ US |
| 2004 | −342 211 069 $ US | −747 850 040 $ US |
| 2003 | −266 850 191 $ US | −565 449 104 $ US |
| 2002 | −210 489 485 $ US | −491 980 036 $ US |
| 2001 | −217 202 587 $ US | −432 933 524 $ US |
| 2000 | −178 970 129 $ US | −517 491 007 $ US |
| 1999 | −165 418 891 $ US | −628 656 321 $ US |
| 1998 | −215 086 072 $ US | −429 811 389 $ US |
| 1997 | −174 557 318 $ US | −386 520 161 $ US |
| 1996 | −196 858 456 $ US | −441 086 733 $ US |
| 1995 | −186 521 935 $ US | −296 639 238 $ US |
| 1994 | −82 192 917 $ US | −205 183 784 $ US |
| 1993 | −135 238 578 $ US | −375 049 581 $ US |
| 1992 | −184 284 413 $ US | −358 530 194 $ US |
| 1991 | −201 621 961 $ US | −404 456 605 $ US |
| 1990 | −167 419 233 $ US | −418 342 762 $ US |
| 1989 | −177 517 346 $ US | −389 645 014 $ US |
| 1988 | −231 056 754 $ US | −422 027 025 $ US |
| 1987 | −165 402 312 $ US | −396 291 211 $ US |
| 1986 | −176 165 176 $ US | −406 865 693 $ US |
| 1985 | −93 986 789 $ US | −327 647 752 $ US |
| 1984 | −7 756 559 $ US | −259 813 092 $ US |
| 1983 | −86 728 710 $ US | −347 100 405 $ US |
| 1982 | −152 302 303 $ US | −411 038 169 $ US |
| 1981 | −212 808 834 $ US | −393 503 629 $ US |
| 1980 | −212 048 502 $ US | −430 335 724 $ US |
| 1979 | −345 615 402 $ US | −367 815 791 $ US |
| 1978 | −347 727 998 $ US | −299 283 926 $ US |
| 1977 | −205 529 887 $ US | −254 333 290 $ US |
| 1976 | −86 633 909 $ US | −183 620 078 $ US |
| 1975 | −156 961 473 $ US | −214 340 679 $ US |
| 1974 | 139 275 877 $ US | −121 324 218 $ US |
| 1973 | −38 734 392 $ US | −112 064 648 $ US |
| 1972 | −34 092 200 $ US | −86 148 664 $ US |
| 1971 | −23 715 655 $ US | −69 561 866 $ US |
| 1970 | −4 379 907 $ US | −48 987 510 $ US |
| 1969 | 6 518 824 $ US | −51 250 565 $ US |
| 1968 | 7 415 677 $ US | −41 820 410 $ US |
| 1967 | 2 296 252 $ US | −40 562 448 $ US |
| 1966 | −5 173 349 $ US | −28 622 656 $ US |
| 1965 | −16 417 583 $ US | −28 437 027 $ US |
| 1964 | −18 936 817 $ US | −35 778 420 $ US |
| 1963 | −19 356 425 $ US | −39 756 801 $ US |
| 1962 | - | −38 617 085 $ US |
| 1961 | - | −36 289 432 $ US |
| 1960 | - | −36 274 159 $ US |
La balance commerciale du Togo affichait un déficit de 1,46 milliard de dollars (2024) et celle du Burkina Faso un déficit de 778 millions de dollars (2024) ; le déficit du Togo était 1,9 fois plus grand. En 1963, la balance commerciale du Togo affichait un déficit de 19,4 millions de dollars et celle du Burkina Faso un déficit de 39,8 millions de dollars.
Depuis 1963, la balance commerciale du Togo a été excédentaire pendant 4 des 62 années, et celle du Burkina Faso pendant 2. Les balances commerciales du Togo et du Burkina Faso ont été déficitaires en même temps pendant 56 de ces années, dont la dernière.
Togo vs Burkina Faso : chiffres de la balance commerciale
|
Togo
|
Burkina Faso
|
|
|---|---|---|
| Biens et services, $ US | −1,46 Md $US (2024) | +1,37 Md $US (2025) |
| % du PIB | −13,7 % (2024) | +5,0 % (2025) |
| Années d'excédent depuis 2000 | 0 sur 25 | 3 sur 26 |
| Solde des biens entre les deux, chiffres propres | +102 M $US (2025) | +16,7 M $US (2025) |
| Premier excédent en biens avec | Côte d’Ivoire (+168 M $US, 2025) | Émirats arabes unis (+5,69 Md $US, 2025) |
| Premier déficit en biens avec | Chine (−872 M $US, 2025) | Chine (−1,46 Md $US, 2025) |
Comparer la balance commerciale de 2 pays au choix
Sources :
- Banque mondiale | Économie et croissance (1960–2025, mis à jour en octobre 2026)
- TradeMap (2001–2025, mis à jour en octobre 2026)
Creative Commons Attribution (CC BY) : vous pouvez copier, partager, adapter et réutiliser ce contenu, y compris à des fins commerciales, à condition de citer statistics.wiki et d’indiquer les modifications apportées. Les sources citées ci-dessus peuvent avoir leurs propres conditions de licence.