
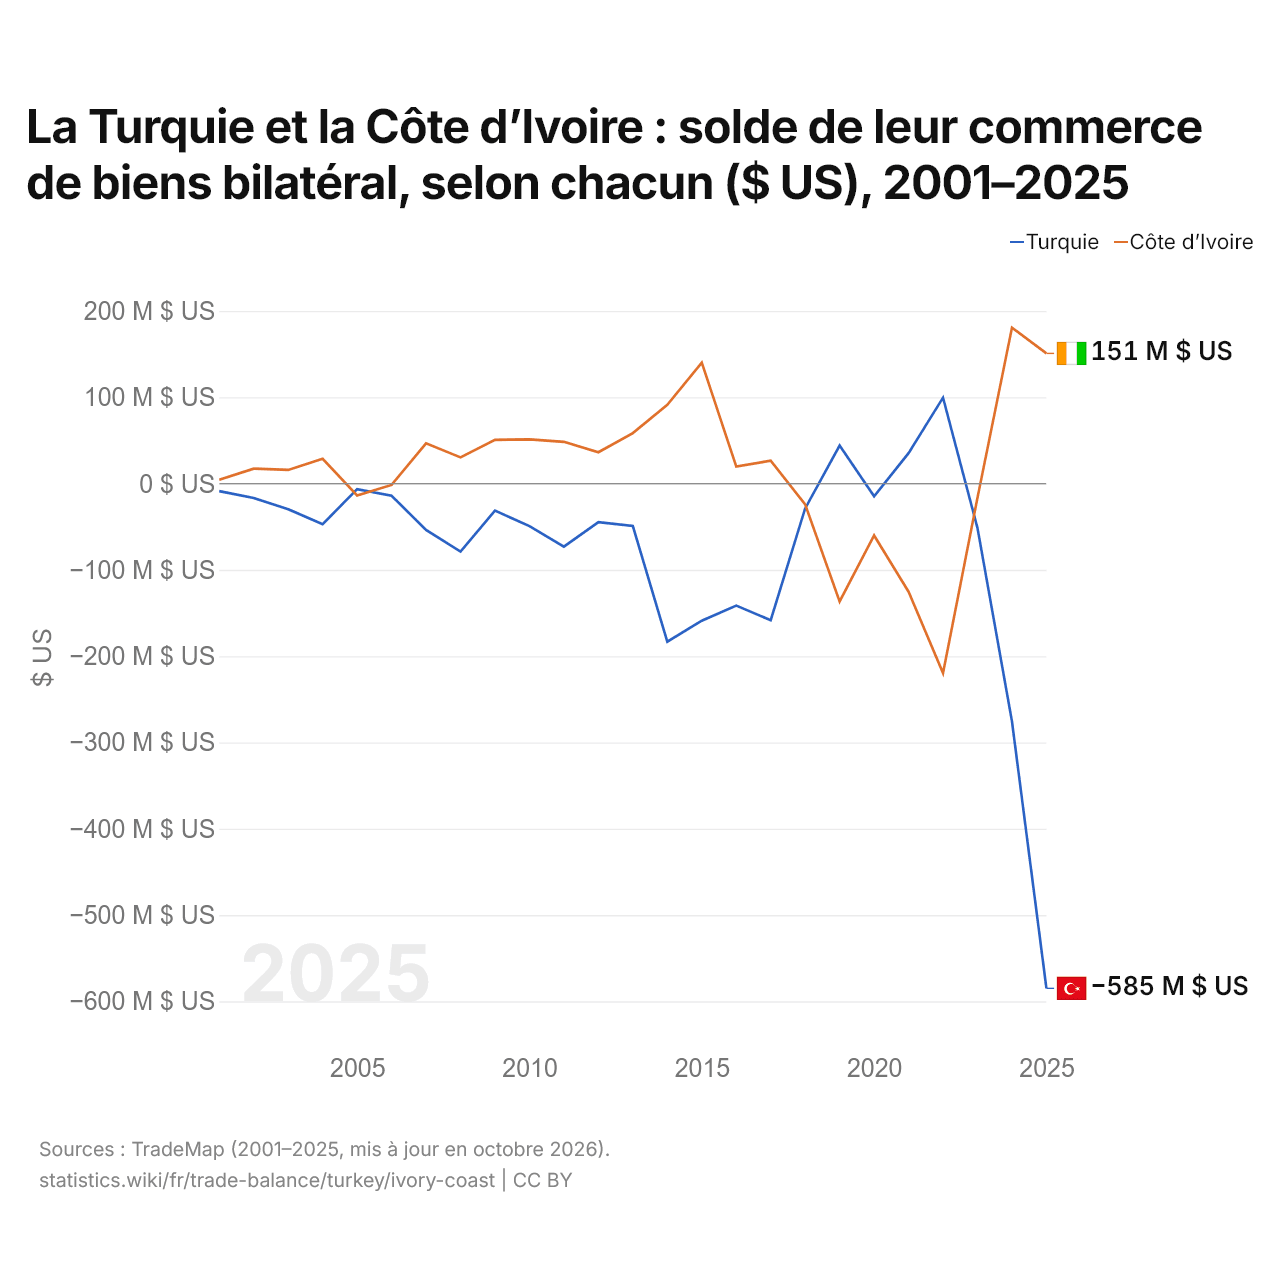
La Turquie et la Côte d’Ivoire : solde de leur commerce de biens bilatéral, selon chacun ($ US), 2001–2025
| Année | $ US | |
|---|---|---|
| Turquie | Côte d’Ivoire | |
| 2025 | −584 865 000 $ US | 150 846 000 $ US |
| 2024 | −275 396 000 $ US | 180 630 000 $ US |
| 2023 | −51 551 000 $ US | −16 351 000 $ US |
| 2022 | 99 622 000 $ US | −219 653 000 $ US |
| 2021 | 35 229 000 $ US | −125 301 000 $ US |
| 2020 | −14 732 000 $ US | −60 098 000 $ US |
| 2019 | 44 071 000 $ US | −136 619 000 $ US |
| 2018 | −28 807 000 $ US | −24 143 000 $ US |
| 2017 | −158 351 000 $ US | 26 541 000 $ US |
| 2016 | −141 425 000 $ US | 19 824 000 $ US |
| 2015 | −158 852 000 $ US | 140 096 000 $ US |
| 2014 | −183 233 000 $ US | 91 319 000 $ US |
| 2013 | −49 178 000 $ US | 58 414 000 $ US |
| 2012 | −44 726 000 $ US | 36 290 000 $ US |
| 2011 | −73 147 000 $ US | 48 379 000 $ US |
| 2010 | −49 289 000 $ US | 51 129 000 $ US |
| 2009 | −31 321 000 $ US | 50 714 000 $ US |
| 2008 | −78 821 000 $ US | 30 362 000 $ US |
| 2007 | −53 694 000 $ US | 46 610 000 $ US |
| 2006 | −14 122 000 $ US | −1 566 000 $ US |
| 2005 | −6 462 000 $ US | −13 711 000 $ US |
| 2004 | −47 040 000 $ US | 28 714 000 $ US |
| 2003 | −29 662 000 $ US | 15 849 000 $ US |
| 2002 | −16 760 000 $ US | 17 296 000 $ US |
| 2001 | −8 694 000 $ US | 4 338 000 $ US |
En 2025, selon la Turquie, son commerce de biens avec la Côte d’Ivoire affichait un déficit de 585 millions de dollars ; selon la Côte d’Ivoire, son commerce de biens avec la Turquie affichait un excédent de 151 millions de dollars. En 2001, les chiffres étaient un déficit de 8,69 millions de dollars pour la Turquie et un excédent de 4,34 millions de dollars pour la Côte d’Ivoire.
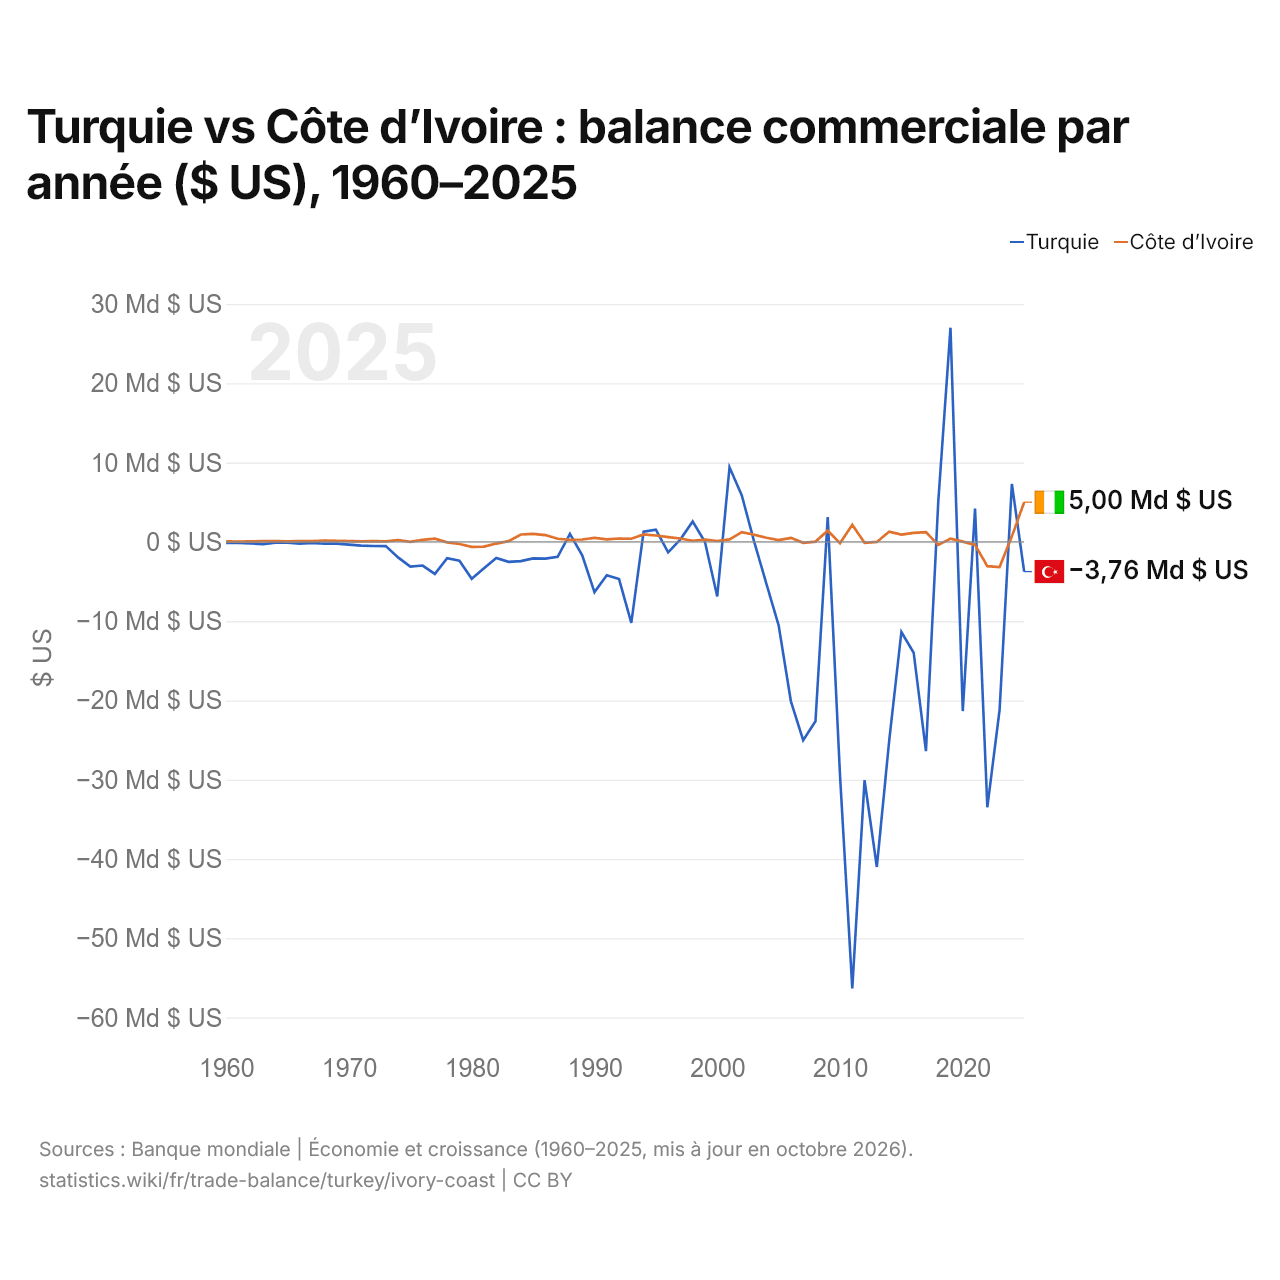
Turquie vs Côte d’Ivoire : balance commerciale par année ($ US), 1960–2025
| Année | $ US | |
|---|---|---|
 Turquie |
 Côte d’Ivoire |
|
| 2025 | −3 755 785 561 $ US | 5 001 533 084 $ US |
| 2024 | 7 307 197 101 $ US | 689 098 069 $ US |
| 2023 | −21 181 731 331 $ US | −3 187 854 323 $ US |
| 2022 | −33 486 302 440 $ US | −3 072 143 001 $ US |
| 2021 | 4 185 993 617 $ US | −379 621 921 $ US |
| 2020 | −21 347 440 639 $ US | 27 924 584 $ US |
| 2019 | 27 009 801 864 $ US | 398 869 444 $ US |
| 2018 | 4 971 181 455 $ US | −379 874 598 $ US |
| 2017 | −26 405 711 552 $ US | 1 226 197 749 $ US |
| 2016 | −13 983 412 331 $ US | 1 122 162 840 $ US |
| 2015 | −11 366 572 353 $ US | 914 200 449 $ US |
| 2014 | −25 180 591 325 $ US | 1 286 280 537 $ US |
| 2013 | −41 005 981 821 $ US | −13 629 371 $ US |
| 2012 | −30 066 833 315 $ US | −122 015 134 $ US |
| 2011 | −56 314 976 402 $ US | 2 145 426 099 $ US |
| 2010 | −29 450 676 482 $ US | −165 525 048 $ US |
| 2009 | 3 116 333 325 $ US | 1 407 176 644 $ US |
| 2008 | −22 630 468 482 $ US | 29 551 575 $ US |
| 2007 | −25 026 651 296 $ US | −129 143 421 $ US |
| 2006 | −20 116 184 782 $ US | 503 475 150 $ US |
| 2005 | −10 528 378 745 $ US | 225 231 796 $ US |
| 2004 | −5 268 792 743 $ US | 508 835 024 $ US |
| 2003 | 66 756 414 $ US | 897 241 871 $ US |
| 2002 | 5 845 228 386 $ US | 1 231 376 583 $ US |
| 2001 | 9 400 731 322 $ US | 306 880 479 $ US |
| 2000 | −6 890 257 814 $ US | 102 138 413 $ US |
| 1999 | −12 805 916 $ US | 298 433 532 $ US |
| 1998 | 2 572 582 501 $ US | 140 294 992 $ US |
| 1997 | 308 677 444 $ US | 418 272 325 $ US |
| 1996 | −1 330 688 533 $ US | 597 310 044 $ US |
| 1995 | 1 537 801 287 $ US | 804 798 798 $ US |
| 1994 | 1 278 297 139 $ US | 932 626 995 $ US |
| 1993 | −10 228 639 053 $ US | 390 620 488 $ US |
| 1992 | −4 698 195 576 $ US | 423 133 527 $ US |
| 1991 | −4 219 534 995 $ US | 317 468 262 $ US |
| 1990 | −6 346 799 540 $ US | 494 261 432 $ US |
| 1989 | −1 690 292 177 $ US | 290 588 103 $ US |
| 1988 | 1 000 632 911 $ US | 266 427 821 $ US |
| 1987 | −1 897 782 964 $ US | 384 312 612 $ US |
| 1986 | −2 110 962 963 $ US | 853 046 354 $ US |
| 1985 | −2 087 931 034 $ US | 1 003 198 621 $ US |
| 1984 | −2 437 602 180 $ US | 925 034 590 $ US |
| 1983 | −2 524 444 444 $ US | 84 762 231 $ US |
| 1982 | −2 029 447 853 $ US | −219 715 929 $ US |
| 1981 | −3 322 522 523 $ US | −599 489 001 $ US |
| 1980 | −4 656 578 947 $ US | −628 551 057 $ US |
| 1979 | −2 387 096 774 $ US | −279 708 272 $ US |
| 1978 | −2 070 833 333 $ US | −72 233 812 $ US |
| 1977 | −4 044 444 444 $ US | 394 416 093 $ US |
| 1976 | −2 987 500 000 $ US | 256 120 028 $ US |
| 1975 | −3 135 714 286 $ US | 5 599 275 $ US |
| 1974 | −1 964 285 714 $ US | 224 756 758 $ US |
| 1973 | −535 714 286 $ US | 63 260 158 $ US |
| 1972 | −521 428 571 $ US | 83 324 180 $ US |
| 1971 | −473 333 333 $ US | 59 922 294 $ US |
| 1970 | −345 454 545 $ US | 96 959 815 $ US |
| 1969 | −222 222 222 $ US | 131 943 093 $ US |
| 1968 | −244 444 444 $ US | 162 785 614 $ US |
| 1967 | −133 333 333 $ US | 80 487 491 $ US |
| 1966 | −222 222 222 $ US | 78 964 840 $ US |
| 1965 | −100 000 000 $ US | 61 617 237 $ US |
| 1964 | −111 111 111 $ US | 102 820 694 $ US |
| 1963 | −288 888 889 $ US | 79 267 524 $ US |
| 1962 | −211 111 111 $ US | 55 789 331 $ US |
| 1961 | −133 333 333 $ US | 44 445 573 $ US |
| 1960 | −122 222 222 $ US | 61 912 319 $ US |
En 2025, la balance commerciale de la Turquie affichait un déficit de 3,76 milliards de dollars et celle de la Côte d’Ivoire un excédent de 5 milliards de dollars. En 1960, la balance commerciale de la Turquie affichait un déficit de 122 millions de dollars et celle de la Côte d’Ivoire un excédent de 61,9 millions de dollars.
De 1960 à 2025, la balance commerciale de la Turquie a été excédentaire pendant 13 des 66 années, et celle de la Côte d’Ivoire pendant 53. Les balances commerciales de la Turquie et de la Côte d’Ivoire ont été déficitaires en même temps pendant 11 de ces années, la dernière fois en 2023.
Turquie vs Côte d’Ivoire : chiffres de la balance commerciale
|
Turquie
|
Côte d’Ivoire
|
|
|---|---|---|
| Biens et services, $ US | −3,76 Md $US (2025) | +5,00 Md $US (2025) |
| % du PIB | −0,2 % (2025) | +5,0 % (2025) |
| Années d'excédent depuis 2000 | 8 sur 26 | 18 sur 26 |
| Solde des biens entre les deux, chiffres propres | −585 M $US (2025) | +151 M $US (2025) |
| Premier excédent en biens avec | Irak (+10,4 Md $US, 2025) | Suisse (+4,21 Md $US, 2025) |
| Premier déficit en biens avec | Chine (−46,3 Md $US, 2025) | Chine (−2,74 Md $US, 2025) |
Comparer la balance commerciale de 2 pays au choix
Sources :
- Banque mondiale | Économie et croissance (1960–2025, mis à jour en octobre 2026)
- TradeMap (2001–2025, mis à jour en octobre 2026)
Creative Commons Attribution (CC BY) : vous pouvez copier, partager, adapter et réutiliser ce contenu, y compris à des fins commerciales, à condition de citer statistics.wiki et d’indiquer les modifications apportées. Les sources citées ci-dessus peuvent avoir leurs propres conditions de licence.