
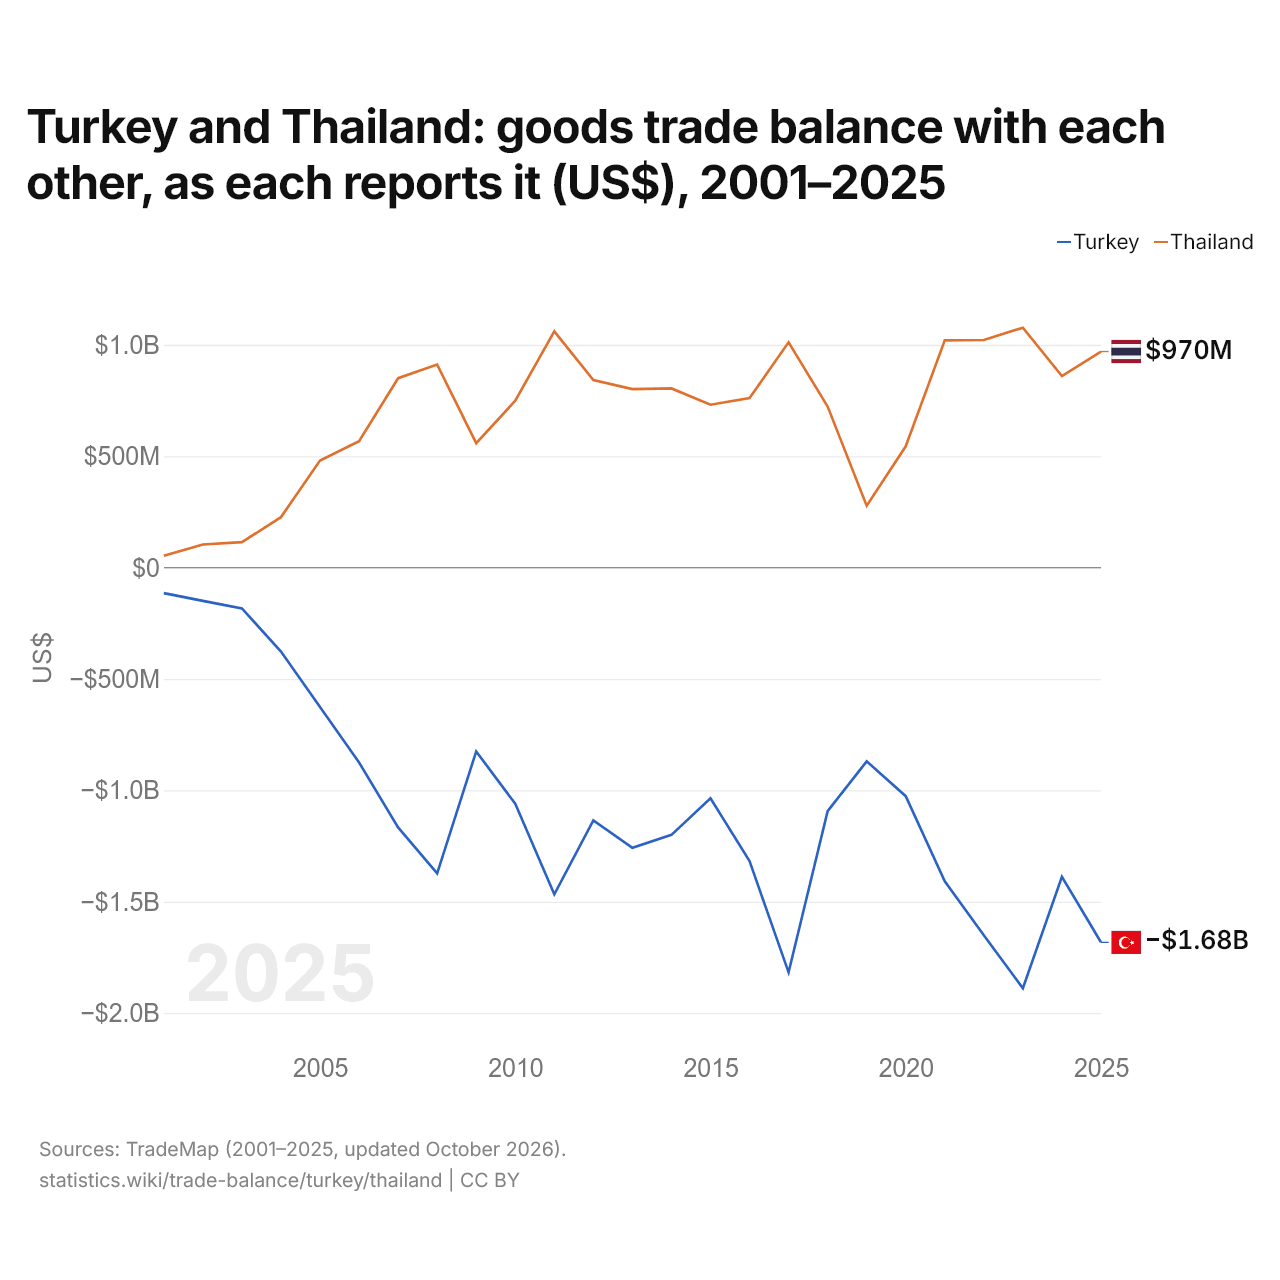
La Turquie et la Thaïlande : solde de leur commerce de biens bilatéral, selon chacun ($ US), 2001–2025
| Année | $ US | |
|---|---|---|
| Turquie | Thaïlande | |
| 2025 | −1 682 683 000 $ US | 969 795 000 $ US |
| 2024 | −1 388 049 000 $ US | 859 757 000 $ US |
| 2023 | −1 889 121 000 $ US | 1 076 954 000 $ US |
| 2022 | −1 651 108 000 $ US | 1 021 818 000 $ US |
| 2021 | −1 408 489 000 $ US | 1 020 330 000 $ US |
| 2020 | −1 026 564 000 $ US | 544 440 000 $ US |
| 2019 | −870 113 000 $ US | 277 382 000 $ US |
| 2018 | −1 093 946 000 $ US | 723 080 000 $ US |
| 2017 | −1 817 469 000 $ US | 1 011 329 000 $ US |
| 2016 | −1 318 148 000 $ US | 760 878 000 $ US |
| 2015 | −1 035 686 000 $ US | 731 182 000 $ US |
| 2014 | −1 200 328 000 $ US | 804 254 000 $ US |
| 2013 | −1 258 214 000 $ US | 800 918 000 $ US |
| 2012 | −1 135 600 000 $ US | 841 589 000 $ US |
| 2011 | −1 467 114 000 $ US | 1 060 694 000 $ US |
| 2010 | −1 060 619 000 $ US | 748 775 000 $ US |
| 2009 | −825 557 000 $ US | 558 398 000 $ US |
| 2008 | −1 373 105 000 $ US | 911 522 000 $ US |
| 2007 | −1 166 423 000 $ US | 850 369 000 $ US |
| 2006 | −875 275 000 $ US | 567 784 000 $ US |
| 2005 | −626 308 000 $ US | 480 536 000 $ US |
| 2004 | −376 888 000 $ US | 226 412 000 $ US |
| 2003 | −183 454 000 $ US | 113 835 000 $ US |
| 2002 | −149 740 000 $ US | 103 671 000 $ US |
| 2001 | −114 987 000 $ US | 52 867 000 $ US |
En 2025, selon la Turquie, son commerce de biens avec la Thaïlande affichait un déficit de 1,68 milliard de dollars ; selon la Thaïlande, son commerce de biens avec la Turquie affichait un excédent de 970 millions de dollars. En 2001, les chiffres étaient un déficit de 115 millions de dollars pour la Turquie et un excédent de 52,9 millions de dollars pour la Thaïlande.
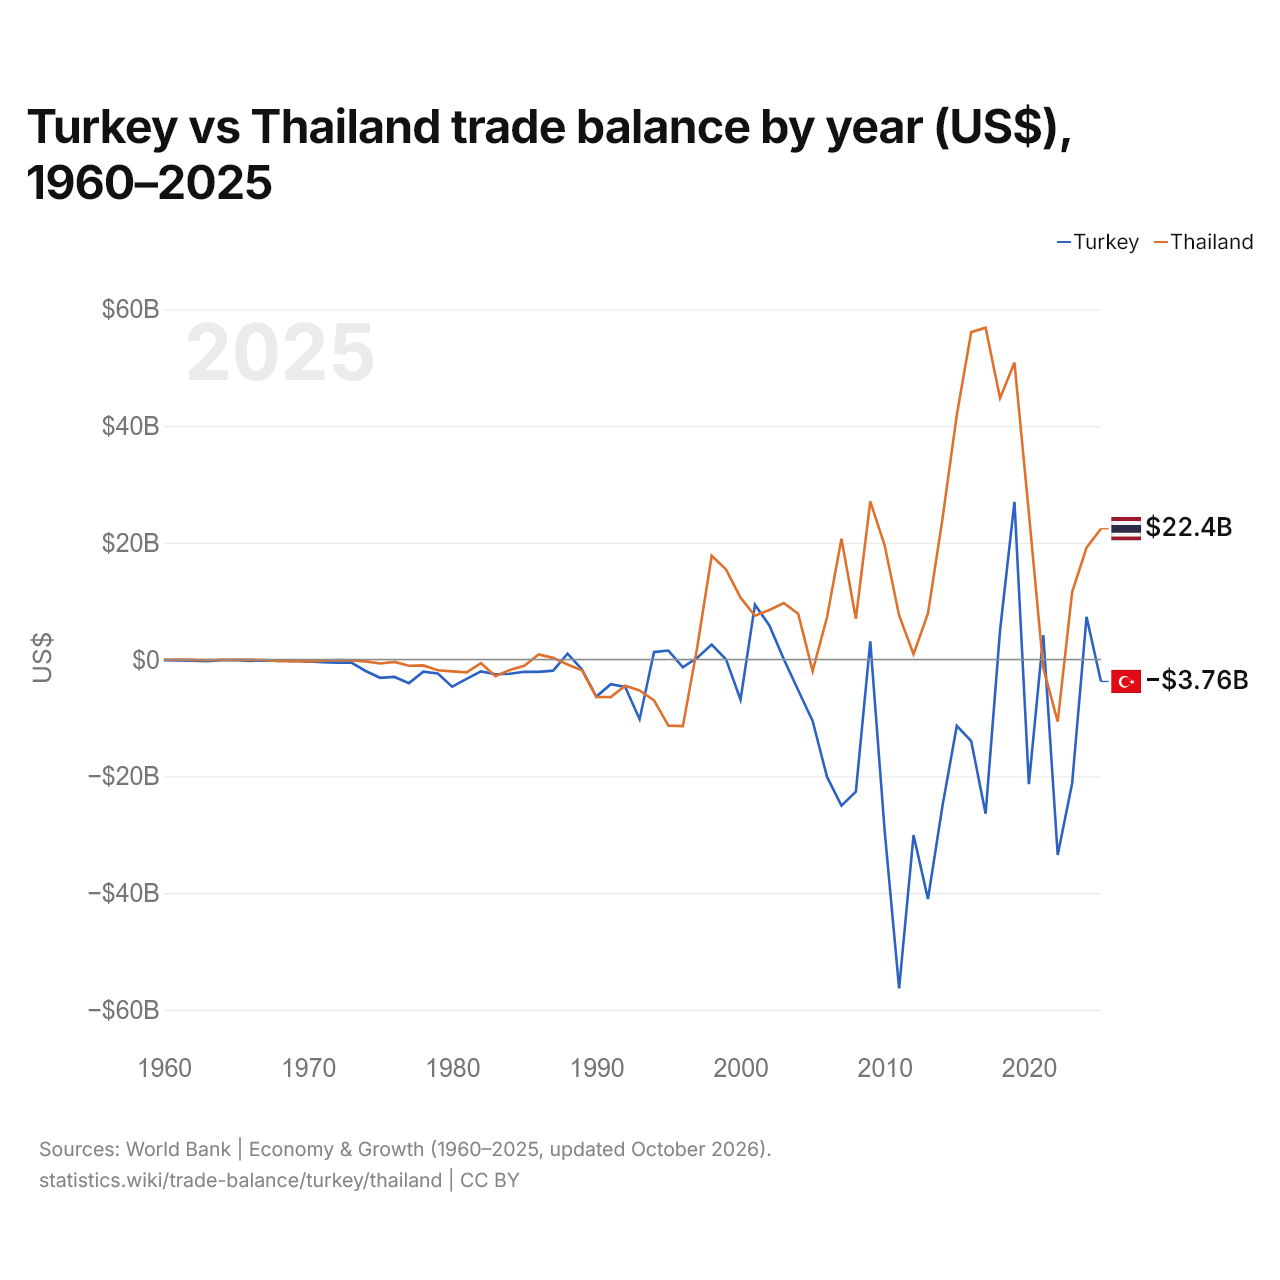
Turquie vs Thaïlande : balance commerciale par année ($ US), 1960–2025
| Année | $ US | |
|---|---|---|
 Turquie |
 Thaïlande |
|
| 2025 | −3 755 785 561 $ US | 22 402 465 677 $ US |
| 2024 | 7 307 197 101 $ US | 19 165 463 094 $ US |
| 2023 | −21 181 731 331 $ US | 11 554 301 943 $ US |
| 2022 | −33 486 302 440 $ US | −10 636 527 116 $ US |
| 2021 | 4 185 993 617 $ US | −1 463 735 306 $ US |
| 2020 | −21 347 440 639 $ US | 25 089 768 146 $ US |
| 2019 | 27 009 801 864 $ US | 50 852 391 002 $ US |
| 2018 | 4 971 181 455 $ US | 44 768 334 335 $ US |
| 2017 | −26 405 711 552 $ US | 56 835 761 401 $ US |
| 2016 | −13 983 412 331 $ US | 56 079 513 870 $ US |
| 2015 | −11 366 572 353 $ US | 41 870 119 401 $ US |
| 2014 | −25 180 591 325 $ US | 23 962 838 725 $ US |
| 2013 | −41 005 981 821 $ US | 7 902 306 215 $ US |
| 2012 | −30 066 833 315 $ US | 904 575 388 $ US |
| 2011 | −56 314 976 402 $ US | 7 543 979 216 $ US |
| 2010 | −29 450 676 482 $ US | 19 517 413 294 $ US |
| 2009 | 3 116 333 325 $ US | 27 066 211 193 $ US |
| 2008 | −22 630 468 482 $ US | 6 981 025 387 $ US |
| 2007 | −25 026 651 296 $ US | 20 697 063 962 $ US |
| 2006 | −20 116 184 782 $ US | 7 237 609 499 $ US |
| 2005 | −10 528 378 745 $ US | −1 984 876 727 $ US |
| 2004 | −5 268 792 743 $ US | 7 835 357 474 $ US |
| 2003 | 66 756 414 $ US | 9 673 296 490 $ US |
| 2002 | 5 845 228 386 $ US | 8 490 183 783 $ US |
| 2001 | 9 400 731 322 $ US | 7 498 576 473 $ US |
| 2000 | −6 890 257 814 $ US | 10 594 886 498 $ US |
| 1999 | −12 805 916 $ US | 15 416 652 651 $ US |
| 1998 | 2 572 582 501 $ US | 17 772 192 804 $ US |
| 1997 | 308 677 444 $ US | 2 136 056 834 $ US |
| 1996 | −1 330 688 533 $ US | −11 416 470 782 $ US |
| 1995 | 1 537 801 287 $ US | −11 327 272 984 $ US |
| 1994 | 1 278 297 139 $ US | −6 989 078 945 $ US |
| 1993 | −10 228 639 053 $ US | −5 299 331 021 $ US |
| 1992 | −4 698 195 576 $ US | −4 468 914 487 $ US |
| 1991 | −4 219 534 995 $ US | −6 427 021 889 $ US |
| 1990 | −6 346 799 540 $ US | −6 416 534 515 $ US |
| 1989 | −1 690 292 177 $ US | −1 852 420 621 $ US |
| 1988 | 1 000 632 911 $ US | −856 887 188 $ US |
| 1987 | −1 897 782 964 $ US | 283 017 445 $ US |
| 1986 | −2 110 962 963 $ US | 876 044 811 $ US |
| 1985 | −2 087 931 034 $ US | −1 061 199 599 $ US |
| 1984 | −2 437 602 180 $ US | −1 783 296 331 $ US |
| 1983 | −2 524 444 444 $ US | −2 867 898 579 $ US |
| 1982 | −2 029 447 853 $ US | −626 605 535 $ US |
| 1981 | −3 322 522 523 $ US | −2 186 206 760 $ US |
| 1980 | −4 656 578 947 $ US | −2 024 090 911 $ US |
| 1979 | −2 387 096 774 $ US | −1 840 938 235 $ US |
| 1978 | −2 070 833 333 $ US | −1 014 894 545 $ US |
| 1977 | −4 044 444 444 $ US | −1 071 906 353 $ US |
| 1976 | −2 987 500 000 $ US | −419 507 686 $ US |
| 1975 | −3 135 714 286 $ US | −686 383 795 $ US |
| 1974 | −1 964 285 714 $ US | −324 268 299 $ US |
| 1973 | −535 714 286 $ US | −156 454 352 $ US |
| 1972 | −521 428 571 $ US | −81 346 040 $ US |
| 1971 | −473 333 333 $ US | −208 269 231 $ US |
| 1970 | −345 454 545 $ US | −309 086 538 $ US |
| 1969 | −222 222 222 $ US | −267 740 385 $ US |
| 1968 | −244 444 444 $ US | −227 596 154 $ US |
| 1967 | −133 333 333 $ US | −115 576 923 $ US |
| 1966 | −222 222 222 $ US | −17 500 000 $ US |
| 1965 | −100 000 000 $ US | −52 932 692 $ US |
| 1964 | −111 111 111 $ US | −55 240 385 $ US |
| 1963 | −288 888 889 $ US | −114 738 358 $ US |
| 1962 | −211 111 111 $ US | −64 942 529 $ US |
| 1961 | −133 333 333 $ US | 6 838 113 $ US |
| 1960 | −122 222 222 $ US | −35 077 326 $ US |
En 2025, la balance commerciale de la Turquie affichait un déficit de 3,76 milliards de dollars et celle de la Thaïlande un excédent de 22,4 milliards de dollars. En 1960, la balance commerciale de la Turquie affichait un déficit de 122 millions de dollars et celle de la Thaïlande un déficit de 35,1 millions de dollars.
De 1960 à 2025, la balance commerciale de la Turquie a été excédentaire pendant 13 des 66 années, et celle de la Thaïlande pendant 29. Les balances commerciales de la Turquie et de la Thaïlande ont été déficitaires en même temps pendant 33 de ces années, la dernière fois en 2022.
Turquie vs Thaïlande : chiffres de la balance commerciale
|
Turquie
|
Thaïlande
|
|
|---|---|---|
| Biens et services, $ US | −3,76 Md $US (2025) | +22,4 Md $US (2025) |
| % du PIB | −0,2 % (2025) | +3,9 % (2025) |
| Années d'excédent depuis 2000 | 8 sur 26 | 23 sur 26 |
| Solde des biens entre les deux, chiffres propres | −1,68 Md $US (2025) | +970 M $US (2025) |
| Premier excédent en biens avec | Irak (+10,4 Md $US, 2025) | États-Unis (+50,6 Md $US, 2025) |
| Premier déficit en biens avec | Chine (−46,3 Md $US, 2025) | Chine (−69,2 Md $US, 2025) |
Comparer la balance commerciale de 2 pays au choix
Sources :
- Banque mondiale | Économie et croissance (1960–2025, mis à jour en octobre 2026)
- TradeMap (2001–2025, mis à jour en octobre 2026)
Creative Commons Attribution (CC BY) : vous pouvez copier, partager, adapter et réutiliser ce contenu, y compris à des fins commerciales, à condition de citer statistics.wiki et d’indiquer les modifications apportées. Les sources citées ci-dessus peuvent avoir leurs propres conditions de licence.