
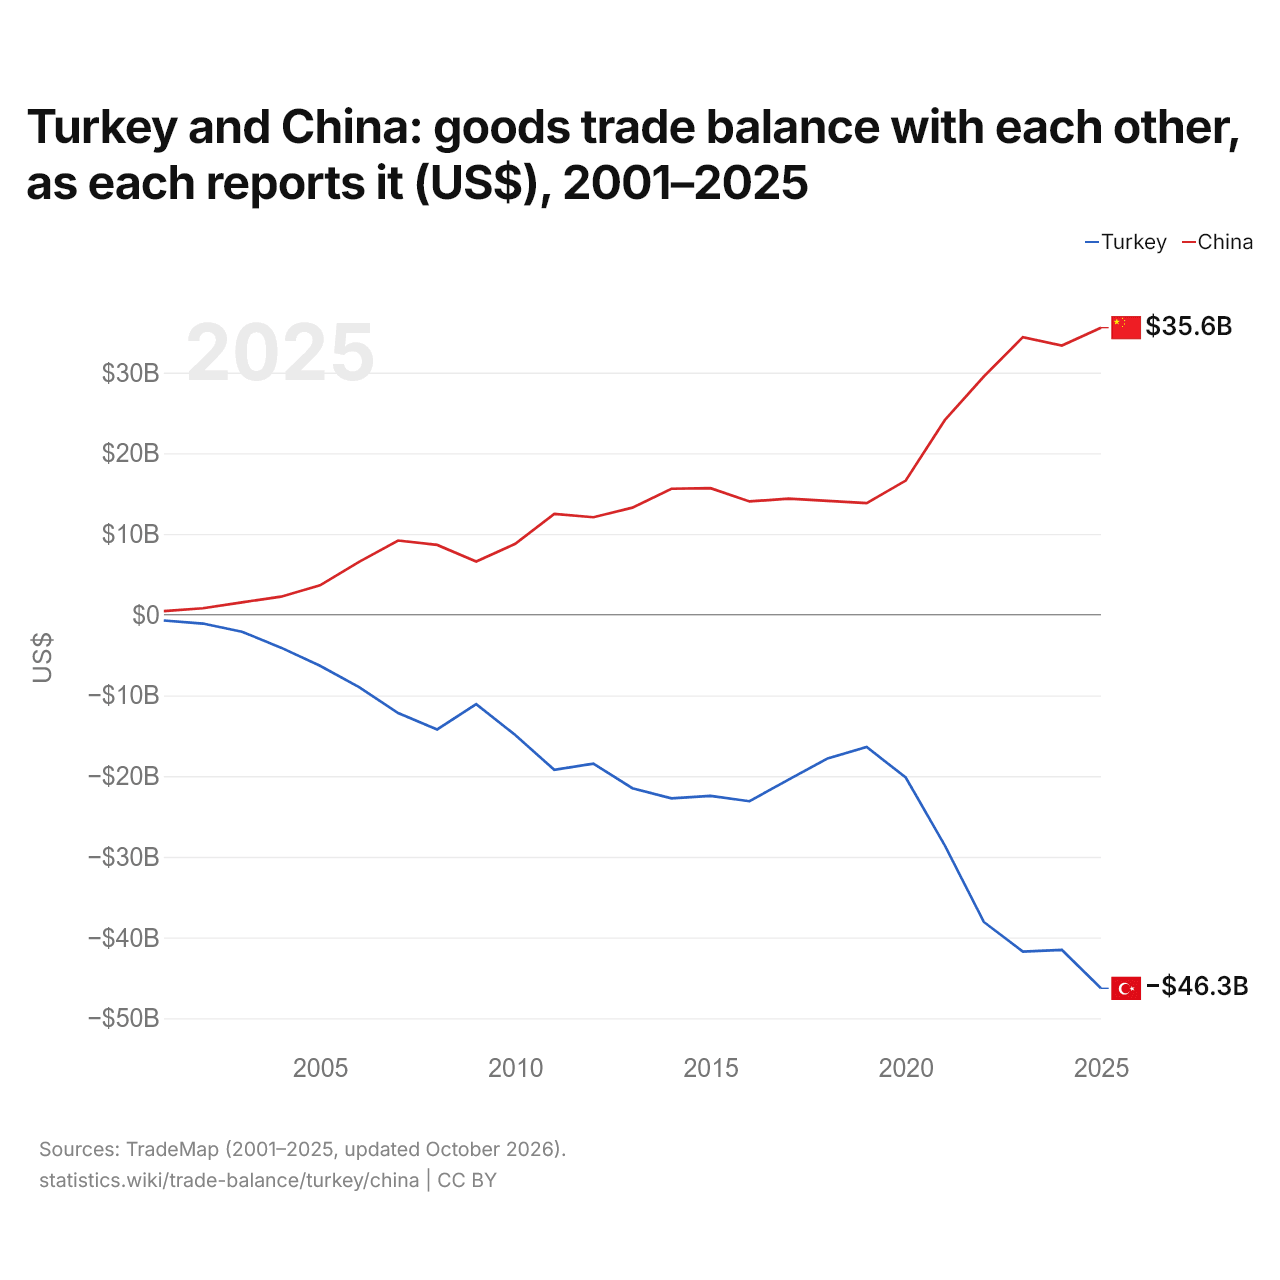
La Turquie et la Chine : solde de leur commerce de biens bilatéral, selon chacun ($ US), 2001–2025
| Année | $ US | |
|---|---|---|
| Turquie | Chine | |
| 2025 | −46 292 812 000 $ US | 35 556 984 000 $ US |
| 2024 | −41 542 121 000 $ US | 33 351 042 000 $ US |
| 2023 | −41 741 884 000 $ US | 34 387 090 000 $ US |
| 2022 | −38 072 812 000 $ US | 29 513 419 000 $ US |
| 2021 | −28 576 388 000 $ US | 24 104 376 000 $ US |
| 2020 | −20 174 423 000 $ US | 16 615 393 000 $ US |
| 2019 | −16 401 401 000 $ US | 13 826 885 000 $ US |
| 2018 | −17 806 522 000 $ US | 14 101 487 000 $ US |
| 2017 | −20 434 358 000 $ US | 14 371 252 000 $ US |
| 2016 | −23 111 083 000 $ US | 14 032 048 000 $ US |
| 2015 | −22 458 667 000 $ US | 15 670 535 000 $ US |
| 2014 | −22 762 232 000 $ US | 15 600 062 000 $ US |
| 2013 | −21 505 102 000 $ US | 13 260 757 000 $ US |
| 2012 | −18 461 987 000 $ US | 12 073 483 000 $ US |
| 2011 | −19 227 020 000 $ US | 12 490 477 000 $ US |
| 2010 | −14 911 631 000 $ US | 8 777 978 000 $ US |
| 2009 | −11 076 277 000 $ US | 6 588 050 000 $ US |
| 2008 | −14 221 006 000 $ US | 8 643 379 000 $ US |
| 2007 | −12 194 569 000 $ US | 9 190 465 000 $ US |
| 2006 | −8 976 062 000 $ US | 6 537 333 000 $ US |
| 2005 | −6 335 400 000 $ US | 3 631 982 000 $ US |
| 2004 | −4 084 491 000 $ US | 2 229 911 000 $ US |
| 2003 | −2 105 672 000 $ US | 1 532 468 000 $ US |
| 2002 | −1 100 085 000 $ US | 800 258 000 $ US |
| 2001 | −726 247 000 $ US | 443 069 000 $ US |
En 2025, selon la Turquie, son commerce de biens avec la Chine affichait un déficit de 46,3 milliards de dollars ; selon la Chine, son commerce de biens avec la Turquie affichait un excédent de 35,6 milliards de dollars. En 2001, les chiffres étaient un déficit de 726 millions de dollars pour la Turquie et un excédent de 443 millions de dollars pour la Chine.
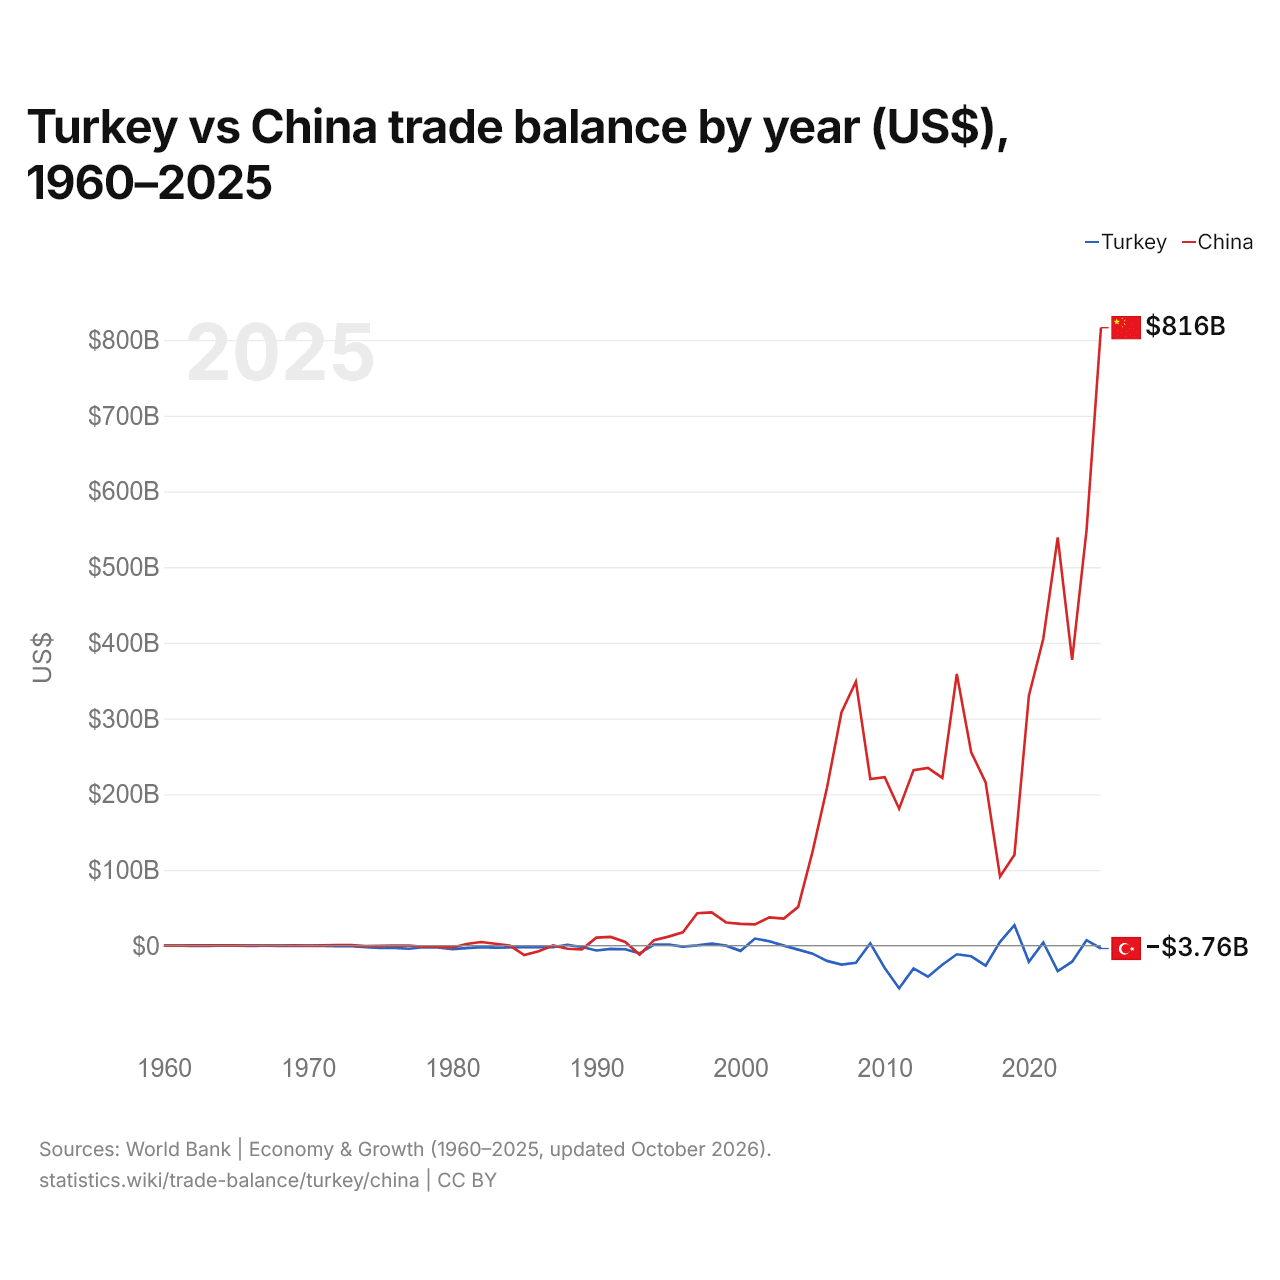
Turquie vs Chine : balance commerciale par année ($ US), 1960–2025
| Année | $ US | |
|---|---|---|
 Turquie |
 Chine |
|
| 2025 | −3 755 785 561 $ US | 816 189 653 994 $ US |
| 2024 | 7 307 197 101 $ US | 548 703 728 924 $ US |
| 2023 | −21 181 731 331 $ US | 377 368 486 355 $ US |
| 2022 | −33 486 302 440 $ US | 539 054 406 264 $ US |
| 2021 | 4 185 993 617 $ US | 405 394 120 058 $ US |
| 2020 | −21 347 440 639 $ US | 330 134 703 664 $ US |
| 2019 | 27 009 801 864 $ US | 120 151 888 640 $ US |
| 2018 | 4 971 181 455 $ US | 91 487 265 093 $ US |
| 2017 | −26 405 711 552 $ US | 215 697 133 466 $ US |
| 2016 | −13 983 412 331 $ US | 255 484 319 295 $ US |
| 2015 | −11 366 572 353 $ US | 358 836 357 206 $ US |
| 2014 | −25 180 591 325 $ US | 221 549 605 872 $ US |
| 2013 | −41 005 981 821 $ US | 234 872 118 182 $ US |
| 2012 | −30 066 833 315 $ US | 231 864 021 797 $ US |
| 2011 | −56 314 976 402 $ US | 180 895 321 770 $ US |
| 2010 | −29 450 676 482 $ US | 222 400 893 687 $ US |
| 2009 | 3 116 333 325 $ US | 220 130 401 367 $ US |
| 2008 | −22 630 468 482 $ US | 348 832 533 154 $ US |
| 2007 | −25 026 651 296 $ US | 308 036 028 783 $ US |
| 2006 | −20 116 184 782 $ US | 208 918 924 501 $ US |
| 2005 | −10 528 378 745 $ US | 124 626 797 517 $ US |
| 2004 | −5 268 792 743 $ US | 51 174 382 540 $ US |
| 2003 | 66 756 414 $ US | 35 821 129 066 $ US |
| 2002 | 5 845 228 386 $ US | 37 382 671 264 $ US |
| 2001 | 9 400 731 322 $ US | 28 086 220 298 $ US |
| 2000 | −6 890 257 814 $ US | 28 785 851 579 $ US |
| 1999 | −12 805 916 $ US | 30 640 955 367 $ US |
| 1998 | 2 572 582 501 $ US | 43 836 689 480 $ US |
| 1997 | 308 677 444 $ US | 42 823 220 000 $ US |
| 1996 | −1 330 688 533 $ US | 17 550 000 000 $ US |
| 1995 | 1 537 801 287 $ US | 11 958 000 000 $ US |
| 1994 | 1 278 297 139 $ US | 7 357 000 000 $ US |
| 1993 | −10 228 639 053 $ US | −11 792 000 000 $ US |
| 1992 | −4 698 195 576 $ US | 4 998 000 000 $ US |
| 1991 | −4 219 534 995 $ US | 11 601 000 000 $ US |
| 1990 | −6 346 799 540 $ US | 10 668 000 000 $ US |
| 1989 | −1 690 292 177 $ US | −4 928 000 000 $ US |
| 1988 | 1 000 632 911 $ US | −4 061 000 000 $ US |
| 1987 | −1 897 782 964 $ US | 291 000 000 $ US |
| 1986 | −2 110 962 963 $ US | −7 390 000 000 $ US |
| 1985 | −2 087 931 034 $ US | −12 501 000 000 $ US |
| 1984 | −2 437 602 180 $ US | 54 000 000 $ US |
| 1983 | −2 524 444 444 $ US | 2 571 000 000 $ US |
| 1982 | −2 029 447 853 $ US | 4 812 000 000 $ US |
| 1981 | −3 322 522 523 $ US | 2 150 220 000 $ US |
| 1980 | −4 656 578 947 $ US | −2 436 990 000 $ US |
| 1979 | −2 387 096 774 $ US | −1 572 643 000 $ US |
| 1978 | −2 070 833 333 $ US | −1 460 560 000 $ US |
| 1977 | −4 044 444 444 $ US | 210 672 000 $ US |
| 1976 | −2 987 500 000 $ US | 90 791 000 $ US |
| 1975 | −3 135 714 286 $ US | −380 480 000 $ US |
| 1974 | −1 964 285 714 $ US | −503 131 000 $ US |
| 1973 | −535 714 286 $ US | 701 488 000 $ US |
| 1972 | −521 428 571 $ US | 620 760 000 $ US |
| 1971 | −473 333 333 $ US | 477 289 000 $ US |
| 1970 | −345 454 545 $ US | 72 660 000 $ US |
| 1969 | −222 222 222 $ US | 483 200 000 $ US |
| 1968 | −244 444 444 $ US | 269 480 000 $ US |
| 1967 | −133 333 333 $ US | 236 020 000 $ US |
| 1966 | −222 222 222 $ US | 185 300 000 $ US |
| 1965 | −100 000 000 $ US | 330 180 000 $ US |
| 1964 | −111 111 111 $ US | 457 760 000 $ US |
| 1963 | −288 888 889 $ US | 455 680 000 $ US |
| 1962 | −211 111 111 $ US | 377 650 000 $ US |
| 1961 | −133 333 333 $ US | 97 520 000 $ US |
| 1960 | −122 222 222 $ US | −7 530 000 $ US |
En 2025, la balance commerciale de la Turquie affichait un déficit de 3,76 milliards de dollars et celle de la Chine un excédent de 816 milliards de dollars. En 1960, la balance commerciale de la Turquie affichait un déficit de 122 millions de dollars et celle de la Chine un déficit de 7,53 millions de dollars.
De 1960 à 2025, la balance commerciale de la Turquie a été excédentaire pendant 13 des 66 années, et celle de la Chine pendant 55. Les balances commerciales de la Turquie et de la Chine ont été déficitaires en même temps pendant 10 de ces années, la dernière fois en 1993.
Turquie vs Chine : chiffres de la balance commerciale
|
Turquie
|
Chine
|
|
|---|---|---|
| Biens et services, $ US | −3,76 Md $US (2025) | +816 Md $US (2025) |
| % du PIB | −0,2 % (2025) | +4,2 % (2025) |
| Années d'excédent depuis 2000 | 8 sur 26 | 26 sur 26 |
| Solde des biens entre les deux, chiffres propres | −46,3 Md $US (2025) | +35,6 Md $US (2025) |
| Premier excédent en biens avec | Irak (+10,4 Md $US, 2025) | États-Unis (+280 Md $US, 2025) |
| Premier déficit en biens avec | Chine (−46,3 Md $US, 2025) | Australie (−51,6 Md $US, 2025) |
Comparer la balance commerciale de 2 pays au choix
Sources :
- Banque mondiale | Économie et croissance (1960–2025, mis à jour en octobre 2026)
- TradeMap (2001–2025, mis à jour en octobre 2026)
Creative Commons Attribution (CC BY) : vous pouvez copier, partager, adapter et réutiliser ce contenu, y compris à des fins commerciales, à condition de citer statistics.wiki et d’indiquer les modifications apportées. Les sources citées ci-dessus peuvent avoir leurs propres conditions de licence.