
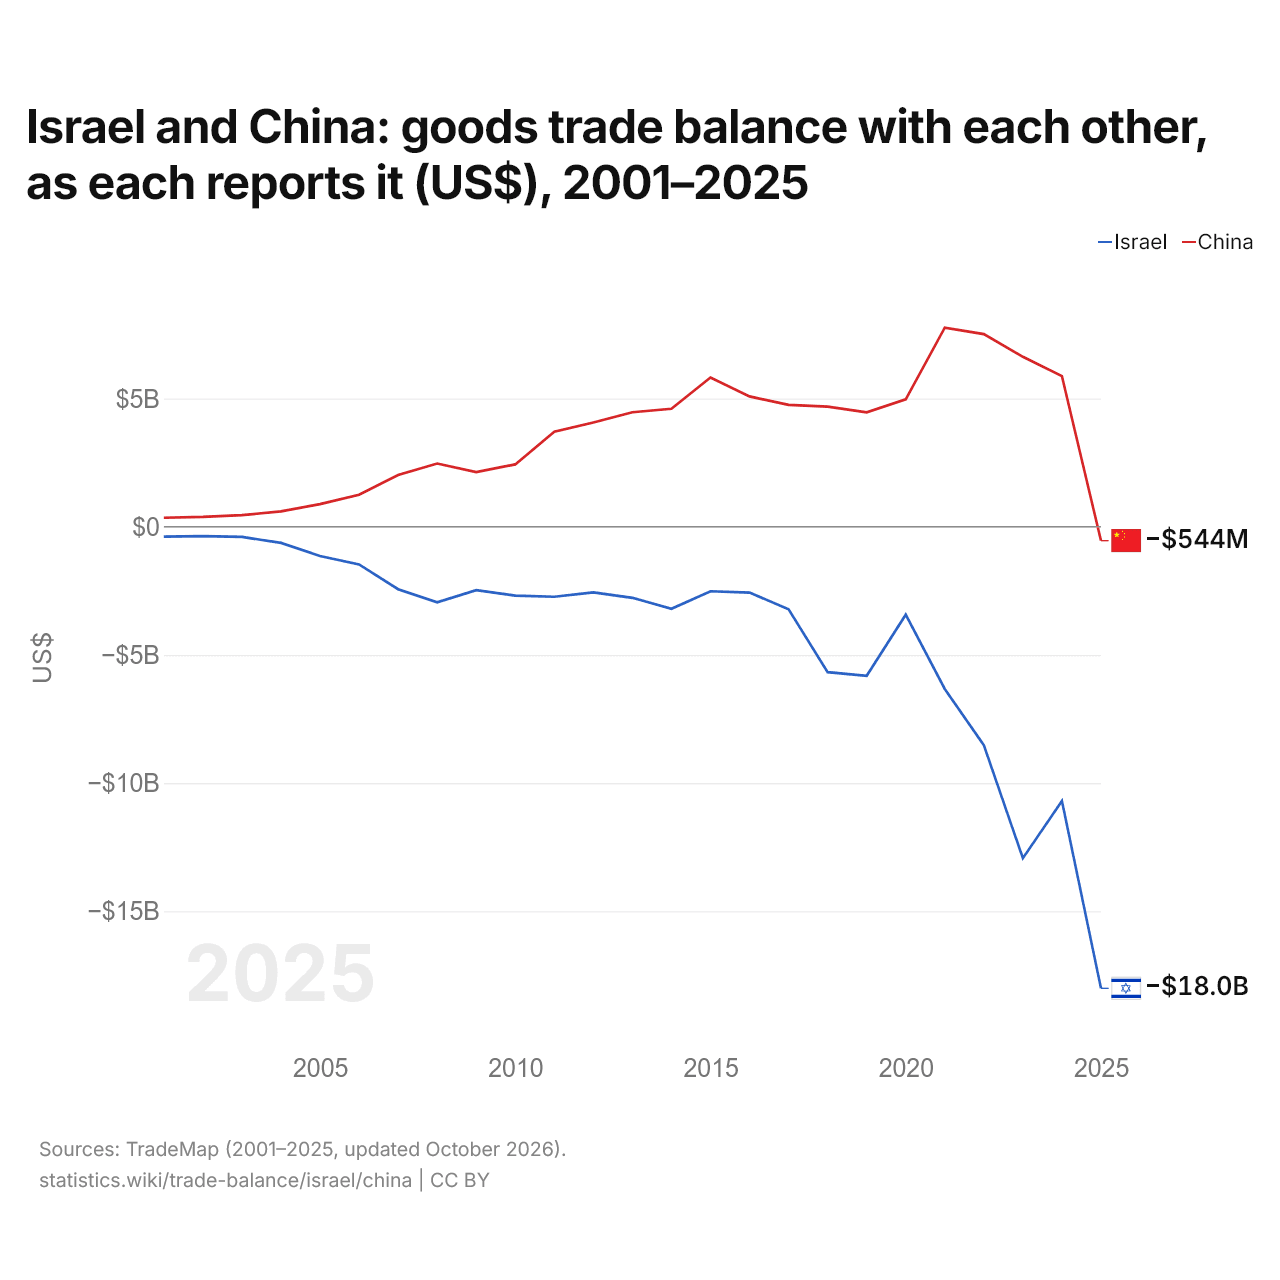
Israël et la Chine : solde de leur commerce de biens bilatéral, selon chacun ($ US), 2001–2025
| Année | $ US | |
|---|---|---|
| Israël | Chine | |
| 2025 | −18 004 611 000 $ US | −543 724 000 $ US |
| 2024 | −10 697 976 000 $ US | 5 875 556 000 $ US |
| 2023 | −12 929 336 000 $ US | 6 628 120 000 $ US |
| 2022 | −8 519 493 000 $ US | 7 514 210 000 $ US |
| 2021 | −6 329 652 000 $ US | 7 763 040 000 $ US |
| 2020 | −3 429 481 000 $ US | 4 967 981 000 $ US |
| 2019 | −5 813 012 000 $ US | 4 460 779 000 $ US |
| 2018 | −5 671 584 000 $ US | 4 684 410 000 $ US |
| 2017 | −3 217 462 000 $ US | 4 752 196 000 $ US |
| 2016 | −2 568 520 000 $ US | 5 083 468 000 $ US |
| 2015 | −2 516 648 000 $ US | 5 820 310 000 $ US |
| 2014 | −3 201 247 000 $ US | 4 598 469 000 $ US |
| 2013 | −2 774 071 000 $ US | 4 463 987 000 $ US |
| 2012 | −2 564 244 000 $ US | 4 065 306 000 $ US |
| 2011 | −2 732 312 000 $ US | 3 703 093 000 $ US |
| 2010 | −2 690 016 000 $ US | 2 429 659 000 $ US |
| 2009 | −2 476 317 000 $ US | 2 128 530 000 $ US |
| 2008 | −2 950 619 000 $ US | 2 464 179 000 $ US |
| 2007 | −2 436 218 000 $ US | 2 019 454 000 $ US |
| 2006 | −1 469 180 000 $ US | 1 246 910 000 $ US |
| 2005 | −1 140 260 000 $ US | 880 795 000 $ US |
| 2004 | −631 485 000 $ US | 599 123 000 $ US |
| 2003 | −395 506 000 $ US | 450 499 000 $ US |
| 2002 | −366 734 000 $ US | 381 793 000 $ US |
| 2001 | −387 730 000 $ US | 349 372 000 $ US |
En 2025, selon Israël, son commerce de biens avec la Chine affichait un déficit de 18 milliards de dollars ; selon la Chine, son commerce de biens avec Israël affichait un déficit de 544 millions de dollars. En 2001, les chiffres étaient un déficit de 388 millions de dollars pour Israël et un excédent de 349 millions de dollars pour la Chine.
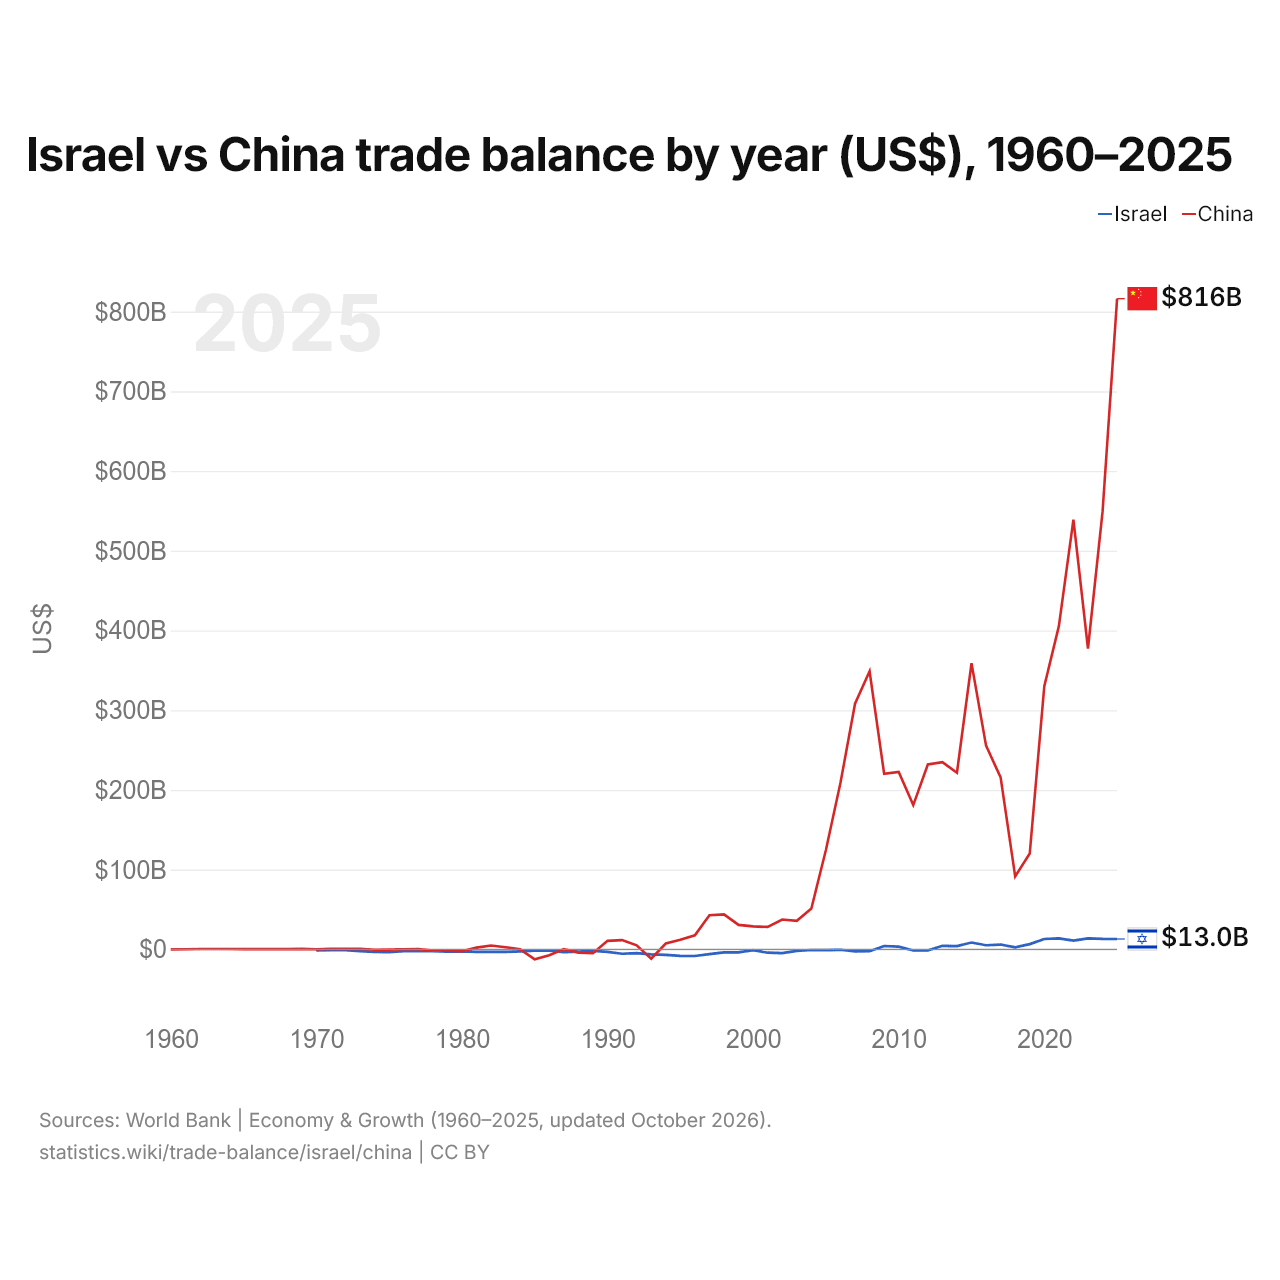
Israël vs Chine : balance commerciale par année ($ US), 1960–2025
| Année | $ US | |
|---|---|---|
 Israël |
 Chine |
|
| 2025 | 12 994 365 505 $ US | 816 189 653 994 $ US |
| 2024 | 13 100 279 099 $ US | 548 703 728 924 $ US |
| 2023 | 13 754 663 733 $ US | 377 368 486 355 $ US |
| 2022 | 11 000 808 302 $ US | 539 054 406 264 $ US |
| 2021 | 13 804 496 055 $ US | 405 394 120 058 $ US |
| 2020 | 13 021 165 408 $ US | 330 134 703 664 $ US |
| 2019 | 6 557 503 906 $ US | 120 151 888 640 $ US |
| 2018 | 2 413 018 727 $ US | 91 487 265 093 $ US |
| 2017 | 6 004 796 901 $ US | 215 697 133 466 $ US |
| 2016 | 5 128 475 225 $ US | 255 484 319 295 $ US |
| 2015 | 8 575 319 326 $ US | 358 836 357 206 $ US |
| 2014 | 3 984 226 053 $ US | 221 549 605 872 $ US |
| 2013 | 4 406 103 796 $ US | 234 872 118 182 $ US |
| 2012 | −1 392 248 402 $ US | 231 864 021 797 $ US |
| 2011 | −1 462 187 515 $ US | 180 895 321 770 $ US |
| 2010 | 3 412 251 219 $ US | 222 400 893 687 $ US |
| 2009 | 4 198 677 110 $ US | 220 130 401 367 $ US |
| 2008 | −2 287 048 495 $ US | 348 832 533 154 $ US |
| 2007 | −2 539 773 861 $ US | 308 036 028 783 $ US |
| 2006 | −575 153 283 $ US | 208 918 924 501 $ US |
| 2005 | −1 009 500 635 $ US | 124 626 797 517 $ US |
| 2004 | −793 186 301 $ US | 51 174 382 540 $ US |
| 2003 | −1 975 804 879 $ US | 35 821 129 066 $ US |
| 2002 | −4 669 753 894 $ US | 37 382 671 264 $ US |
| 2001 | −4 222 578 168 $ US | 28 086 220 298 $ US |
| 2000 | −1 098 518 628 $ US | 28 785 851 579 $ US |
| 1999 | −3 810 722 999 $ US | 30 640 955 367 $ US |
| 1998 | −3 730 624 984 $ US | 43 836 689 480 $ US |
| 1997 | −5 975 502 116 $ US | 42 823 220 000 $ US |
| 1996 | −8 351 877 056 $ US | 17 550 000 000 $ US |
| 1995 | −8 115 948 262 $ US | 11 958 000 000 $ US |
| 1994 | −6 867 235 894 $ US | 7 357 000 000 $ US |
| 1993 | −6 232 770 220 $ US | −11 792 000 000 $ US |
| 1992 | −4 720 523 362 $ US | 4 998 000 000 $ US |
| 1991 | −5 509 077 267 $ US | 11 601 000 000 $ US |
| 1990 | −3 103 552 723 $ US | 10 668 000 000 $ US |
| 1989 | −2 010 870 382 $ US | −4 928 000 000 $ US |
| 1988 | −2 800 375 258 $ US | −4 061 000 000 $ US |
| 1987 | −3 498 185 125 $ US | 291 000 000 $ US |
| 1986 | −1 649 481 113 $ US | −7 390 000 000 $ US |
| 1985 | −1 698 280 601 $ US | −12 501 000 000 $ US |
| 1984 | −2 488 666 439 $ US | 54 000 000 $ US |
| 1983 | −3 259 483 986 $ US | 2 571 000 000 $ US |
| 1982 | −3 188 683 128 $ US | 4 812 000 000 $ US |
| 1981 | −3 131 228 070 $ US | 2 150 220 000 $ US |
| 1980 | −2 559 607 843 $ US | −2 436 990 000 $ US |
| 1979 | −2 851 200 000 $ US | −1 572 643 000 $ US |
| 1978 | −2 447 647 059 $ US | −1 460 560 000 $ US |
| 1977 | −1 834 000 000 $ US | 210 672 000 $ US |
| 1976 | −2 433 750 000 $ US | 90 791 000 $ US |
| 1975 | −3 438 333 333 $ US | −380 480 000 $ US |
| 1974 | −3 132 500 000 $ US | −503 131 000 $ US |
| 1973 | −2 412 500 000 $ US | 701 488 000 $ US |
| 1972 | −925 000 000 $ US | 620 760 000 $ US |
| 1971 | −1 000 000 000 $ US | 477 289 000 $ US |
| 1970 | −1 283 333 333 $ US | 72 660 000 $ US |
| 1969 | - | 483 200 000 $ US |
| 1968 | - | 269 480 000 $ US |
| 1967 | - | 236 020 000 $ US |
| 1966 | - | 185 300 000 $ US |
| 1965 | - | 330 180 000 $ US |
| 1964 | - | 457 760 000 $ US |
| 1963 | - | 455 680 000 $ US |
| 1962 | - | 377 650 000 $ US |
| 1961 | - | 97 520 000 $ US |
| 1960 | - | −7 530 000 $ US |
En 2025, la balance commerciale d'Israël affichait un excédent de 13 milliards de dollars et celle de la Chine un excédent de 816 milliards de dollars ; l'excédent de la Chine était 63 fois plus grand. En 1970, la balance commerciale d'Israël affichait un déficit de 1,28 milliard de dollars et celle de la Chine un excédent de 72,7 millions de dollars.
De 1970 à 2025, la balance commerciale d'Israël a été excédentaire pendant 15 des 56 années, et celle de la Chine pendant 46. Les balances commerciales d'Israël et de la Chine ont été déficitaires en même temps pendant 10 de ces années, la dernière fois en 1993.
Israël vs Chine : chiffres de la balance commerciale
|
Israël
|
Chine
|
|
|---|---|---|
| Biens et services, $ US | +13,0 Md $US (2025) | +816 Md $US (2025) |
| % du PIB | +2,1 % (2025) | +4,2 % (2025) |
| Années d'excédent depuis 2000 | 15 sur 26 | 26 sur 26 |
| Solde des biens entre les deux, chiffres propres | −18,0 Md $US (2025) | −544 M $US (2025) |
| Premier excédent en biens avec | États-Unis (+6,12 Md $US, 2025) | États-Unis (+280 Md $US, 2025) |
| Premier déficit en biens avec | Chine (−18,0 Md $US, 2025) | Australie (−51,6 Md $US, 2025) |
Comparer la balance commerciale de 2 pays au choix
Sources :
- Banque mondiale | Économie et croissance (1960–2025, mis à jour en octobre 2026)
- TradeMap (2001–2025, mis à jour en octobre 2026)
Creative Commons Attribution (CC BY) : vous pouvez copier, partager, adapter et réutiliser ce contenu, y compris à des fins commerciales, à condition de citer statistics.wiki et d’indiquer les modifications apportées. Les sources citées ci-dessus peuvent avoir leurs propres conditions de licence.