
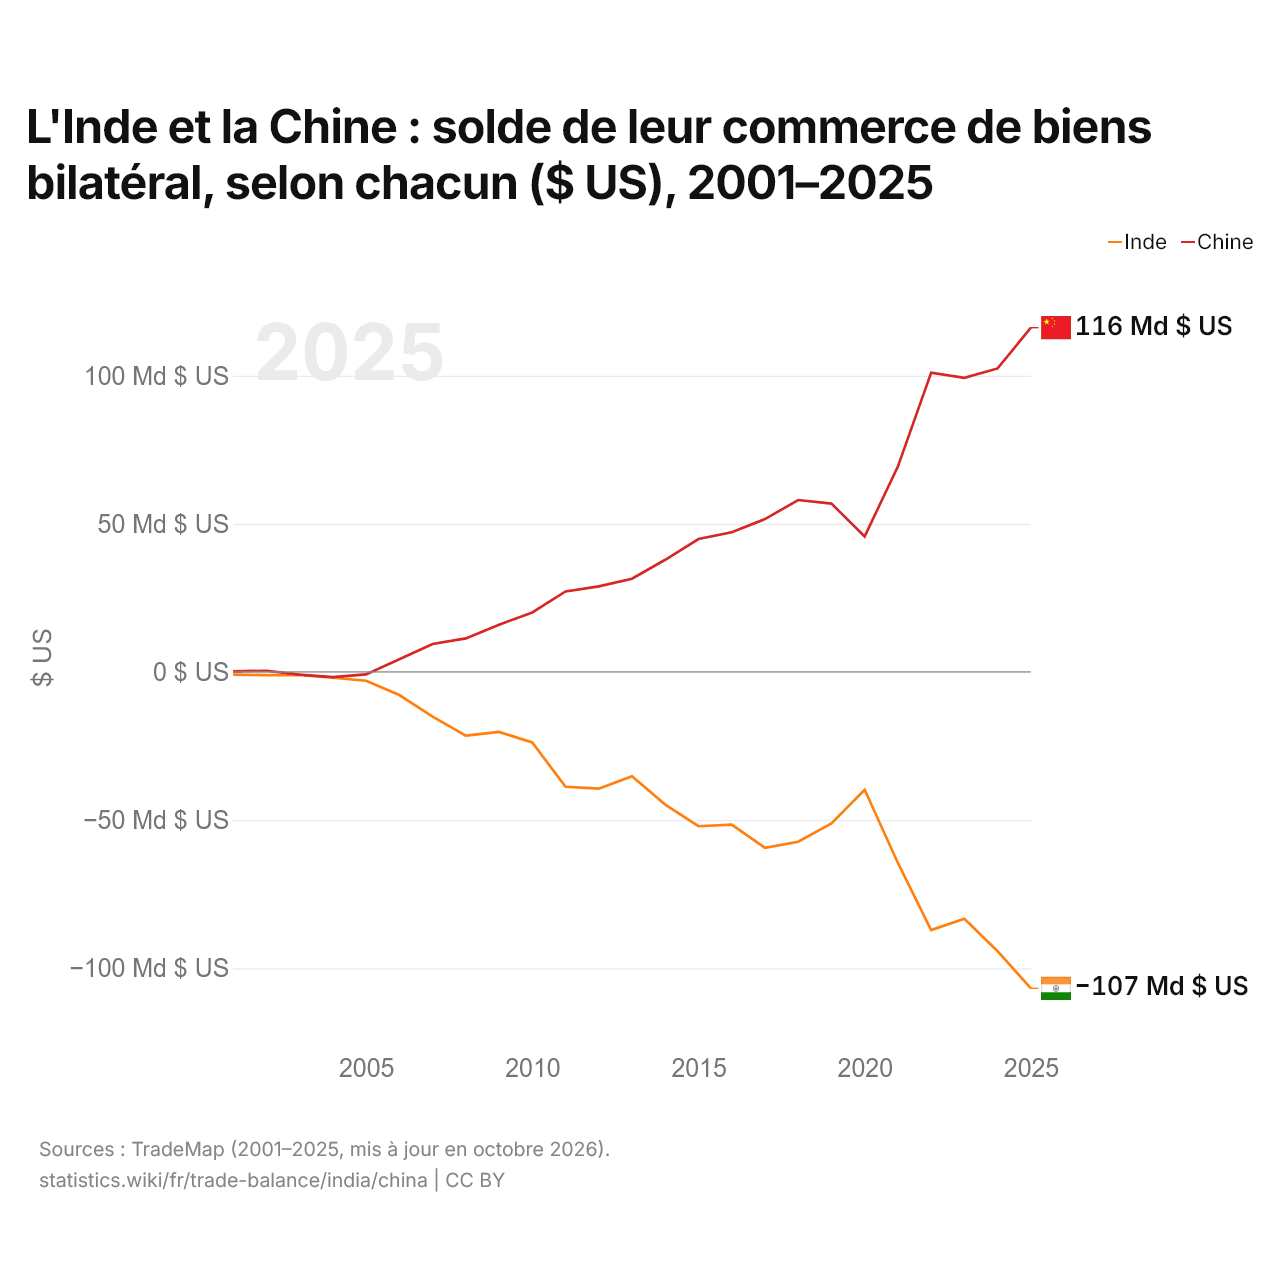
L'Inde et la Chine : solde de leur commerce de biens bilatéral, selon chacun ($ US), 2001–2025
| Année | $ US | |
|---|---|---|
| Inde | Chine | |
| 2025 | −106 811 520 000 $ US | 116 214 551 000 $ US |
| 2024 | −94 271 011 000 $ US | 102 458 758 000 $ US |
| 2023 | −83 365 353 000 $ US | 99 272 517 000 $ US |
| 2022 | −87 164 779 000 $ US | 101 018 706 000 $ US |
| 2021 | −64 498 539 000 $ US | 69 373 320 000 $ US |
| 2020 | −39 790 558 000 $ US | 45 742 186 000 $ US |
| 2019 | −51 123 260 000 $ US | 56 839 420 000 $ US |
| 2018 | −57 342 275 000 $ US | 58 030 600 000 $ US |
| 2017 | −59 389 658 000 $ US | 51 591 767 000 $ US |
| 2016 | −51 565 021 000 $ US | 47 171 936 000 $ US |
| 2015 | −52 101 591 000 $ US | 44 866 019 000 $ US |
| 2014 | −44 796 295 000 $ US | 37 858 731 000 $ US |
| 2013 | −35 218 619 000 $ US | 31 462 141 000 $ US |
| 2012 | −39 411 138 000 $ US | 28 880 261 000 $ US |
| 2011 | −38 765 239 000 $ US | 27 164 137 000 $ US |
| 2010 | −23 809 125 000 $ US | 20 067 645 000 $ US |
| 2009 | −20 243 319 000 $ US | 15 952 271 000 $ US |
| 2008 | −21 492 097 000 $ US | 11 326 495 000 $ US |
| 2007 | −15 083 794 000 $ US | 9 434 224 000 $ US |
| 2006 | −7 809 896 000 $ US | 4 303 848 000 $ US |
| 2005 | −2 983 269 000 $ US | −831 939 000 $ US |
| 2004 | −1 952 743 000 $ US | −1 742 022 000 $ US |
| 2003 | −1 047 964 000 $ US | −908 152 000 $ US |
| 2002 | −1 088 245 000 $ US | 397 293 000 $ US |
| 2001 | −905 007 000 $ US | 196 740 000 $ US |
En 2025, selon l'Inde, son commerce de biens avec la Chine affichait un déficit de 107 milliards de dollars ; selon la Chine, son commerce de biens avec l'Inde affichait un excédent de 116 milliards de dollars. En 2001, les chiffres étaient un déficit de 905 millions de dollars pour l'Inde et un excédent de 197 millions de dollars pour la Chine.
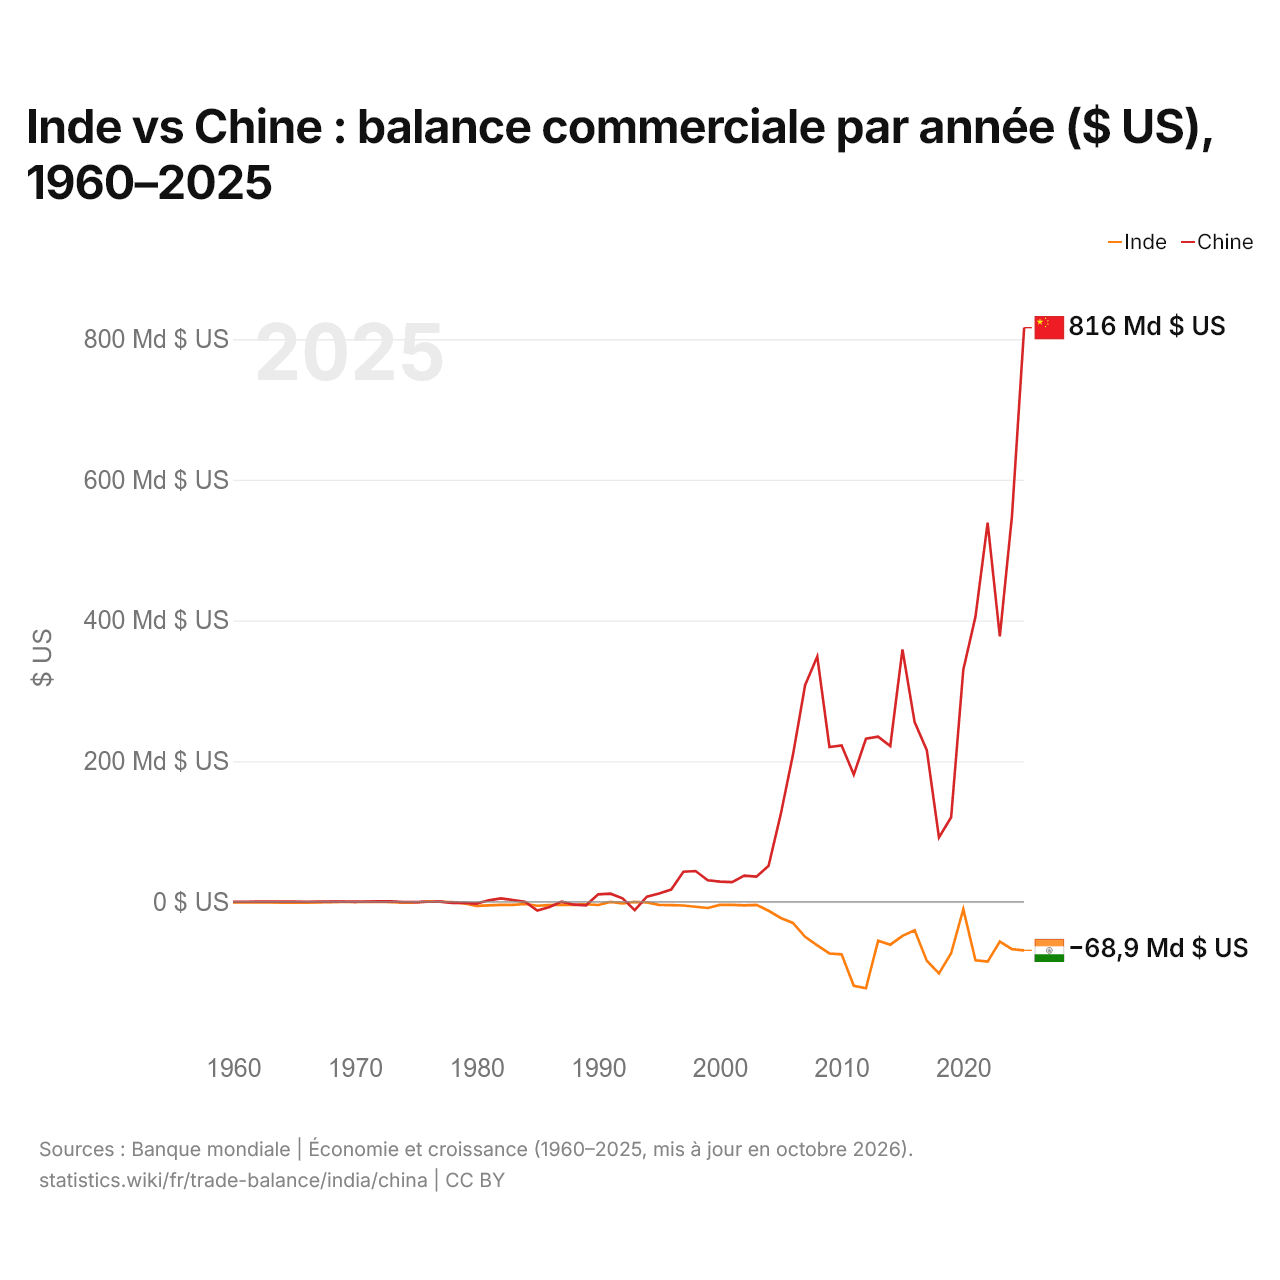
Inde vs Chine : balance commerciale par année ($ US), 1960–2025
| Année | $ US | |
|---|---|---|
 Inde |
 Chine |
|
| 2025 | −68 919 379 155 $ US | 816 189 653 994 $ US |
| 2024 | −67 270 704 658 $ US | 548 703 728 924 $ US |
| 2023 | −56 481 801 795 $ US | 377 368 486 355 $ US |
| 2022 | −85 070 227 555 $ US | 539 054 406 264 $ US |
| 2021 | −83 133 636 377 $ US | 405 394 120 058 $ US |
| 2020 | −10 516 218 300 $ US | 330 134 703 664 $ US |
| 2019 | −73 069 992 885 $ US | 120 151 888 640 $ US |
| 2018 | −101 665 620 603 $ US | 91 487 265 093 $ US |
| 2017 | −83 759 204 290 $ US | 215 697 133 466 $ US |
| 2016 | −40 526 477 692 $ US | 255 484 319 295 $ US |
| 2015 | −48 309 654 578 $ US | 358 836 357 206 $ US |
| 2014 | −60 893 612 908 $ US | 221 549 605 872 $ US |
| 2013 | −55 375 035 766 $ US | 234 872 118 182 $ US |
| 2012 | −122 906 076 681 $ US | 231 864 021 797 $ US |
| 2011 | −119 283 327 195 $ US | 180 895 321 770 $ US |
| 2010 | −74 620 856 173 $ US | 222 400 893 687 $ US |
| 2009 | −73 425 843 079 $ US | 220 130 401 367 $ US |
| 2008 | −62 024 910 978 $ US | 348 832 533 154 $ US |
| 2007 | −49 726 426 539 $ US | 308 036 028 783 $ US |
| 2006 | −29 981 104 764 $ US | 208 918 924 501 $ US |
| 2005 | −22 898 356 563 $ US | 124 626 797 517 $ US |
| 2004 | −12 662 376 777 $ US | 51 174 382 540 $ US |
| 2003 | −4 233 294 135 $ US | 35 821 129 066 $ US |
| 2002 | −5 045 863 334 $ US | 37 382 671 264 $ US |
| 2001 | −4 254 860 905 $ US | 28 086 220 298 $ US |
| 2000 | −4 245 772 554 $ US | 28 785 851 579 $ US |
| 1999 | −8 770 221 354 $ US | 30 640 955 367 $ US |
| 1998 | −7 005 099 303 $ US | 43 836 689 480 $ US |
| 1997 | −5 148 241 779 $ US | 42 823 220 000 $ US |
| 1996 | −4 554 261 385 $ US | 17 550 000 000 $ US |
| 1995 | −4 249 570 650 $ US | 11 958 000 000 $ US |
| 1994 | −988 286 716 $ US | 7 357 000 000 $ US |
| 1993 | 47 187 344 $ US | −11 792 000 000 $ US |
| 1992 | −2 153 620 947 $ US | 4 998 000 000 $ US |
| 1991 | 2 039 268 $ US | 11 601 000 000 $ US |
| 1990 | −4 492 297 406 $ US | 10 668 000 000 $ US |
| 1989 | −3 362 657 410 $ US | −4 928 000 000 $ US |
| 1988 | −4 211 604 784 $ US | −4 061 000 000 $ US |
| 1987 | −3 838 531 827 $ US | 291 000 000 $ US |
| 1986 | −4 548 547 296 $ US | −7 390 000 000 $ US |
| 1985 | −5 559 179 686 $ US | −12 501 000 000 $ US |
| 1984 | −3 060 529 243 $ US | 54 000 000 $ US |
| 1983 | −4 398 713 512 $ US | 2 571 000 000 $ US |
| 1982 | −4 334 108 792 $ US | 4 812 000 000 $ US |
| 1981 | −5 098 906 809 $ US | 2 150 220 000 $ US |
| 1980 | −5 786 386 673 $ US | −2 436 990 000 $ US |
| 1979 | −2 171 813 477 $ US | −1 572 643 000 $ US |
| 1978 | −375 331 507 $ US | −1 460 560 000 $ US |
| 1977 | 143 648 830 $ US | 210 672 000 $ US |
| 1976 | 587 355 938 $ US | 90 791 000 $ US |
| 1975 | −984 594 448 $ US | −380 480 000 $ US |
| 1974 | −1 183 618 321 $ US | −503 131 000 $ US |
| 1973 | −440 047 978 $ US | 701 488 000 $ US |
| 1972 | 227 671 476 $ US | 620 760 000 $ US |
| 1971 | −225 759 297 $ US | 477 289 000 $ US |
| 1970 | −60 000 000 $ US | 72 660 000 $ US |
| 1969 | −185 333 333 $ US | 483 200 000 $ US |
| 1968 | −480 000 000 $ US | 269 480 000 $ US |
| 1967 | −958 666 667 $ US | 236 020 000 $ US |
| 1966 | −1 152 811 397 $ US | 185 300 000 $ US |
| 1965 | −1 134 001 134 $ US | 330 180 000 $ US |
| 1964 | −1 106 701 107 $ US | 457 760 000 $ US |
| 1963 | −787 500 788 $ US | 455 680 000 $ US |
| 1962 | −785 400 785 $ US | 377 650 000 $ US |
| 1961 | −648 900 649 $ US | 97 520 000 $ US |
| 1960 | −877 800 878 $ US | −7 530 000 $ US |
En 2025, la balance commerciale de l'Inde affichait un déficit de 68,9 milliards de dollars et celle de la Chine un excédent de 816 milliards de dollars. En 1960, la balance commerciale de l'Inde affichait un déficit de 878 millions de dollars et celle de la Chine un déficit de 7,53 millions de dollars.
De 1960 à 2025, la balance commerciale de l'Inde a été excédentaire pendant 5 des 66 années, et celle de la Chine pendant 55. Les balances commerciales de l'Inde et de la Chine ont été déficitaires en même temps pendant 10 de ces années, la dernière fois en 1989.
Inde vs Chine : chiffres de la balance commerciale
|
Inde
|
Chine
|
|
|---|---|---|
| Biens et services, $ US | −68,9 Md $US (2025) | +816 Md $US (2025) |
| % du PIB | −1,7 % (2025) | +4,2 % (2025) |
| Années d'excédent depuis 2000 | 0 sur 26 | 26 sur 26 |
| Solde des biens entre les deux, chiffres propres | −107 Md $US (2025) | +116 Md $US (2025) |
| Premier excédent en biens avec | États-Unis (+42,9 Md $US, 2025) | États-Unis (+280 Md $US, 2025) |
| Premier déficit en biens avec | Chine (−107 Md $US, 2025) | Australie (−51,6 Md $US, 2025) |
Comparer la balance commerciale de 2 pays au choix
Sources :
- Banque mondiale | Économie et croissance (1960–2025, mis à jour en octobre 2026)
- TradeMap (2001–2025, mis à jour en octobre 2026)
Creative Commons Attribution (CC BY) : vous pouvez copier, partager, adapter et réutiliser ce contenu, y compris à des fins commerciales, à condition de citer statistics.wiki et d’indiquer les modifications apportées. Les sources citées ci-dessus peuvent avoir leurs propres conditions de licence.