
Le Népal et la Chine : solde de leur commerce de biens bilatéral, selon chacun ($ US), 2001–2025
| Année | $ US | |
|---|---|---|
| Népal | Chine | |
| 2025 | - | 2 304 122 000 $ US |
| 2024 | - | 2 124 357 000 $ US |
| 2023 | - | 1 734 152 000 $ US |
| 2022 | −1 844 111 000 $ US | 1 633 234 000 $ US |
| 2021 | −2 369 226 000 $ US | 1 923 825 000 $ US |
| 2020 | −1 334 142 000 $ US | 1 151 262 000 $ US |
| 2019 | −1 921 773 000 $ US | 1 448 940 000 $ US |
| 2018 | −1 715 929 000 $ US | 1 056 410 000 $ US |
| 2017 | −1 307 674 000 $ US | 955 505 000 $ US |
| 2016 | −1 229 050 000 $ US | 851 082 000 $ US |
| 2015 | −908 526 000 $ US | 807 018 000 $ US |
| 2014 | −911 532 000 $ US | 2 236 512 000 $ US |
| 2013 | −583 386 000 $ US | 2 167 637 000 $ US |
| 2012 | −674 658 000 $ US | 1 938 642 000 $ US |
| 2011 | −679 681 000 $ US | 1 167 361 000 $ US |
| 2010 | −547 572 000 $ US | 719 841 000 $ US |
| 2009 | −397 517 000 $ US | 403 599 000 $ US |
| 2008 | −128 522 000 $ US | 369 636 000 $ US |
| 2007 | −128 522 000 $ US | 371 568 000 $ US |
| 2006 | −128 522 000 $ US | 251 511 000 $ US |
| 2005 | −128 522 000 $ US | 179 441 000 $ US |
| 2004 | −128 522 000 $ US | 155 013 000 $ US |
| 2003 | −128 522 000 $ US | 116 660 000 $ US |
| 2002 | - | 99 796 000 $ US |
| 2001 | - | 143 911 000 $ US |
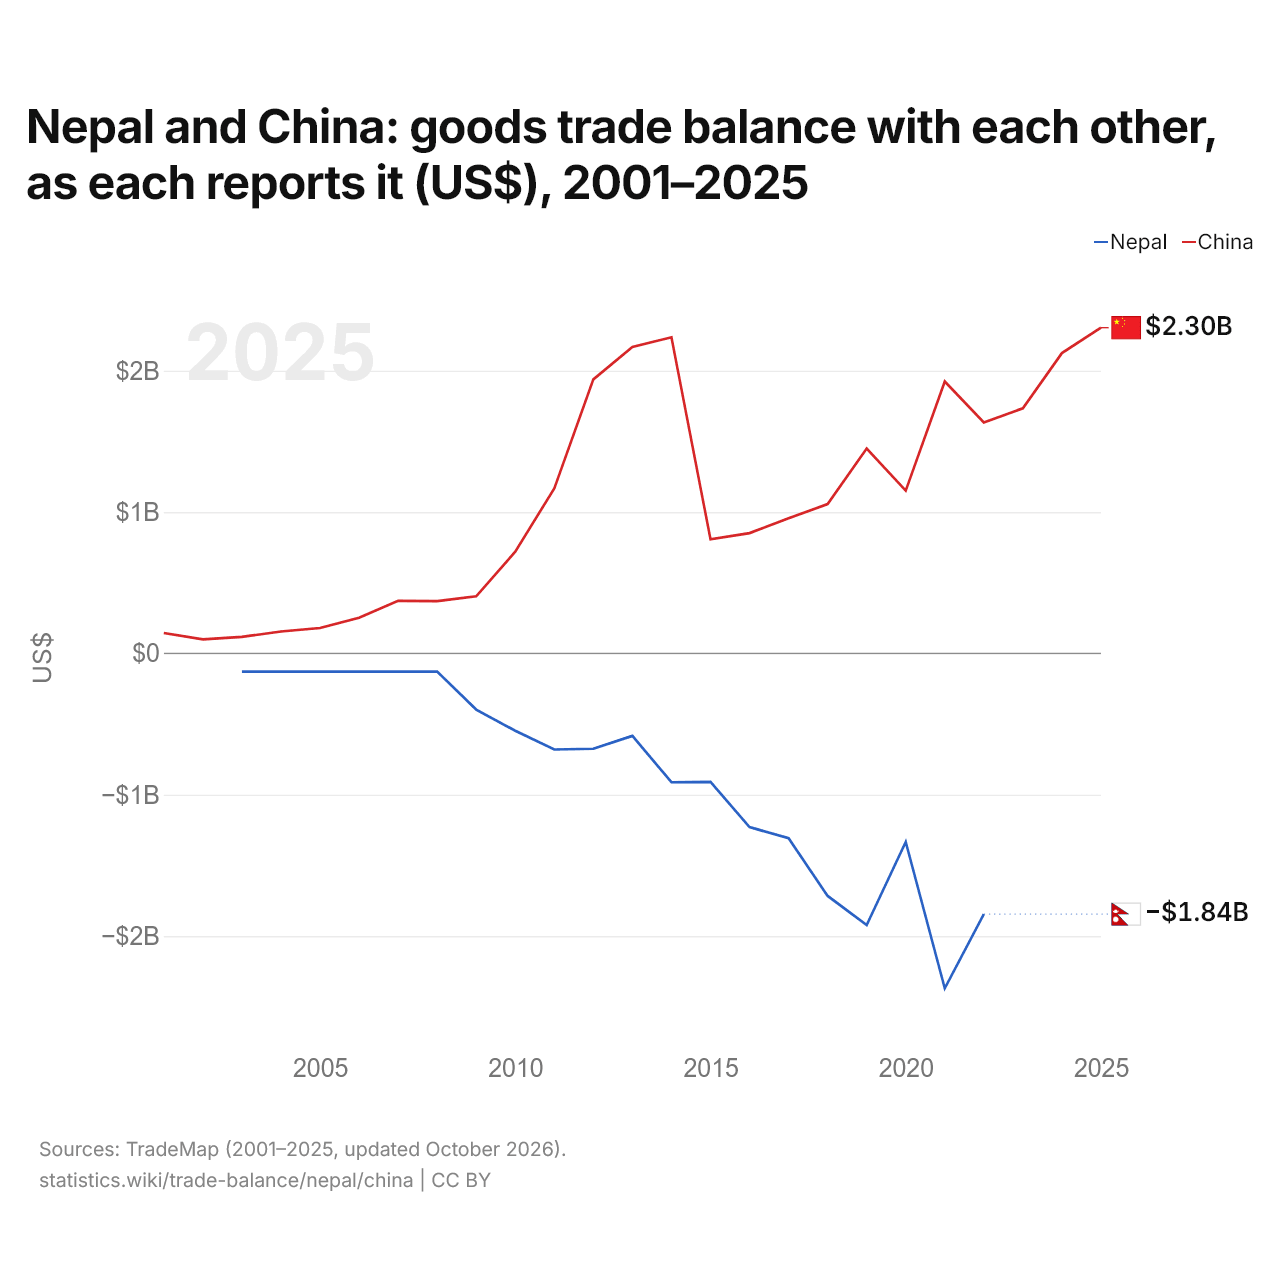
Selon le Népal, son commerce de biens avec la Chine affichait un déficit de 1,84 milliard de dollars ; selon la Chine, son commerce de biens avec le Népal affichait un excédent de 1,63 milliard de dollars. En 2003, les chiffres étaient un déficit de 129 millions de dollars pour le Népal et un excédent de 117 millions de dollars pour la Chine.
Népal vs Chine : balance commerciale par année ($ US), 1960–2025
| Année | $ US | |
|---|---|---|
 Népal |
 Chine |
|
| 2025 | −11 325 496 917 $ US | 816 189 653 994 $ US |
| 2024 | −10 851 375 469 $ US | 548 703 728 924 $ US |
| 2023 | −11 312 462 877 $ US | 377 368 486 355 $ US |
| 2022 | −14 648 203 159 $ US | 539 054 406 264 $ US |
| 2021 | −12 117 057 230 $ US | 405 394 120 058 $ US |
| 2020 | −9 130 156 432 $ US | 330 134 703 664 $ US |
| 2019 | −11 517 205 870 $ US | 120 151 888 640 $ US |
| 2018 | −10 865 912 856 $ US | 91 487 265 093 $ US |
| 2017 | −8 406 985 329 $ US | 215 697 133 466 $ US |
| 2016 | −6 316 510 579 $ US | 255 484 319 295 $ US |
| 2015 | −6 391 434 590 $ US | 358 836 357 206 $ US |
| 2014 | −5 849 879 970 $ US | 221 549 605 872 $ US |
| 2013 | −5 158 487 757 $ US | 234 872 118 182 $ US |
| 2012 | −4 432 060 436 $ US | 231 864 021 797 $ US |
| 2011 | −4 462 444 951 $ US | 180 895 321 770 $ US |
| 2010 | −4 291 885 800 $ US | 222 400 893 687 $ US |
| 2009 | −2 859 043 816 $ US | 220 130 401 367 $ US |
| 2008 | −2 569 878 630 $ US | 348 832 533 154 $ US |
| 2007 | −1 948 231 956 $ US | 308 036 028 783 $ US |
| 2006 | −1 616 003 938 $ US | 208 918 924 501 $ US |
| 2005 | −1 211 048 644 $ US | 124 626 797 517 $ US |
| 2004 | −929 747 245 $ US | 51 174 382 540 $ US |
| 2003 | −813 348 972 $ US | 35 821 129 066 $ US |
| 2002 | −650 860 003 $ US | 37 382 671 264 $ US |
| 2001 | −641 455 782 $ US | 28 086 220 298 $ US |
| 2000 | −502 316 491 $ US | 28 785 851 579 $ US |
| 1999 | −345 813 098 $ US | 30 640 955 367 $ US |
| 1998 | −537 368 846 $ US | 43 836 689 480 $ US |
| 1997 | −559 740 487 $ US | 42 823 220 000 $ US |
| 1996 | −579 784 999 $ US | 17 550 000 000 $ US |
| 1995 | −420 050 227 $ US | 11 958 000 000 $ US |
| 1994 | −506 077 551 $ US | 7 357 000 000 $ US |
| 1993 | −377 850 000 $ US | −11 792 000 000 $ US |
| 1992 | −332 501 114 $ US | 4 998 000 000 $ US |
| 1991 | −458 559 867 $ US | 11 601 000 000 $ US |
| 1990 | −403 897 488 $ US | 10 668 000 000 $ US |
| 1989 | −395 379 411 $ US | −4 928 000 000 $ US |
| 1988 | −381 294 038 $ US | −4 061 000 000 $ US |
| 1987 | −268 913 256 $ US | 291 000 000 $ US |
| 1986 | −246 320 174 $ US | −7 390 000 000 $ US |
| 1985 | −221 916 059 $ US | −12 501 000 000 $ US |
| 1984 | −227 059 769 $ US | 54 000 000 $ US |
| 1983 | −271 247 885 $ US | 2 571 000 000 $ US |
| 1982 | −172 846 486 $ US | 4 812 000 000 $ US |
| 1981 | −152 833 342 $ US | 2 150 220 000 $ US |
| 1980 | −139 916 667 $ US | −2 436 990 000 $ US |
| 1979 | −77 416 683 $ US | −1 572 643 000 $ US |
| 1978 | −78 614 682 $ US | −1 460 560 000 $ US |
| 1977 | −34 960 000 $ US | 210 672 000 $ US |
| 1976 | −49 445 265 $ US | 90 791 000 $ US |
| 1975 | −70 368 962 $ US | −380 480 000 $ US |
| 1974 | −62 095 863 $ US | −503 131 000 $ US |
| 1973 | −36 567 171 $ US | 701 488 000 $ US |
| 1972 | −23 111 102 $ US | 620 760 000 $ US |
| 1971 | −32 888 889 $ US | 477 289 000 $ US |
| 1970 | −29 432 099 $ US | 72 660 000 $ US |
| 1969 | −25 283 951 $ US | 483 200 000 $ US |
| 1968 | −5 059 929 $ US | 269 480 000 $ US |
| 1967 | −656 254 $ US | 236 020 000 $ US |
| 1966 | −28 218 926 $ US | 185 300 000 $ US |
| 1965 | −45 281 533 $ US | 330 180 000 $ US |
| 1964 | - | 457 760 000 $ US |
| 1963 | - | 455 680 000 $ US |
| 1962 | - | 377 650 000 $ US |
| 1961 | - | 97 520 000 $ US |
| 1960 | - | −7 530 000 $ US |
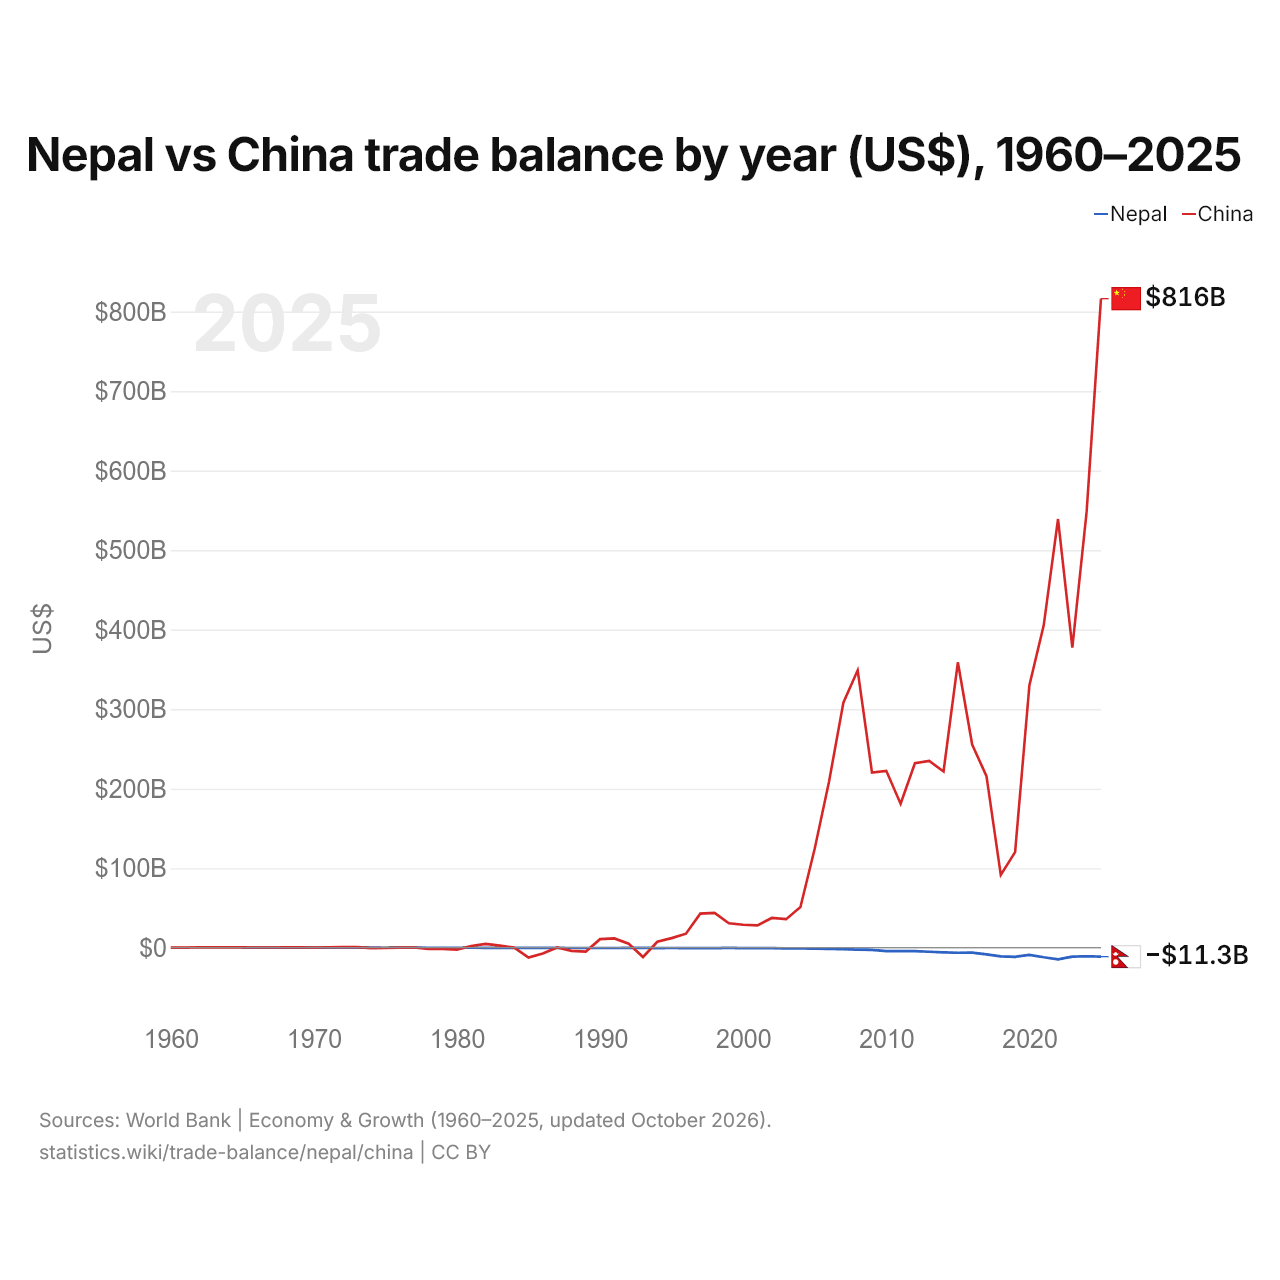
En 2025, la balance commerciale du Népal affichait un déficit de 11,3 milliards de dollars et celle de la Chine un excédent de 816 milliards de dollars. En 1965, la balance commerciale du Népal affichait un déficit de 45,3 millions de dollars et celle de la Chine un excédent de 330 millions de dollars.
De 1965 à 2025, la balance commerciale du Népal a été excédentaire pendant aucune des 61 années, et celle de la Chine pendant 51. Les balances commerciales du Népal et de la Chine ont été déficitaires en même temps pendant 10 de ces années, la dernière fois en 1993.
Népal vs Chine : chiffres de la balance commerciale
|
Népal
|
Chine
|
|
|---|---|---|
| Biens et services, $ US | −11,3 Md $US (2025) | +816 Md $US (2025) |
| % du PIB | −24,9 % (2025) | +4,2 % (2025) |
| Années d'excédent depuis 2000 | 0 sur 26 | 26 sur 26 |
| Solde des biens entre les deux, chiffres propres | −1,84 Md $US (2022) | +2,30 Md $US (2025) |
| Premier excédent en biens avec | Danemark (+3,63 M $US, 2022) | États-Unis (+280 Md $US, 2025) |
| Premier déficit en biens avec | Inde (−7,73 Md $US, 2022) | Australie (−51,6 Md $US, 2025) |
Comparer la balance commerciale de 2 pays au choix
Sources :
- Banque mondiale | Économie et croissance (1960–2025, mis à jour en octobre 2026)
- TradeMap (2001–2025, mis à jour en octobre 2026)
Creative Commons Attribution (CC BY) : vous pouvez copier, partager, adapter et réutiliser ce contenu, y compris à des fins commerciales, à condition de citer statistics.wiki et d’indiquer les modifications apportées. Les sources citées ci-dessus peuvent avoir leurs propres conditions de licence.