
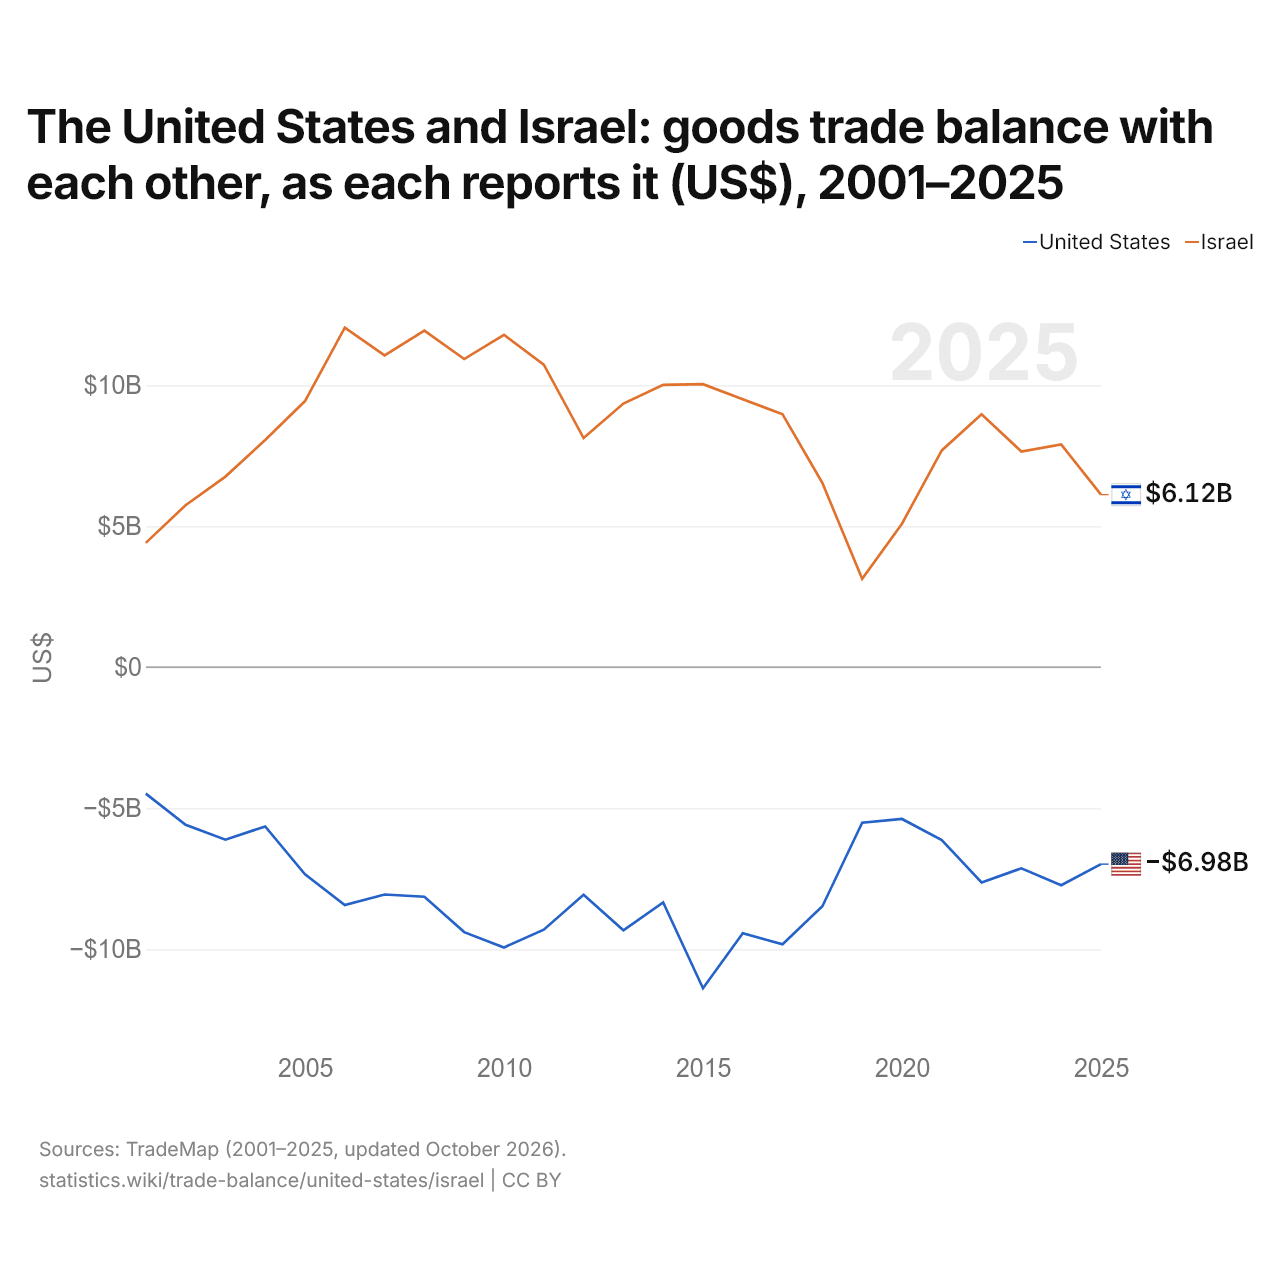
Les États-Unis et Israël : solde de leur commerce de biens bilatéral, selon chacun ($ US), 2001–2025
| Année | $ US | |
|---|---|---|
| États-Unis | Israël | |
| 2025 | −6 982 943 000 $ US | 6 117 112 000 $ US |
| 2024 | −7 731 351 000 $ US | 7 899 130 000 $ US |
| 2023 | −7 131 211 000 $ US | 7 646 058 000 $ US |
| 2022 | −7 632 777 000 $ US | 8 966 477 000 $ US |
| 2021 | −6 130 012 000 $ US | 7 684 369 000 $ US |
| 2020 | −5 380 746 000 $ US | 5 087 986 000 $ US |
| 2019 | −5 513 919 000 $ US | 3 134 104 000 $ US |
| 2018 | −8 475 468 000 $ US | 6 531 431 000 $ US |
| 2017 | −9 821 275 000 $ US | 8 964 735 000 $ US |
| 2016 | −9 432 243 000 $ US | 9 499 849 000 $ US |
| 2015 | −11 385 214 000 $ US | 10 035 191 000 $ US |
| 2014 | −8 339 776 000 $ US | 10 009 721 000 $ US |
| 2013 | −9 329 713 000 $ US | 9 345 876 000 $ US |
| 2012 | −8 067 120 000 $ US | 8 123 192 000 $ US |
| 2011 | −9 308 121 000 $ US | 10 725 462 000 $ US |
| 2010 | −9 936 616 000 $ US | 11 785 166 000 $ US |
| 2009 | −9 393 631 000 $ US | 10 925 133 000 $ US |
| 2008 | −8 140 170 000 $ US | 11 933 631 000 $ US |
| 2007 | −8 058 678 000 $ US | 11 054 006 000 $ US |
| 2006 | −8 434 746 000 $ US | 12 036 543 000 $ US |
| 2005 | −7 346 255 000 $ US | 9 434 645 000 $ US |
| 2004 | −5 645 475 000 $ US | 8 055 684 000 $ US |
| 2003 | −6 115 461 000 $ US | 6 757 351 000 $ US |
| 2002 | −5 590 595 000 $ US | 5 742 375 000 $ US |
| 2001 | −4 483 606 000 $ US | 4 407 703 000 $ US |
En 2025, selon les États-Unis, leur commerce de biens avec Israël affichait un déficit de 6,98 milliards de dollars ; selon Israël, son commerce de biens avec les États-Unis affichait un excédent de 6,12 milliards de dollars. En 2001, les chiffres étaient un déficit de 4,48 milliards de dollars pour les États-Unis et un excédent de 4,41 milliards de dollars pour Israël.
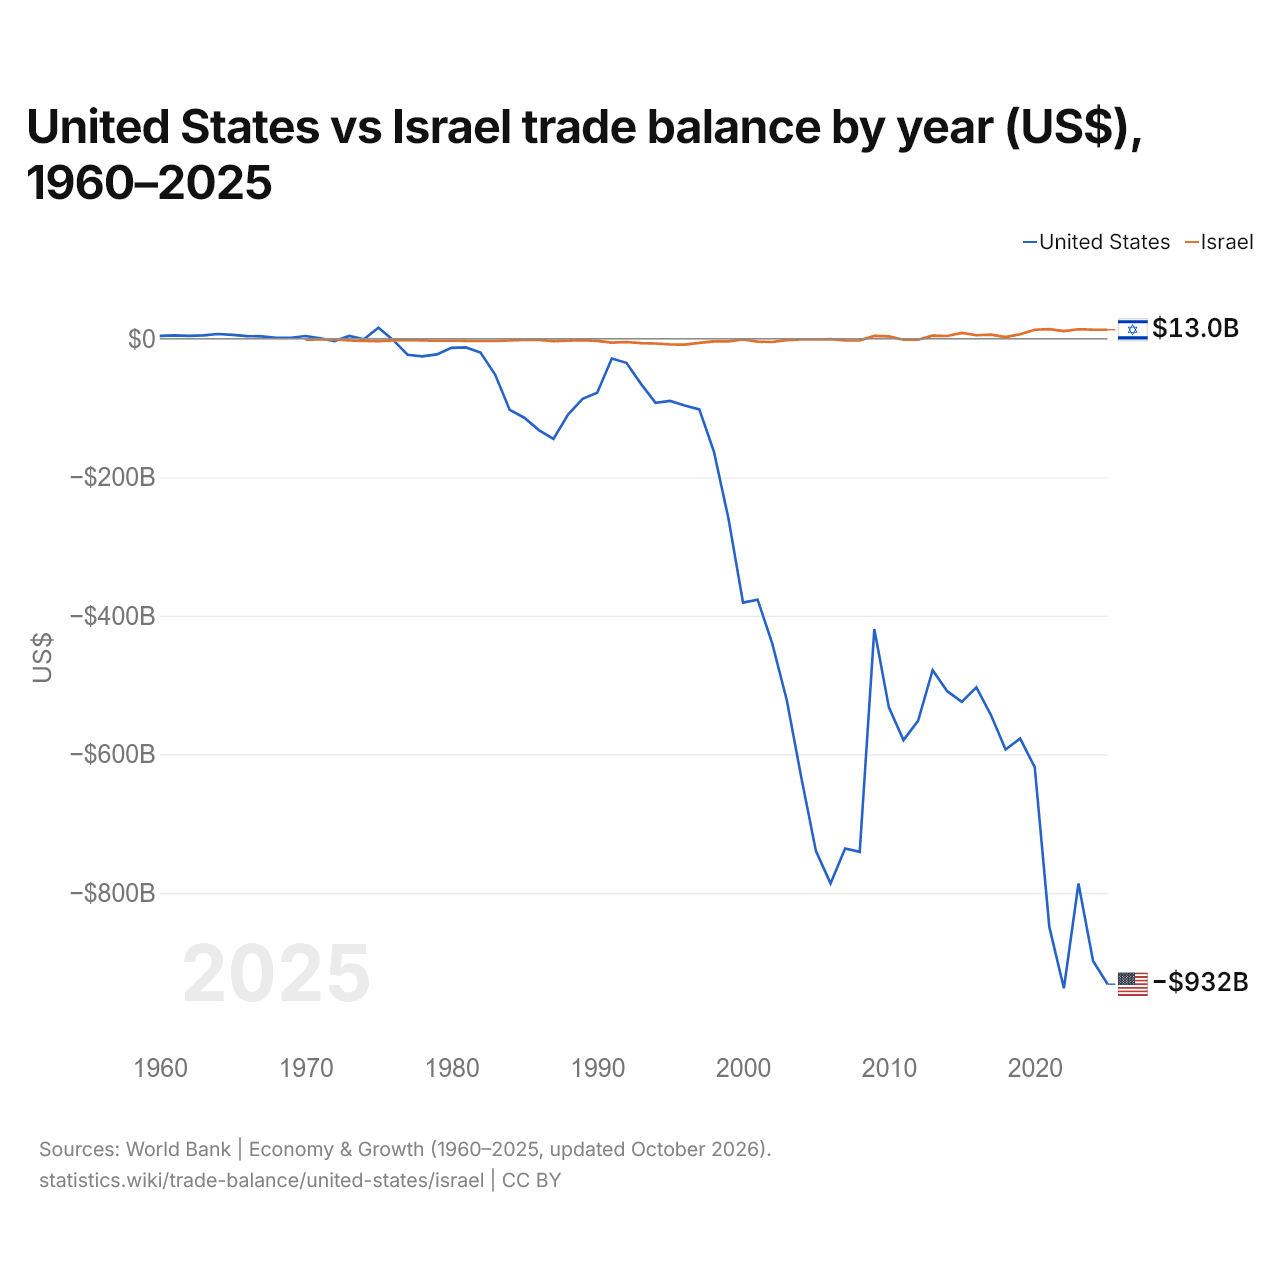
États-Unis vs Israël : balance commerciale par année ($ US), 1960–2025
| Année | $ US | |
|---|---|---|
 États-Unis |
 Israël |
|
| 2025 | −931 962 000 000 $ US | 12 994 365 505 $ US |
| 2024 | −898 460 000 000 $ US | 13 100 279 099 $ US |
| 2023 | −786 496 000 000 $ US | 13 754 663 733 $ US |
| 2022 | −937 889 000 000 $ US | 11 000 808 302 $ US |
| 2021 | −849 233 000 000 $ US | 13 804 496 055 $ US |
| 2020 | −618 554 000 000 $ US | 13 021 165 408 $ US |
| 2019 | −577 290 000 000 $ US | 6 557 503 906 $ US |
| 2018 | −593 077 000 000 $ US | 2 413 018 727 $ US |
| 2017 | −543 329 000 000 $ US | 6 004 796 901 $ US |
| 2016 | −503 272 000 000 $ US | 5 128 475 225 $ US |
| 2015 | −524 320 000 000 $ US | 8 575 319 326 $ US |
| 2014 | −508 900 000 000 $ US | 3 984 226 053 $ US |
| 2013 | −478 453 000 000 $ US | 4 406 103 796 $ US |
| 2012 | −551 617 000 000 $ US | −1 392 248 402 $ US |
| 2011 | −579 616 000 000 $ US | −1 462 187 515 $ US |
| 2010 | −532 308 000 000 $ US | 3 412 251 219 $ US |
| 2009 | −419 153 000 000 $ US | 4 198 677 110 $ US |
| 2008 | −740 871 000 000 $ US | −2 287 048 495 $ US |
| 2007 | −735 933 000 000 $ US | −2 539 773 861 $ US |
| 2006 | −786 453 000 000 $ US | −575 153 283 $ US |
| 2005 | −739 902 000 000 $ US | −1 009 500 635 $ US |
| 2004 | −634 141 000 000 $ US | −793 186 301 $ US |
| 2003 | −521 955 000 000 $ US | −1 975 804 879 $ US |
| 2002 | −439 745 000 000 $ US | −4 669 753 894 $ US |
| 2001 | −376 747 000 000 $ US | −4 222 578 168 $ US |
| 2000 | −381 073 000 000 $ US | −1 098 518 628 $ US |
| 1999 | −259 550 000 000 $ US | −3 810 722 999 $ US |
| 1998 | −162 711 000 000 $ US | −3 730 624 984 $ US |
| 1997 | −101 971 000 000 $ US | −5 975 502 116 $ US |
| 1996 | −96 377 000 000 $ US | −8 351 877 056 $ US |
| 1995 | −89 762 000 000 $ US | −8 115 948 262 $ US |
| 1994 | −92 487 000 000 $ US | −6 867 235 894 $ US |
| 1993 | −65 174 000 000 $ US | −6 232 770 220 $ US |
| 1992 | −34 738 000 000 $ US | −4 720 523 362 $ US |
| 1991 | −28 613 000 000 $ US | −5 509 077 267 $ US |
| 1990 | −77 855 000 000 $ US | −3 103 552 723 $ US |
| 1989 | −86 741 000 000 $ US | −2 010 870 382 $ US |
| 1988 | −109 392 000 000 $ US | −2 800 375 258 $ US |
| 1987 | −144 770 000 000 $ US | −3 498 185 125 $ US |
| 1986 | −131 869 000 000 $ US | −1 649 481 113 $ US |
| 1985 | −114 018 000 000 $ US | −1 698 280 601 $ US |
| 1984 | −102 727 000 000 $ US | −2 488 666 439 $ US |
| 1983 | −51 642 000 000 $ US | −3 259 483 986 $ US |
| 1982 | −19 974 000 000 $ US | −3 188 683 128 $ US |
| 1981 | −12 519 000 000 $ US | −3 131 228 070 $ US |
| 1980 | −13 056 000 000 $ US | −2 559 607 843 $ US |
| 1979 | −22 545 000 000 $ US | −2 851 200 000 $ US |
| 1978 | −25 367 000 000 $ US | −2 447 647 059 $ US |
| 1977 | −23 094 000 000 $ US | −1 834 000 000 $ US |
| 1976 | −1 631 000 000 $ US | −2 433 750 000 $ US |
| 1975 | 15 976 000 000 $ US | −3 438 333 333 $ US |
| 1974 | −815 000 000 $ US | −3 132 500 000 $ US |
| 1973 | 4 110 000 000 $ US | −2 412 500 000 $ US |
| 1972 | −3 373 000 000 $ US | −925 000 000 $ US |
| 1971 | 621 000 000 $ US | −1 000 000 000 $ US |
| 1970 | 3 949 000 000 $ US | −1 283 333 333 $ US |
| 1969 | 1 429 548 641 $ US | - |
| 1968 | 1 347 972 646 $ US | - |
| 1967 | 3 550 386 094 $ US | - |
| 1966 | 3 858 020 910 $ US | - |
| 1965 | 5 604 920 537 $ US | - |
| 1964 | 6 900 003 028 $ US | - |
| 1963 | 4 928 769 439 $ US | - |
| 1962 | 4 093 606 558 $ US | - |
| 1961 | 4 907 882 243 $ US | - |
| 1960 | 4 200 885 010 $ US | - |
En 2025, la balance commerciale des États-Unis affichait un déficit de 932 milliards de dollars et celle d'Israël un excédent de 13 milliards de dollars. En 1970, la balance commerciale des États-Unis affichait un excédent de 3,95 milliards de dollars et celle d'Israël un déficit de 1,28 milliard de dollars.
De 1970 à 2025, la balance commerciale des États-Unis a été excédentaire pendant 4 des 56 années, et celle d'Israël pendant 15. Les balances commerciales des États-Unis et d'Israël ont été déficitaires en même temps pendant 37 de ces années, la dernière fois en 2012.
États-Unis vs Israël : chiffres de la balance commerciale
|
États-Unis
|
Israël
|
|
|---|---|---|
| Biens et services, $ US | −932 Md $US (2025) | +13,0 Md $US (2025) |
| % du PIB | −3,0 % (2025) | +2,1 % (2025) |
| Années d'excédent depuis 2000 | 0 sur 26 | 15 sur 26 |
| Solde des biens entre les deux, chiffres propres | −6,98 Md $US (2025) | +6,12 Md $US (2025) |
| Premier excédent en biens avec | Pays-Bas (+59,9 Md $US, 2025) | États-Unis (+6,12 Md $US, 2025) |
| Premier déficit en biens avec | Chine (−221 Md $US, 2025) | Chine (−18,0 Md $US, 2025) |
Comparer la balance commerciale de 2 pays au choix
Sources :
- Banque mondiale | Économie et croissance (1960–2025, mis à jour en octobre 2026)
- TradeMap (2001–2025, mis à jour en octobre 2026)
Creative Commons Attribution (CC BY) : vous pouvez copier, partager, adapter et réutiliser ce contenu, y compris à des fins commerciales, à condition de citer statistics.wiki et d’indiquer les modifications apportées. Les sources citées ci-dessus peuvent avoir leurs propres conditions de licence.