
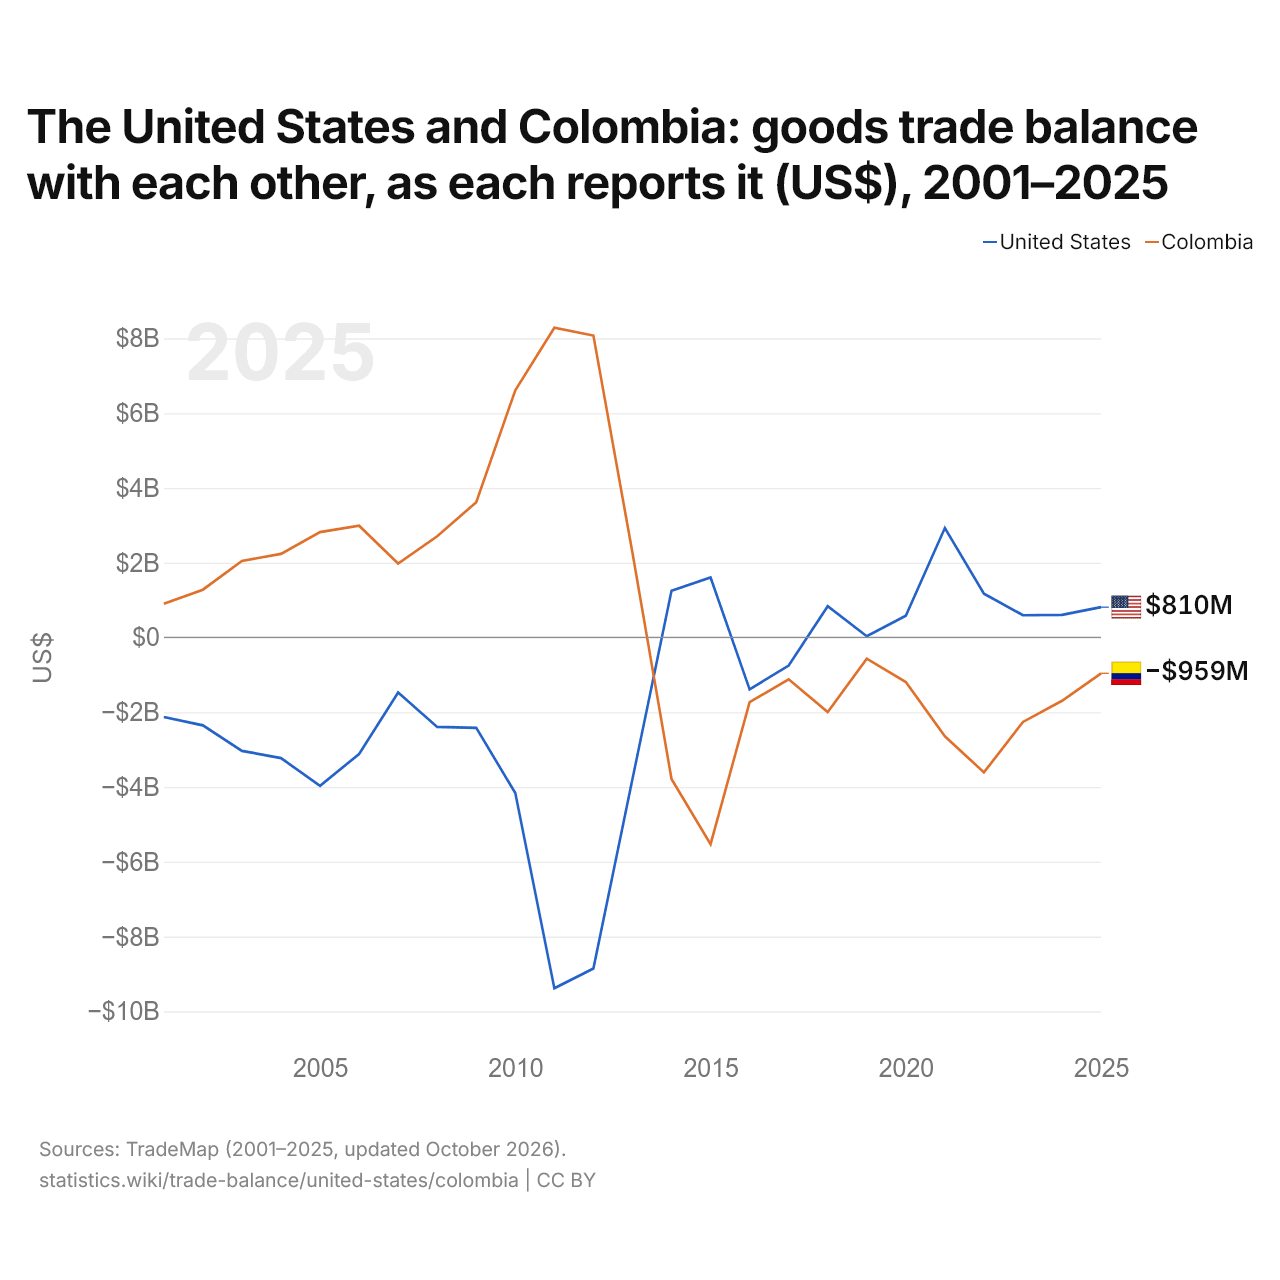
Les États-Unis et la Colombie : solde de leur commerce de biens bilatéral, selon chacun ($ US), 2001–2025
| Année | $ US | |
|---|---|---|
| États-Unis | Colombie | |
| 2025 | 809 921 000 $ US | −958 963 000 $ US |
| 2024 | 604 024 000 $ US | −1 693 405 000 $ US |
| 2023 | 594 393 000 $ US | −2 259 541 000 $ US |
| 2022 | 1 171 708 000 $ US | −3 609 760 000 $ US |
| 2021 | 2 929 252 000 $ US | −2 642 017 000 $ US |
| 2020 | 580 901 000 $ US | −1 192 146 000 $ US |
| 2019 | 30 816 000 $ US | −567 132 000 $ US |
| 2018 | 836 045 000 $ US | −1 995 339 000 $ US |
| 2017 | −752 889 000 $ US | −1 120 181 000 $ US |
| 2016 | −1 388 270 000 $ US | −1 730 939 000 $ US |
| 2015 | 1 603 725 000 $ US | −5 530 758 000 $ US |
| 2014 | 1 248 437 000 $ US | −3 785 584 000 $ US |
| 2013 | −3 788 258 000 $ US | 2 264 472 000 $ US |
| 2012 | −8 856 685 000 $ US | 8 076 122 000 $ US |
| 2011 | −9 384 355 000 $ US | 8 285 197 000 $ US |
| 2010 | −4 161 977 000 $ US | 6 611 464 000 $ US |
| 2009 | −2 417 571 000 $ US | 3 617 675 000 $ US |
| 2008 | −2 393 590 000 $ US | 2 705 814 000 $ US |
| 2007 | −1 474 240 000 $ US | 1 978 052 000 $ US |
| 2006 | −3 118 327 000 $ US | 2 987 625 000 $ US |
| 2005 | −3 966 298 000 $ US | 2 818 390 000 $ US |
| 2004 | −3 226 427 000 $ US | 2 235 441 000 $ US |
| 2003 | −3 033 770 000 $ US | 2 047 535 000 $ US |
| 2002 | −2 350 948 000 $ US | 1 277 272 000 $ US |
| 2001 | −2 127 116 000 $ US | 901 758 000 $ US |
En 2025, selon les États-Unis, leur commerce de biens avec la Colombie affichait un excédent de 810 millions de dollars ; selon la Colombie, son commerce de biens avec les États-Unis affichait un déficit de 959 millions de dollars. En 2001, les chiffres étaient un déficit de 2,13 milliards de dollars pour les États-Unis et un excédent de 902 millions de dollars pour la Colombie.
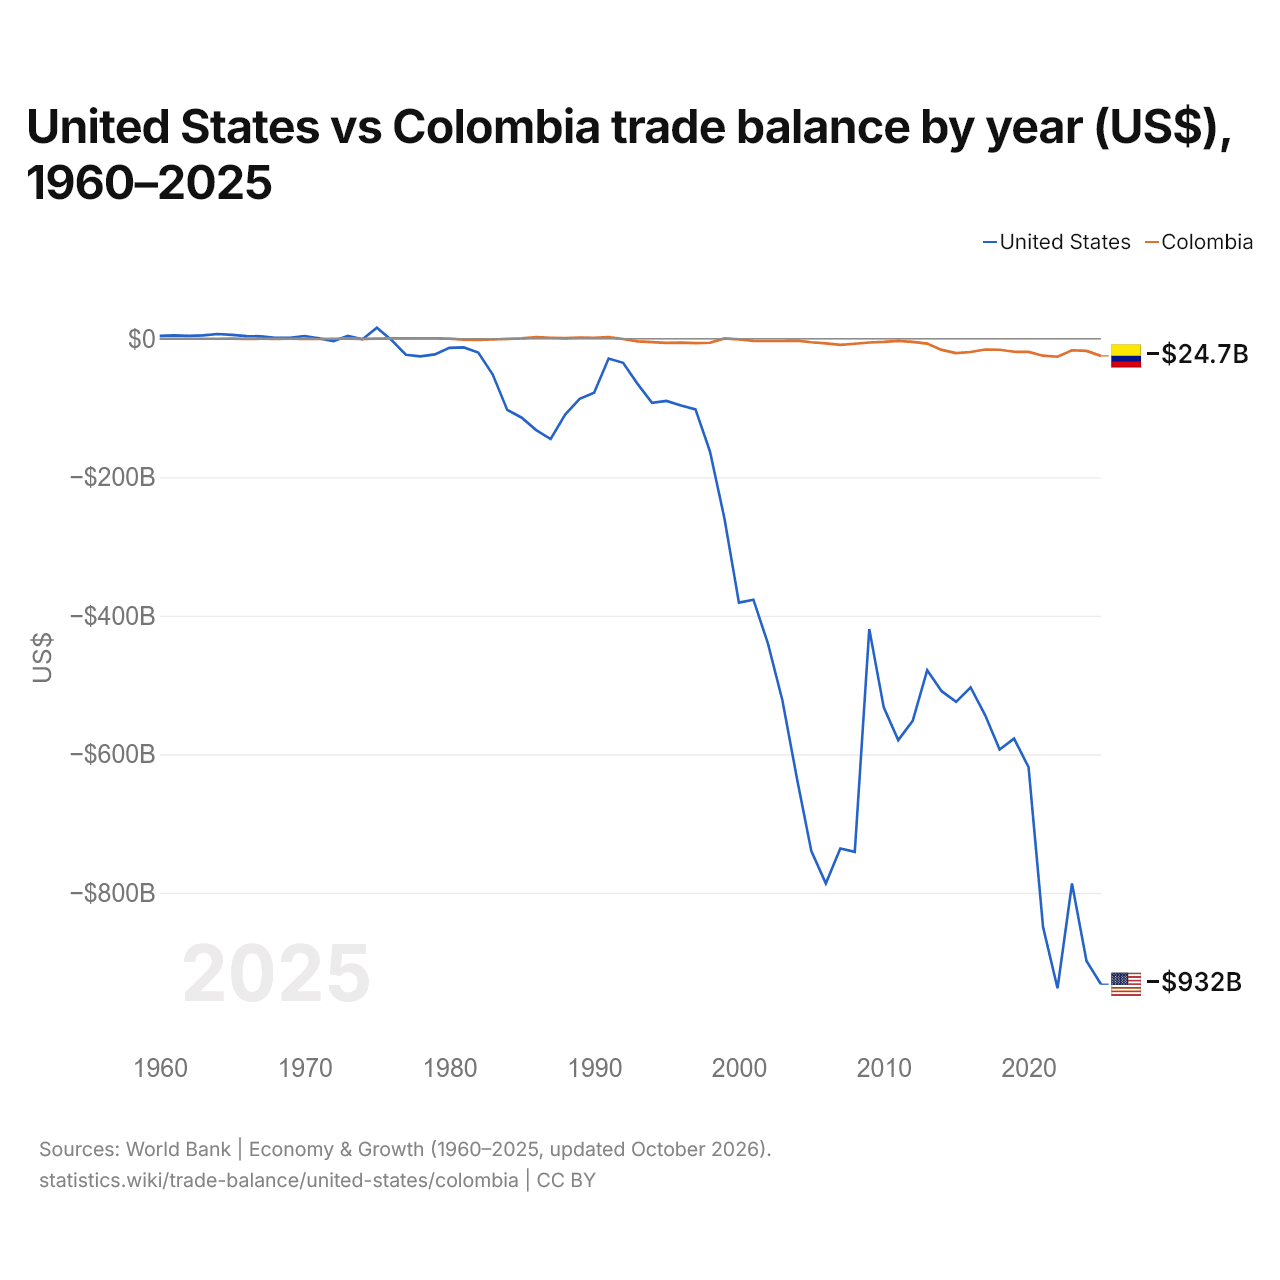
États-Unis vs Colombie : balance commerciale par année ($ US), 1960–2025
| Année | $ US | |
|---|---|---|
 États-Unis |
 Colombie |
|
| 2025 | −931 962 000 000 $ US | −24 704 082 006 $ US |
| 2024 | −898 460 000 000 $ US | −17 480 709 488 $ US |
| 2023 | −786 496 000 000 $ US | −16 575 761 884 $ US |
| 2022 | −937 889 000 000 $ US | −25 942 895 382 $ US |
| 2021 | −849 233 000 000 $ US | −24 415 341 501 $ US |
| 2020 | −618 554 000 000 $ US | −18 954 175 958 $ US |
| 2019 | −577 290 000 000 $ US | −18 808 380 841 $ US |
| 2018 | −593 077 000 000 $ US | −15 825 333 144 $ US |
| 2017 | −543 329 000 000 $ US | −15 569 440 552 $ US |
| 2016 | −503 272 000 000 $ US | −19 135 554 970 $ US |
| 2015 | −524 320 000 000 $ US | −20 721 562 437 $ US |
| 2014 | −508 900 000 000 $ US | −16 080 615 460 $ US |
| 2013 | −478 453 000 000 $ US | −6 930 298 385 $ US |
| 2012 | −551 617 000 000 $ US | −4 495 521 441 $ US |
| 2011 | −579 616 000 000 $ US | −3 073 024 233 $ US |
| 2010 | −532 308 000 000 $ US | −4 535 024 401 $ US |
| 2009 | −419 153 000 000 $ US | −5 363 370 848 $ US |
| 2008 | −740 871 000 000 $ US | −7 150 135 805 $ US |
| 2007 | −735 933 000 000 $ US | −8 728 898 041 $ US |
| 2006 | −786 453 000 000 $ US | −6 769 709 371 $ US |
| 2005 | −739 902 000 000 $ US | −5 067 786 618 $ US |
| 2004 | −634 141 000 000 $ US | −2 718 797 023 $ US |
| 2003 | −521 955 000 000 $ US | −3 185 356 027 $ US |
| 2002 | −439 745 000 000 $ US | −3 282 653 778 $ US |
| 2001 | −376 747 000 000 $ US | −3 070 577 187 $ US |
| 2000 | −381 073 000 000 $ US | −835 760 658 $ US |
| 1999 | −259 550 000 000 $ US | 468 747 717 $ US |
| 1998 | −162 711 000 000 $ US | −5 802 491 966 $ US |
| 1997 | −101 971 000 000 $ US | −6 307 822 629 $ US |
| 1996 | −96 377 000 000 $ US | −5 484 866 733 $ US |
| 1995 | −89 762 000 000 $ US | −5 947 981 745 $ US |
| 1994 | −92 487 000 000 $ US | −4 837 512 138 $ US |
| 1993 | −65 174 000 000 $ US | −3 859 549 948 $ US |
| 1992 | −34 738 000 000 $ US | −335 606 528 $ US |
| 1991 | −28 613 000 000 $ US | 2 291 168 154 $ US |
| 1990 | −77 855 000 000 $ US | 1 410 217 815 $ US |
| 1989 | −86 741 000 000 $ US | 1 654 161 222 $ US |
| 1988 | −109 392 000 000 $ US | 952 681 941 $ US |
| 1987 | −144 770 000 000 $ US | 1 467 222 463 $ US |
| 1986 | −131 869 000 000 $ US | 2 391 414 017 $ US |
| 1985 | −114 018 000 000 $ US | 447 503 614 $ US |
| 1984 | −102 727 000 000 $ US | −221 548 838 $ US |
| 1983 | −51 642 000 000 $ US | −1 076 993 311 $ US |
| 1982 | −19 974 000 000 $ US | −1 667 093 178 $ US |
| 1981 | −12 519 000 000 $ US | −1 297 945 281 $ US |
| 1980 | −13 056 000 000 $ US | 207 410 165 $ US |
| 1979 | −22 545 000 000 $ US | 494 919 891 $ US |
| 1978 | −25 367 000 000 $ US | 657 756 746 $ US |
| 1977 | −23 094 000 000 $ US | 713 978 822 $ US |
| 1976 | −1 631 000 000 $ US | 483 441 418 $ US |
| 1975 | 15 976 000 000 $ US | 236 520 896 $ US |
| 1974 | −815 000 000 $ US | −134 872 245 $ US |
| 1973 | 4 110 000 000 $ US | 233 160 951 $ US |
| 1972 | −3 373 000 000 $ US | 39 603 598 $ US |
| 1971 | 621 000 000 $ US | −316 756 383 $ US |
| 1970 | 3 949 000 000 $ US | −92 440 984 $ US |
| 1969 | 1 429 548 641 $ US | −30 308 803 $ US |
| 1968 | 1 347 972 646 $ US | −61 871 996 $ US |
| 1967 | 3 550 386 094 $ US | 50 735 178 $ US |
| 1966 | 3 858 020 910 $ US | −236 962 963 $ US |
| 1965 | 5 604 920 537 $ US | 139 714 286 $ US |
| 1964 | 6 900 003 028 $ US | −41 462 556 $ US |
| 1963 | 4 928 769 439 $ US | −17 774 811 $ US |
| 1962 | 4 093 606 558 $ US | −188 605 $ US |
| 1961 | 4 907 882 243 $ US | −38 069 179 $ US |
| 1960 | 4 200 885 010 $ US | 37 777 800 $ US |
En 2025, la balance commerciale des États-Unis affichait un déficit de 932 milliards de dollars et celle de la Colombie un déficit de 24,7 milliards de dollars ; le déficit des États-Unis était 38 fois plus grand. En 1960, la balance commerciale des États-Unis affichait un excédent de 4,2 milliards de dollars et celle de la Colombie un excédent de 37,8 millions de dollars.
De 1960 à 2025, la balance commerciale des États-Unis a été excédentaire pendant 14 des 66 années, et celle de la Colombie pendant 19. Les balances commerciales des États-Unis et de la Colombie ont été déficitaires en même temps pendant 38 de ces années, la dernière fois en 2025.
États-Unis vs Colombie : chiffres de la balance commerciale
|
États-Unis
|
Colombie
|
|
|---|---|---|
| Biens et services, $ US | −932 Md $US (2025) | −24,7 Md $US (2025) |
| % du PIB | −3,0 % (2025) | −5,4 % (2025) |
| Années d'excédent depuis 2000 | 0 sur 26 | 0 sur 26 |
| Solde des biens entre les deux, chiffres propres | +810 M $US (2025) | −959 M $US (2025) |
| Premier excédent en biens avec | Pays-Bas (+59,9 Md $US, 2025) | Panama (+3,65 Md $US, 2025) |
| Premier déficit en biens avec | Chine (−221 Md $US, 2025) | Chine (−17,7 Md $US, 2025) |
Comparer la balance commerciale de 2 pays au choix
Sources :
- Banque mondiale | Économie et croissance (1960–2025, mis à jour en octobre 2026)
- TradeMap (2001–2025, mis à jour en octobre 2026)
Creative Commons Attribution (CC BY) : vous pouvez copier, partager, adapter et réutiliser ce contenu, y compris à des fins commerciales, à condition de citer statistics.wiki et d’indiquer les modifications apportées. Les sources citées ci-dessus peuvent avoir leurs propres conditions de licence.