
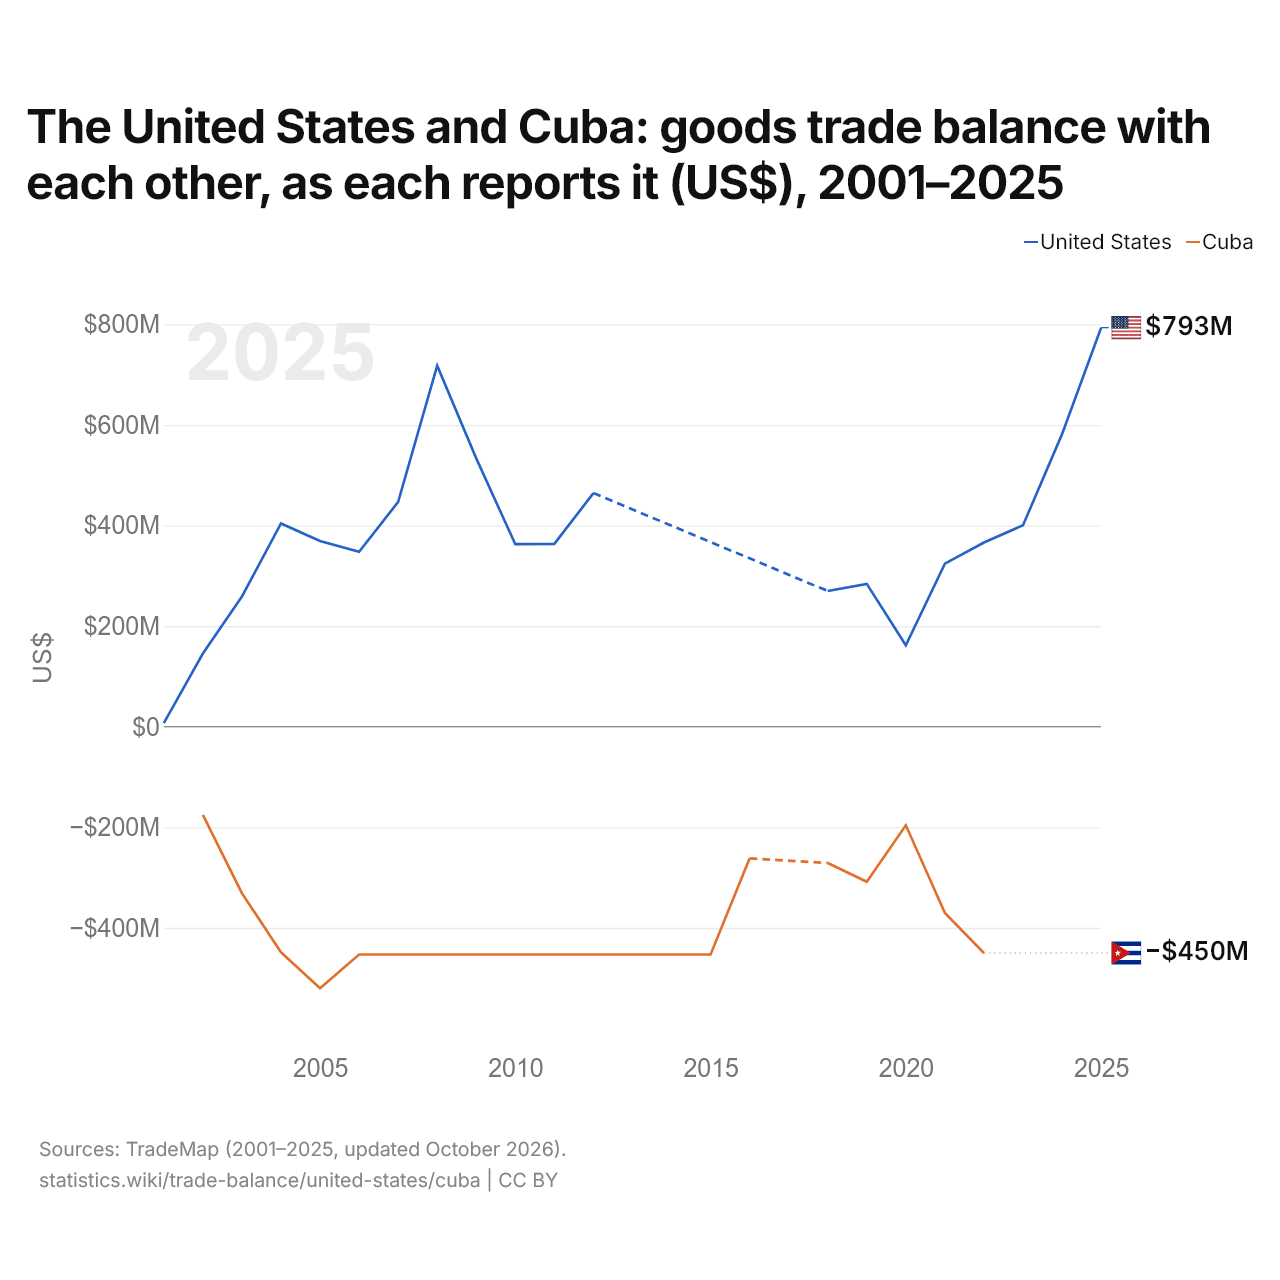
Les États-Unis et Cuba : solde de leur commerce de biens bilatéral, selon chacun ($ US), 2001–2025
| Année | $ US | |
|---|---|---|
| États-Unis | Cuba | |
| 2025 | 793 223 000 $ US | - |
| 2024 | 581 615 000 $ US | - |
| 2023 | 400 264 000 $ US | - |
| 2022 | 366 111 000 $ US | −449 944 000 $ US |
| 2021 | 324 090 000 $ US | −370 279 000 $ US |
| 2020 | 161 914 000 $ US | −196 118 000 $ US |
| 2019 | 283 885 000 $ US | −308 270 000 $ US |
| 2018 | 269 735 000 $ US | −271 071 000 $ US |
| 2017 | - | - |
| 2016 | - | −261 869 000 $ US |
| 2015 | - | −452 935 000 $ US |
| 2014 | - | −452 935 000 $ US |
| 2013 | - | −452 935 000 $ US |
| 2012 | 464 362 000 $ US | −452 935 000 $ US |
| 2011 | 363 310 000 $ US | −452 935 000 $ US |
| 2010 | 362 765 000 $ US | −452 935 000 $ US |
| 2009 | 533 347 000 $ US | −452 935 000 $ US |
| 2008 | 717 842 000 $ US | −452 935 000 $ US |
| 2007 | 446 793 000 $ US | −452 935 000 $ US |
| 2006 | 347 616 000 $ US | −452 935 000 $ US |
| 2005 | 369 025 000 $ US | −520 177 000 $ US |
| 2004 | 404 100 000 $ US | −448 519 000 $ US |
| 2003 | 258 813 000 $ US | −331 143 000 $ US |
| 2002 | 145 330 000 $ US | −175 244 000 $ US |
| 2001 | 7 090 000 $ US | - |
Selon les États-Unis, leur commerce de biens avec Cuba affichait un excédent de 366 millions de dollars ; selon Cuba, son commerce de biens avec les États-Unis affichait un déficit de 450 millions de dollars. En 2002, les chiffres étaient un excédent de 145 millions de dollars pour les États-Unis et un déficit de 175 millions de dollars pour Cuba.
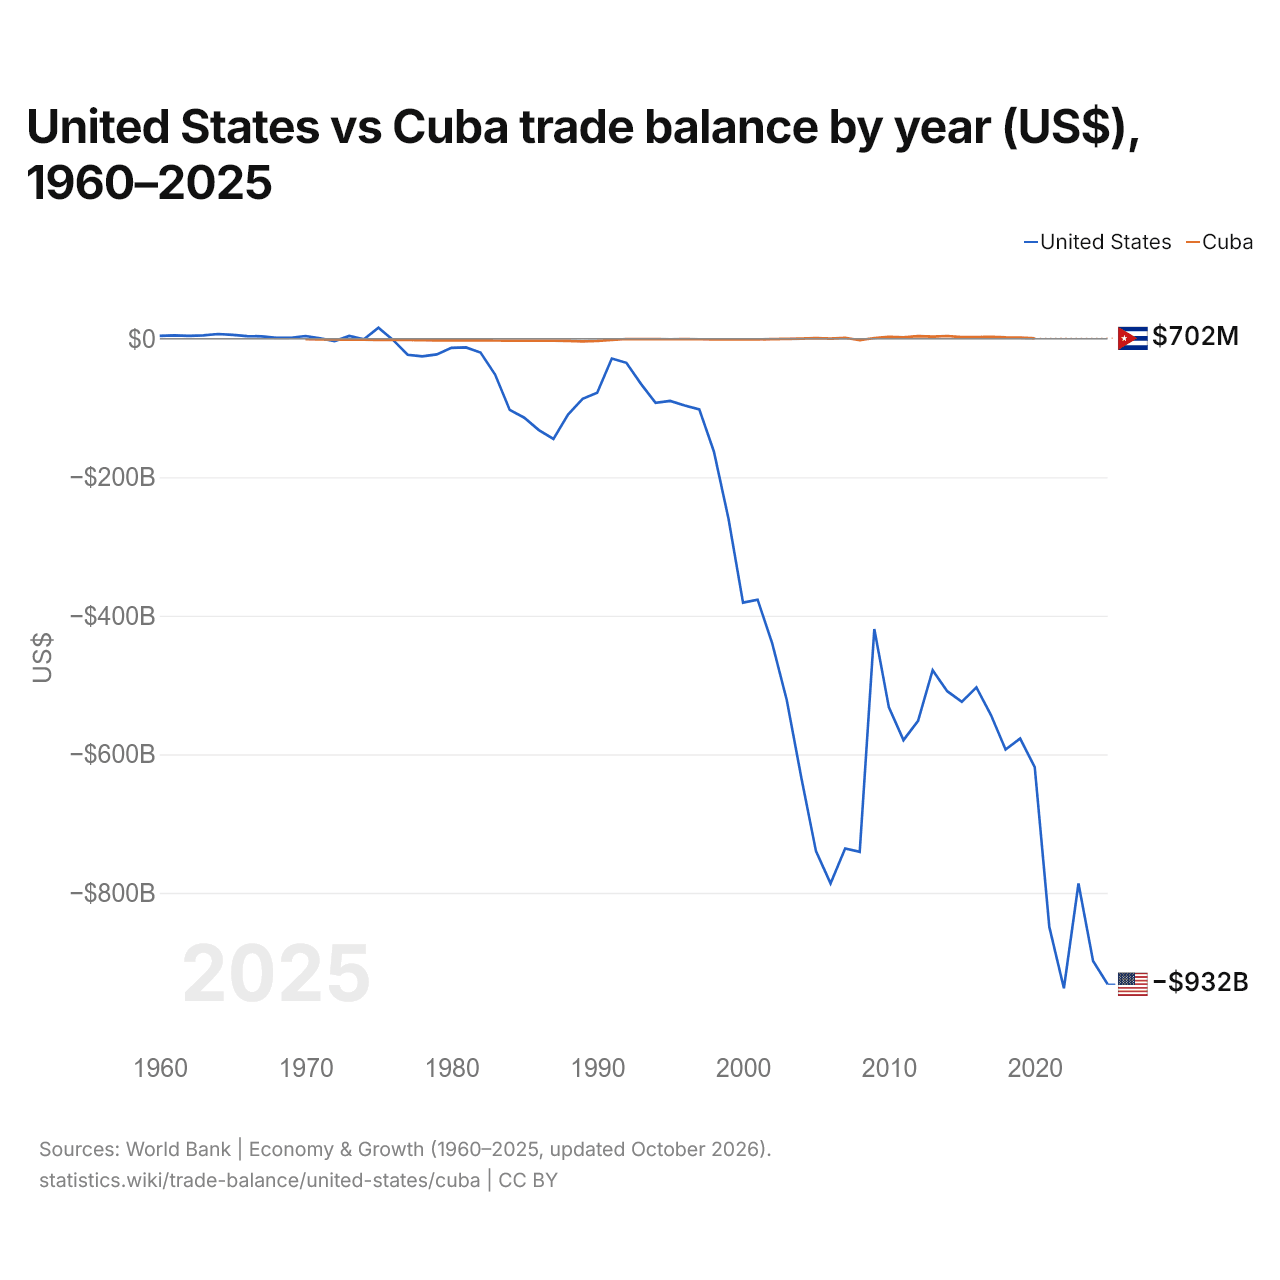
États-Unis vs Cuba : balance commerciale par année ($ US), 1960–2025
| Année | $ US | |
|---|---|---|
 États-Unis |
 Cuba |
|
| 2025 | −931 962 000 000 $ US | - |
| 2024 | −898 460 000 000 $ US | - |
| 2023 | −786 496 000 000 $ US | - |
| 2022 | −937 889 000 000 $ US | - |
| 2021 | −849 233 000 000 $ US | - |
| 2020 | −618 554 000 000 $ US | 702 000 000 $ US |
| 2019 | −577 290 000 000 $ US | 1 660 900 000 $ US |
| 2018 | −593 077 000 000 $ US | 1 962 900 000 $ US |
| 2017 | −543 329 000 000 $ US | 2 789 400 000 $ US |
| 2016 | −503 272 000 000 $ US | 2 463 300 000 $ US |
| 2015 | −524 320 000 000 $ US | 2 336 000 000 $ US |
| 2014 | −508 900 000 000 $ US | 3 947 000 000 $ US |
| 2013 | −478 453 000 000 $ US | 2 991 000 000 $ US |
| 2012 | −551 617 000 000 $ US | 3 771 000 000 $ US |
| 2011 | −579 616 000 000 $ US | 2 240 000 000 $ US |
| 2010 | −532 308 000 000 $ US | 2 887 962 963 $ US |
| 2009 | −419 153 000 000 $ US | 1 152 777 778 $ US |
| 2008 | −740 871 000 000 $ US | −2 129 351 852 $ US |
| 2007 | −735 933 000 000 $ US | 1 467 870 370 $ US |
| 2006 | −786 453 000 000 $ US | 116 666 667 $ US |
| 2005 | −739 902 000 000 $ US | 1 140 600 000 $ US |
| 2004 | −634 141 000 000 $ US | 279 700 000 $ US |
| 2003 | −521 955 000 000 $ US | −245 300 000 $ US |
| 2002 | −439 745 000 000 $ US | −562 700 000 $ US |
| 2001 | −376 747 000 000 $ US | −916 300 000 $ US |
| 2000 | −381 073 000 000 $ US | −860 700 000 $ US |
| 1999 | −259 550 000 000 $ US | −792 500 000 $ US |
| 1998 | −162 711 000 000 $ US | −1 029 300 000 $ US |
| 1997 | −101 971 000 000 $ US | −737 200 000 $ US |
| 1996 | −96 377 000 000 $ US | −500 000 000 $ US |
| 1995 | −89 762 000 000 $ US | −762 386 442 $ US |
| 1994 | −92 487 000 000 $ US | −368 823 784 $ US |
| 1993 | −65 174 000 000 $ US | −565 312 297 $ US |
| 1992 | −34 738 000 000 $ US | −289 398 378 $ US |
| 1991 | −28 613 000 000 $ US | −1 734 684 045 $ US |
| 1990 | −77 855 000 000 $ US | −3 046 844 016 $ US |
| 1989 | −86 741 000 000 $ US | −3 675 379 469 $ US |
| 1988 | −109 392 000 000 $ US | −3 043 123 879 $ US |
| 1987 | −144 770 000 000 $ US | −2 777 825 258 $ US |
| 1986 | −131 869 000 000 $ US | −2 918 851 692 $ US |
| 1985 | −114 018 000 000 $ US | −2 582 425 265 $ US |
| 1984 | −102 727 000 000 $ US | −2 837 376 779 $ US |
| 1983 | −51 642 000 000 $ US | −2 541 022 934 $ US |
| 1982 | −19 974 000 000 $ US | −2 412 947 059 $ US |
| 1981 | −12 519 000 000 $ US | −2 340 543 976 $ US |
| 1980 | −13 056 000 000 $ US | −2 295 740 833 $ US |
| 1979 | −22 545 000 000 $ US | −2 268 138 219 $ US |
| 1978 | −25 367 000 000 $ US | −2 058 740 779 $ US |
| 1977 | −23 094 000 000 $ US | −1 641 618 313 $ US |
| 1976 | −1 631 000 000 $ US | −1 594 581 973 $ US |
| 1975 | 15 976 000 000 $ US | −1 505 098 537 $ US |
| 1974 | −815 000 000 $ US | −1 318 322 927 $ US |
| 1973 | 4 110 000 000 $ US | −1 153 937 033 $ US |
| 1972 | −3 373 000 000 $ US | −940 170 199 $ US |
| 1971 | 621 000 000 $ US | −799 136 000 $ US |
| 1970 | 3 949 000 000 $ US | −657 873 400 $ US |
| 1969 | 1 429 548 641 $ US | - |
| 1968 | 1 347 972 646 $ US | - |
| 1967 | 3 550 386 094 $ US | - |
| 1966 | 3 858 020 910 $ US | - |
| 1965 | 5 604 920 537 $ US | - |
| 1964 | 6 900 003 028 $ US | - |
| 1963 | 4 928 769 439 $ US | - |
| 1962 | 4 093 606 558 $ US | - |
| 1961 | 4 907 882 243 $ US | - |
| 1960 | 4 200 885 010 $ US | - |
La balance commerciale des États-Unis affiche un déficit de 932 milliards de dollars (2025), et celle de Cuba un excédent de 702 millions de dollars (2020).
Depuis 1970, la balance commerciale des États-Unis a été excédentaire pendant 4 des 51 années, et celle de Cuba pendant 16. Les balances commerciales des États-Unis et de Cuba ont été déficitaires en même temps pendant 31 de ces années, la dernière fois en 2008.
États-Unis vs Cuba : chiffres de la balance commerciale
|
États-Unis
|
Cuba
|
|
|---|---|---|
| Biens et services, $ US | −932 Md $US (2025) | +702 M $US (2020) |
| % du PIB | −3,0 % (2025) | +0,7 % (2020) |
| Années d'excédent depuis 2000 | 0 sur 26 | 16 sur 21 |
| Solde des biens entre les deux, chiffres propres | +793 M $US (2025) | −450 M $US (2022) |
| Premier excédent en biens avec | Pays-Bas (+59,9 Md $US, 2025) | Chypre (+17,5 M $US, 2022) |
| Premier déficit en biens avec | Chine (−221 Md $US, 2025) | Chine (−950 M $US, 2022) |
Comparer la balance commerciale de 2 pays au choix
Sources :
- Banque mondiale | Économie et croissance (1960–2025, mis à jour en octobre 2026)
- TradeMap (2001–2025, mis à jour en octobre 2026)
Creative Commons Attribution (CC BY) : vous pouvez copier, partager, adapter et réutiliser ce contenu, y compris à des fins commerciales, à condition de citer statistics.wiki et d’indiquer les modifications apportées. Les sources citées ci-dessus peuvent avoir leurs propres conditions de licence.