
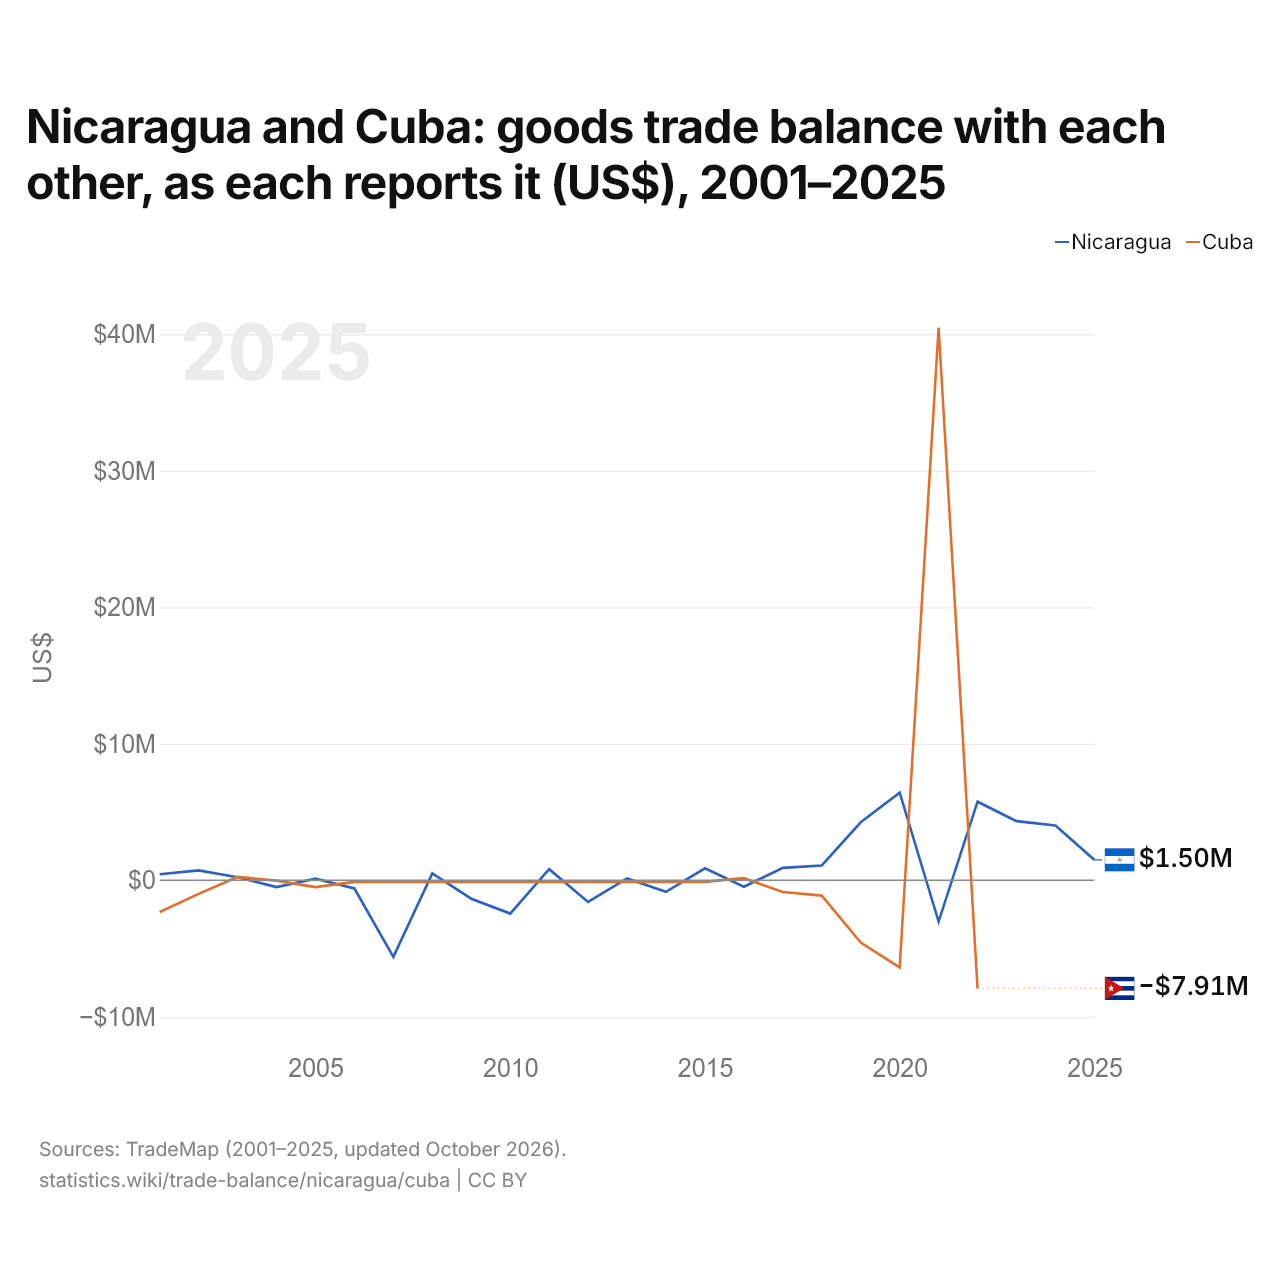
Le Nicaragua et Cuba : solde de leur commerce de biens bilatéral, selon chacun ($ US), 2001–2025
| Année | $ US | |
|---|---|---|
| Nicaragua | Cuba | |
| 2025 | 1 495 000 $ US | - |
| 2024 | 4 010 000 $ US | - |
| 2023 | 4 331 000 $ US | - |
| 2022 | 5 757 000 $ US | −7 911 000 $ US |
| 2021 | −3 023 000 $ US | 40 469 000 $ US |
| 2020 | 6 421 000 $ US | −6 378 000 $ US |
| 2019 | 4 249 000 $ US | −4 560 000 $ US |
| 2018 | 1 083 000 $ US | −1 122 000 $ US |
| 2017 | 909 000 $ US | −859 000 $ US |
| 2016 | −473 000 $ US | 153 000 $ US |
| 2015 | 875 000 $ US | −116 000 $ US |
| 2014 | −848 000 $ US | −116 000 $ US |
| 2013 | 136 000 $ US | −116 000 $ US |
| 2012 | −1 585 000 $ US | −116 000 $ US |
| 2011 | 817 000 $ US | −116 000 $ US |
| 2010 | −2 441 000 $ US | −116 000 $ US |
| 2009 | −1 352 000 $ US | −116 000 $ US |
| 2008 | 505 000 $ US | −116 000 $ US |
| 2007 | −5 613 000 $ US | −116 000 $ US |
| 2006 | −604 000 $ US | −116 000 $ US |
| 2005 | 124 000 $ US | −504 000 $ US |
| 2004 | −494 000 $ US | −21 000 $ US |
| 2003 | 219 000 $ US | 244 000 $ US |
| 2002 | 726 000 $ US | −995 000 $ US |
| 2001 | 442 000 $ US | −2 325 000 $ US |
Selon le Nicaragua, son commerce de biens avec Cuba affichait un excédent de 5,76 millions de dollars ; selon Cuba, son commerce de biens avec le Nicaragua affichait un déficit de 7,91 millions de dollars. En 2001, les chiffres étaient un excédent de 442 000 dollars pour le Nicaragua et un déficit de 2,33 millions de dollars pour Cuba.
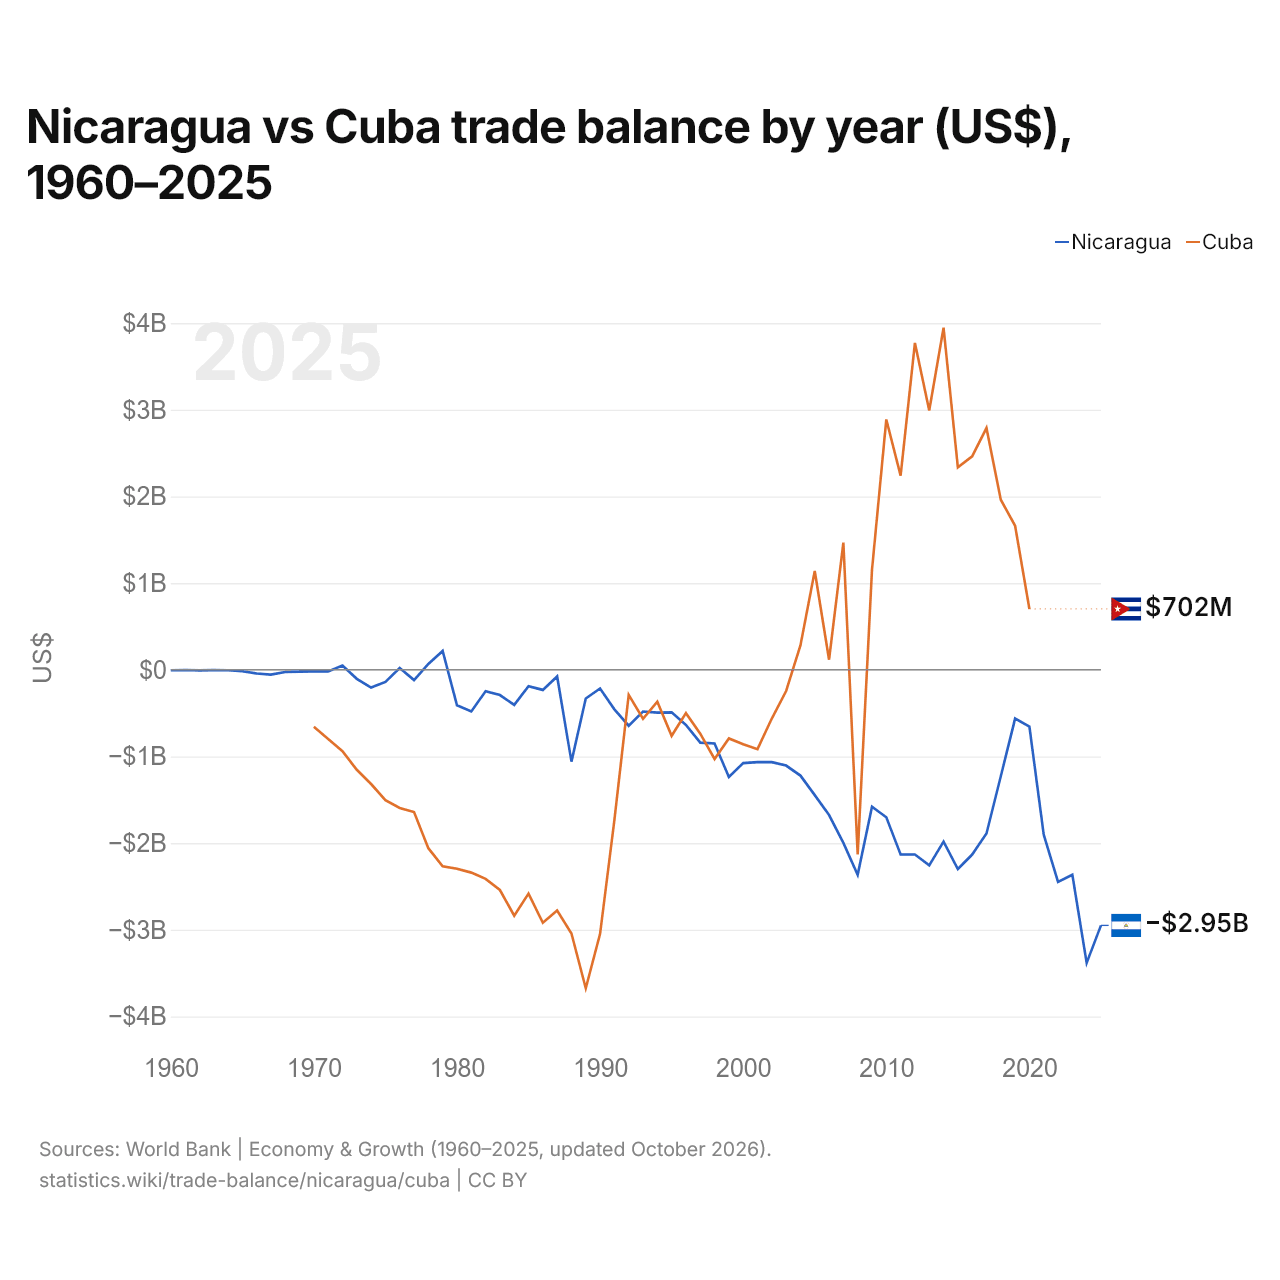
Nicaragua vs Cuba : balance commerciale par année ($ US), 1960–2025
| Année | $ US | |
|---|---|---|
 Nicaragua |
 Cuba |
|
| 2025 | −2 949 259 874 $ US | - |
| 2024 | −3 382 518 929 $ US | - |
| 2023 | −2 366 025 449 $ US | - |
| 2022 | −2 448 863 297 $ US | - |
| 2021 | −1 903 853 096 $ US | - |
| 2020 | −654 891 777 $ US | 702 000 000 $ US |
| 2019 | −562 992 970 $ US | 1 660 900 000 $ US |
| 2018 | −1 228 336 475 $ US | 1 962 900 000 $ US |
| 2017 | −1 889 032 380 $ US | 2 789 400 000 $ US |
| 2016 | −2 132 374 813 $ US | 2 463 300 000 $ US |
| 2015 | −2 299 599 631 $ US | 2 336 000 000 $ US |
| 2014 | −1 981 901 421 $ US | 3 947 000 000 $ US |
| 2013 | −2 257 626 700 $ US | 2 991 000 000 $ US |
| 2012 | −2 131 568 370 $ US | 3 771 000 000 $ US |
| 2011 | −2 130 168 232 $ US | 2 240 000 000 $ US |
| 2010 | −1 701 781 359 $ US | 2 887 962 963 $ US |
| 2009 | −1 579 294 704 $ US | 1 152 777 778 $ US |
| 2008 | −2 366 665 545 $ US | −2 129 351 852 $ US |
| 2007 | −1 996 782 775 $ US | 1 467 870 370 $ US |
| 2006 | −1 675 795 410 $ US | 116 666 667 $ US |
| 2005 | −1 446 411 408 $ US | 1 140 600 000 $ US |
| 2004 | −1 220 895 660 $ US | 279 700 000 $ US |
| 2003 | −1 105 164 339 $ US | −245 300 000 $ US |
| 2002 | −1 065 484 318 $ US | −562 700 000 $ US |
| 2001 | −1 064 801 164 $ US | −916 300 000 $ US |
| 2000 | −1 077 211 608 $ US | −860 700 000 $ US |
| 1999 | −1 237 173 961 $ US | −792 500 000 $ US |
| 1998 | −850 346 785 $ US | −1 029 300 000 $ US |
| 1997 | −841 401 647 $ US | −737 200 000 $ US |
| 1996 | −637 124 339 $ US | −500 000 000 $ US |
| 1995 | −490 630 040 $ US | −762 386 442 $ US |
| 1994 | −494 544 196 $ US | −368 823 784 $ US |
| 1993 | −481 797 386 $ US | −565 312 297 $ US |
| 1992 | −645 680 000 $ US | −289 398 378 $ US |
| 1991 | −456 824 742 $ US | −1 734 684 045 $ US |
| 1990 | −215 963 871 $ US | −3 046 844 016 $ US |
| 1989 | −330 852 057 $ US | −3 675 379 469 $ US |
| 1988 | −1 059 971 933 $ US | −3 043 123 879 $ US |
| 1987 | −76 626 698 $ US | −2 777 825 258 $ US |
| 1986 | −232 459 536 $ US | −2 918 851 692 $ US |
| 1985 | −189 470 876 $ US | −2 582 425 265 $ US |
| 1984 | −405 530 301 $ US | −2 837 376 779 $ US |
| 1983 | −291 616 956 $ US | −2 541 022 934 $ US |
| 1982 | −247 325 345 $ US | −2 412 947 059 $ US |
| 1981 | −481 003 303 $ US | −2 340 543 976 $ US |
| 1980 | −408 265 314 $ US | −2 295 740 833 $ US |
| 1979 | 217 774 398 $ US | −2 268 138 219 $ US |
| 1978 | 67 243 974 $ US | −2 058 740 779 $ US |
| 1977 | −118 814 038 $ US | −1 641 618 313 $ US |
| 1976 | 21 173 553 $ US | −1 594 581 973 $ US |
| 1975 | −140 714 504 $ US | −1 505 098 537 $ US |
| 1974 | −205 881 942 $ US | −1 318 322 927 $ US |
| 1973 | −104 835 618 $ US | −1 153 937 033 $ US |
| 1972 | 49 614 513 $ US | −940 170 199 $ US |
| 1971 | −18 559 053 $ US | −799 136 000 $ US |
| 1970 | −19 148 813 $ US | −657 873 400 $ US |
| 1969 | −20 956 668 $ US | - |
| 1968 | −25 687 293 $ US | - |
| 1967 | −56 397 304 $ US | - |
| 1966 | −42 532 821 $ US | - |
| 1965 | −17 530 009 $ US | - |
| 1964 | −5 644 237 $ US | - |
| 1963 | −4 216 702 $ US | - |
| 1962 | −6 656 602 $ US | - |
| 1961 | −2 811 153 $ US | - |
| 1960 | −5 717 041 $ US | - |
La balance commerciale du Nicaragua affiche un déficit de 2,95 milliards de dollars (2025), et celle de Cuba un excédent de 702 millions de dollars (2020).
Depuis 1970, la balance commerciale du Nicaragua a été excédentaire pendant 4 des 51 années, et celle de Cuba pendant 16. Les balances commerciales du Nicaragua et de Cuba ont été déficitaires en même temps pendant 31 de ces années, la dernière fois en 2008.
Nicaragua vs Cuba : chiffres de la balance commerciale
|
Nicaragua
|
Cuba
|
|
|---|---|---|
| Biens et services, $ US | −2,95 Md $US (2025) | +702 M $US (2020) |
| % du PIB | −13,3 % (2025) | +0,7 % (2020) |
| Années d'excédent depuis 2000 | 0 sur 26 | 16 sur 21 |
| Solde des biens entre les deux, chiffres propres | +1,50 M $US (2025) | −7,91 M $US (2022) |
| Premier excédent en biens avec | États-Unis (+1,38 Md $US, 2025) | Chypre (+17,5 M $US, 2022) |
| Premier déficit en biens avec | Chine (−1,98 Md $US, 2025) | Chine (−950 M $US, 2022) |
Comparer la balance commerciale de 2 pays au choix
Sources :
- Banque mondiale | Économie et croissance (1960–2025, mis à jour en octobre 2026)
- TradeMap (2001–2025, mis à jour en octobre 2026)
Creative Commons Attribution (CC BY) : vous pouvez copier, partager, adapter et réutiliser ce contenu, y compris à des fins commerciales, à condition de citer statistics.wiki et d’indiquer les modifications apportées. Les sources citées ci-dessus peuvent avoir leurs propres conditions de licence.