
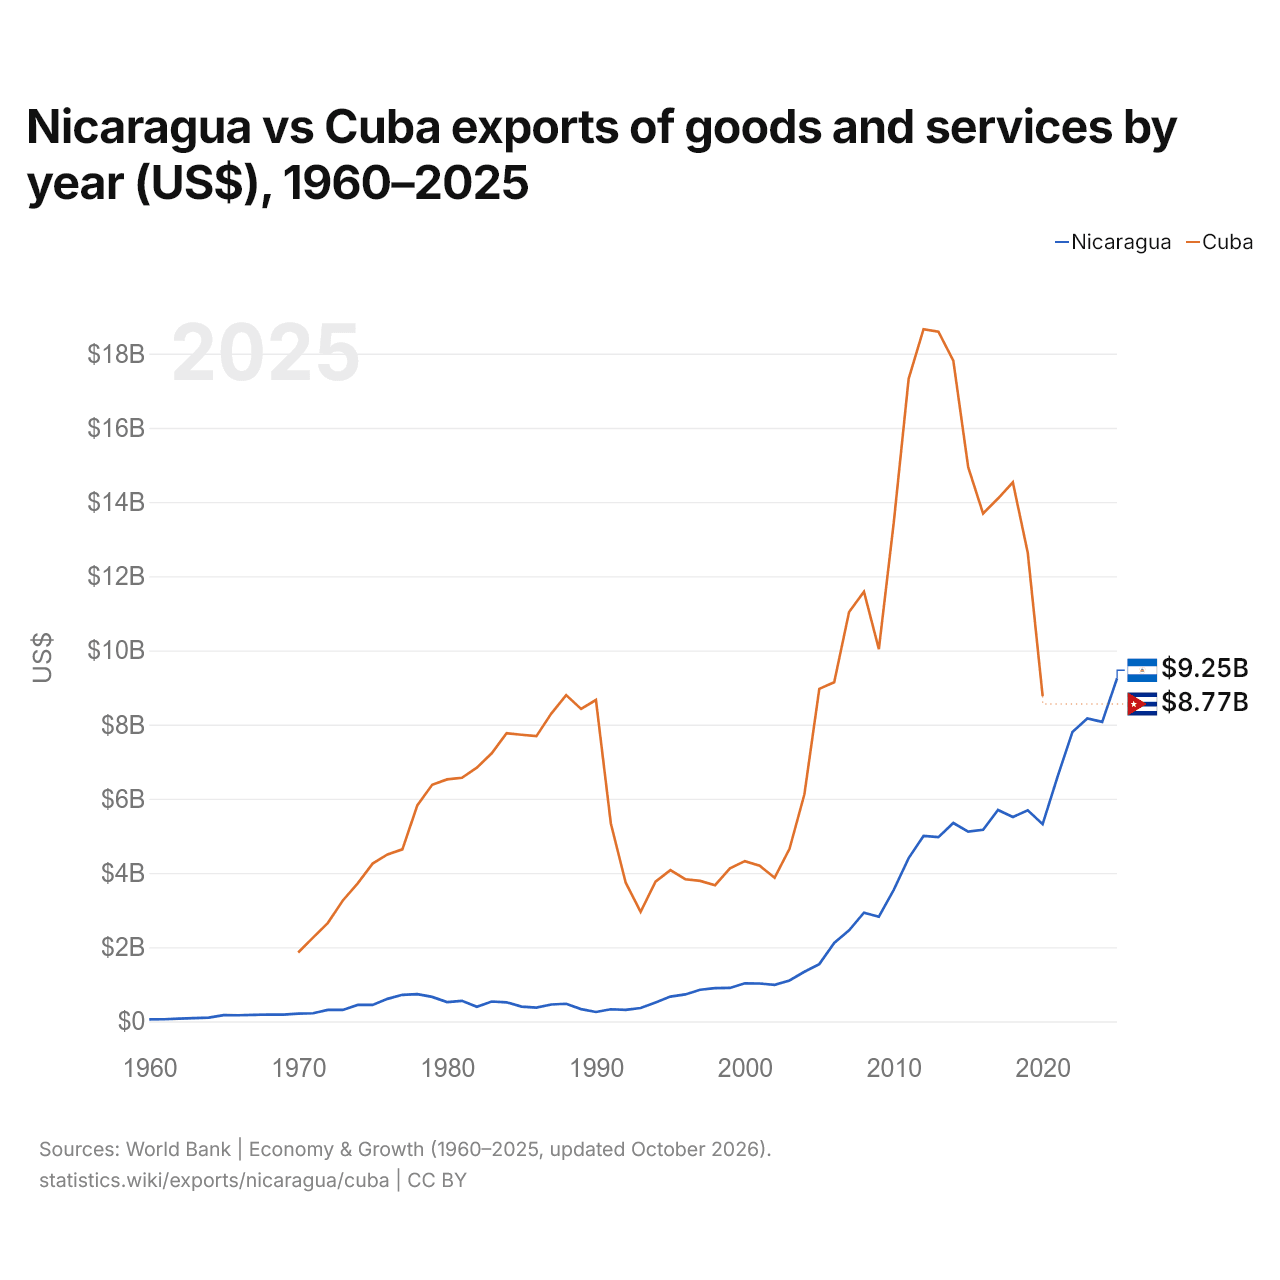
Nicaragua vs Cuba : exportations de biens et services par année ($ US), 1960–2025
| Année | $ US | |
|---|---|---|
 Nicaragua |
 Cuba |
|
| 2025 | 9 249 209 962 $ US | - |
| 2024 | 8 072 799 619 $ US | - |
| 2023 | 8 166 793 679 $ US | - |
| 2022 | 7 800 991 077 $ US | - |
| 2021 | 6 593 588 346 $ US | - |
| 2020 | 5 312 785 104 $ US | 8 769 000 000 $ US |
| 2019 | 5 689 725 119 $ US | 12 632 000 000 $ US |
| 2018 | 5 506 692 298 $ US | 14 530 000 000 $ US |
| 2017 | 5 698 946 073 $ US | 14 093 000 000 $ US |
| 2016 | 5 165 902 338 $ US | 13 689 600 000 $ US |
| 2015 | 5 113 365 846 $ US | 14 941 000 000 $ US |
| 2014 | 5 347 156 490 $ US | 17 812 000 000 $ US |
| 2013 | 4 965 877 905 $ US | 18 593 000 000 $ US |
| 2012 | 4 999 461 750 $ US | 18 659 000 000 $ US |
| 2011 | 4 400 107 700 $ US | 17 319 000 000 $ US |
| 2010 | 3 544 353 652 $ US | 13 443 518 519 $ US |
| 2009 | 2 820 023 106 $ US | 10 036 111 111 $ US |
| 2008 | 2 928 943 987 $ US | 11 580 000 000 $ US |
| 2007 | 2 454 433 020 $ US | 11 035 092 593 $ US |
| 2006 | 2 114 772 341 $ US | 9 138 888 889 $ US |
| 2005 | 1 541 273 560 $ US | 8 962 900 000 $ US |
| 2004 | 1 335 841 956 $ US | 6 120 800 000 $ US |
| 2003 | 1 101 967 322 $ US | 4 649 900 000 $ US |
| 2002 | 984 522 983 $ US | 3 872 000 000 $ US |
| 2001 | 1 019 075 853 $ US | 4 193 000 000 $ US |
| 2000 | 1 027 444 240 $ US | 4 318 900 000 $ US |
| 1999 | 899 835 239 $ US | 4 123 500 000 $ US |
| 1998 | 896 218 483 $ US | 3 668 100 000 $ US |
| 1997 | 852 512 885 $ US | 3 785 600 000 $ US |
| 1996 | 725 843 474 $ US | 3 831 000 000 $ US |
| 1995 | 666 412 218 $ US | 4 078 053 747 $ US |
| 1994 | 507 617 768 $ US | 3 766 477 027 $ US |
| 1993 | 358 807 190 $ US | 2 951 182 568 $ US |
| 1992 | 309 280 000 $ US | 3 736 544 459 $ US |
| 1991 | 324 886 598 $ US | 5 332 907 602 $ US |
| 1990 | 251 842 581 $ US | 8 662 106 516 $ US |
| 1989 | 329 660 036 $ US | 8 421 585 288 $ US |
| 1988 | 473 058 950 $ US | 8 794 332 850 $ US |
| 1987 | 453 312 553 $ US | 8 295 404 426 $ US |
| 1986 | 368 698 848 $ US | 7 687 511 279 $ US |
| 1985 | 396 280 490 $ US | 7 725 366 416 $ US |
| 1984 | 512 628 154 $ US | 7 766 066 363 $ US |
| 1983 | 534 109 825 $ US | 7 224 138 184 $ US |
| 1982 | 392 200 153 $ US | 6 838 236 471 $ US |
| 1981 | 552 951 120 $ US | 6 565 420 000 $ US |
| 1980 | 519 538 168 $ US | 6 521 956 667 $ US |
| 1979 | 658 777 312 $ US | 6 377 068 904 $ US |
| 1978 | 732 135 142 $ US | 5 819 724 675 $ US |
| 1977 | 714 673 957 $ US | 4 635 330 843 $ US |
| 1976 | 606 080 025 $ US | 4 499 232 765 $ US |
| 1975 | 443 524 241 $ US | 4 251 739 756 $ US |
| 1974 | 442 345 370 $ US | 3 719 910 244 $ US |
| 1973 | 308 310 585 $ US | 3 258 402 051 $ US |
| 1972 | 310 040 793 $ US | 2 654 199 161 $ US |
| 1971 | 217 911 328 $ US | 2 255 959 900 $ US |
| 1970 | 208 130 437 $ US | 1 857 363 400 $ US |
| 1969 | 182 894 687 $ US | - |
| 1968 | 184 888 776 $ US | - |
| 1967 | 173 891 684 $ US | - |
| 1966 | 164 627 049 $ US | - |
| 1965 | 165 339 903 $ US | - |
| 1964 | 100 227 288 $ US | - |
| 1963 | 85 701 582 $ US | - |
| 1962 | 71 175 904 $ US | - |
| 1961 | 57 134 379 $ US | - |
| 1960 | 53 745 065 $ US | - |
Les exportations de biens et services du Nicaragua s'élèvent à 9,25 milliards de dollars (2025), et celles de Cuba à 8,77 milliards de dollars (2020). En 1970, les exportations de Cuba étaient 8,9 fois plus élevées : 208 millions de dollars pour le Nicaragua et 1,86 milliard de dollars pour Cuba.
Les exportations de biens et services de Cuba sont supérieures à celles du Nicaragua chaque année depuis 1970.
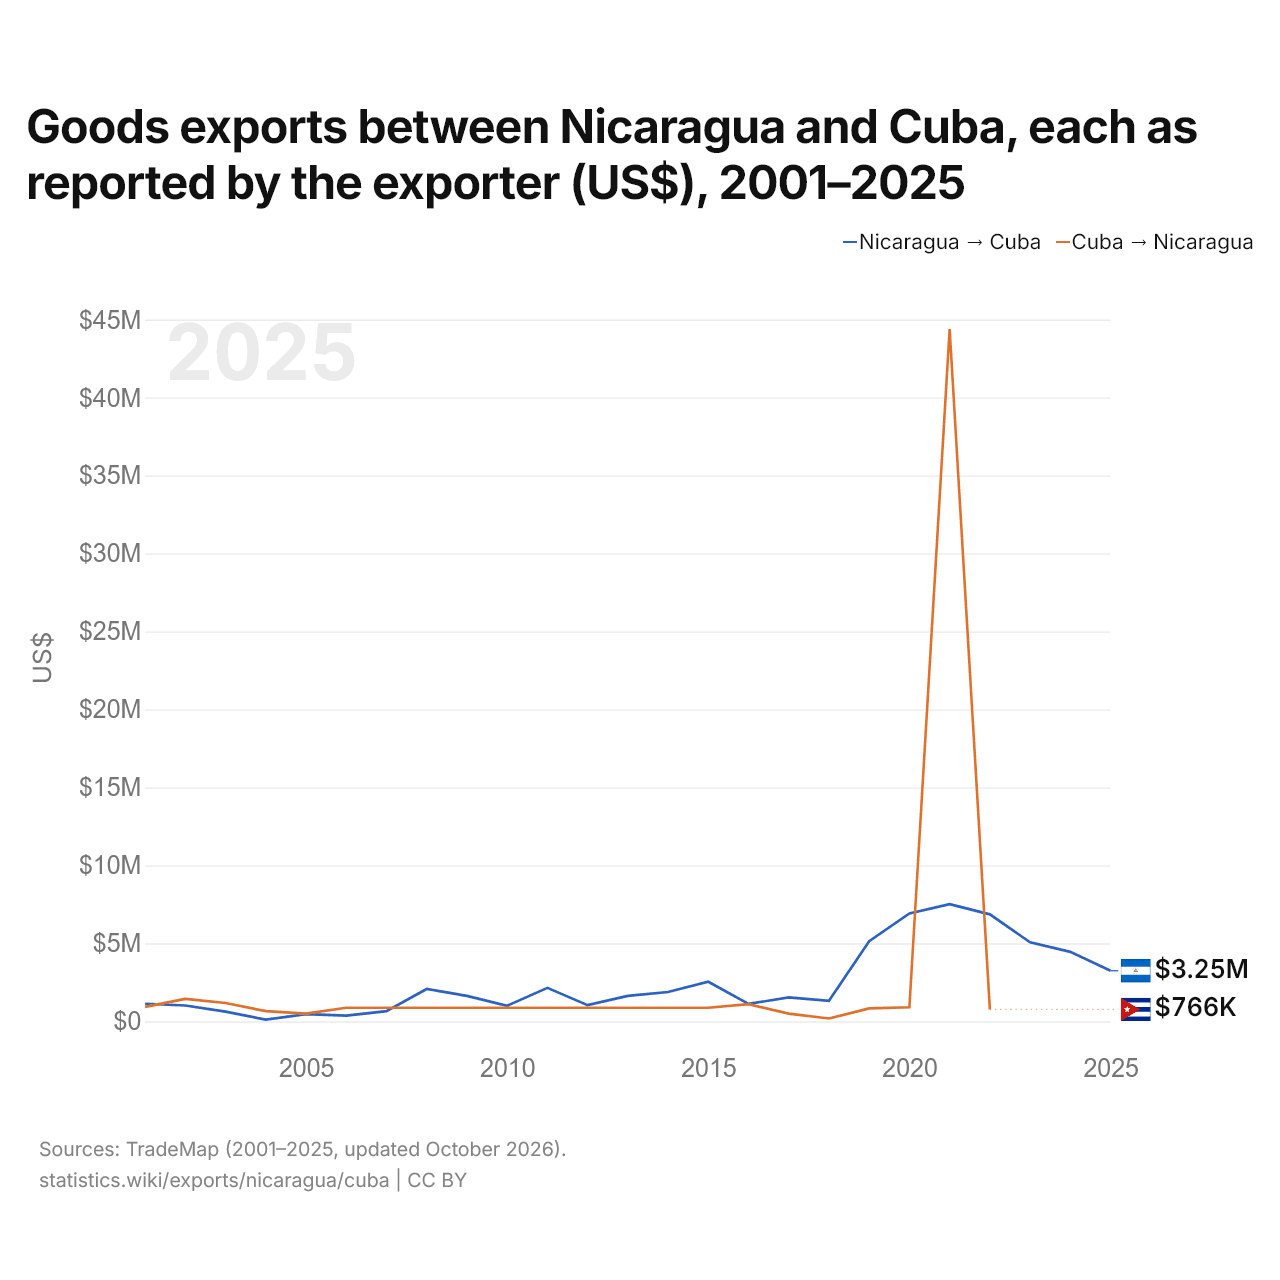
Exportations de biens entre le Nicaragua et Cuba, selon chaque exportateur ($ US), 2001–2025
| Année | $ US | |
|---|---|---|
| Nicaragua → Cuba | Cuba → Nicaragua | |
| 2025 | 3 245 000 $ US | - |
| 2024 | 4 454 000 $ US | - |
| 2023 | 5 070 000 $ US | - |
| 2022 | 6 861 000 $ US | 766 000 $ US |
| 2021 | 7 517 000 $ US | 44 382 000 $ US |
| 2020 | 6 922 000 $ US | 901 000 $ US |
| 2019 | 5 137 000 $ US | 833 000 $ US |
| 2018 | 1 319 000 $ US | 181 000 $ US |
| 2017 | 1 533 000 $ US | 495 000 $ US |
| 2016 | 1 116 000 $ US | 1 103 000 $ US |
| 2015 | 2 539 000 $ US | 871 000 $ US |
| 2014 | 1 881 000 $ US | 871 000 $ US |
| 2013 | 1 634 000 $ US | 871 000 $ US |
| 2012 | 1 037 000 $ US | 871 000 $ US |
| 2011 | 2 146 000 $ US | 871 000 $ US |
| 2010 | 997 000 $ US | 871 000 $ US |
| 2009 | 1 633 000 $ US | 871 000 $ US |
| 2008 | 2 073 000 $ US | 871 000 $ US |
| 2007 | 656 000 $ US | 871 000 $ US |
| 2006 | 370 000 $ US | 871 000 $ US |
| 2005 | 458 000 $ US | 491 000 $ US |
| 2004 | 106 000 $ US | 652 000 $ US |
| 2003 | 623 000 $ US | 1 174 000 $ US |
| 2002 | 1 013 000 $ US | 1 436 000 $ US |
| 2001 | 1 129 000 $ US | 929 000 $ US |
Les exportations de biens du Nicaragua vers Cuba, selon le Nicaragua, s'élevaient à 6,86 millions de dollars, et celles de Cuba vers le Nicaragua, selon Cuba, à 766 000 dollars : 9,0 fois plus pour celles du Nicaragua. En 2001, elles s'élevaient à 1,13 million de dollars pour le Nicaragua et à 929 000 dollars pour Cuba.
Nicaragua vs Cuba : chiffres des exportations
|
Nicaragua
|
Cuba
|
|
|---|---|---|
| Exportations | 9,25 Md $US (2025) | 8,77 Md $US (2020) |
| Rang mondial | 114/176 | 117/176 |
| Part mondiale | 0,03 % | 0,04 % |
| % du PIB | 41,6 % | 8,2 % |
| Première catégorie de biens | Métaux précieux, pierres précieuses, bijoux, montres, instruments de musique et art (23 %, 2025) | Métaux communs (fer, acier, cuivre, aluminium) (53,4 %, 2022) |
| Première destination des biens | États-Unis (46,1 %, 2025) | Espagne (16 %, 2022) |
Comparer les exportations de 2 pays au choix
Sources :
- Banque mondiale | Économie et croissance (1960–2025, mis à jour en octobre 2026)
- TradeMap (2001–2025, mis à jour en octobre 2026)
Creative Commons Attribution (CC BY) : vous pouvez copier, partager, adapter et réutiliser ce contenu, y compris à des fins commerciales, à condition de citer statistics.wiki et d’indiquer les modifications apportées. Les sources citées ci-dessus peuvent avoir leurs propres conditions de licence.