
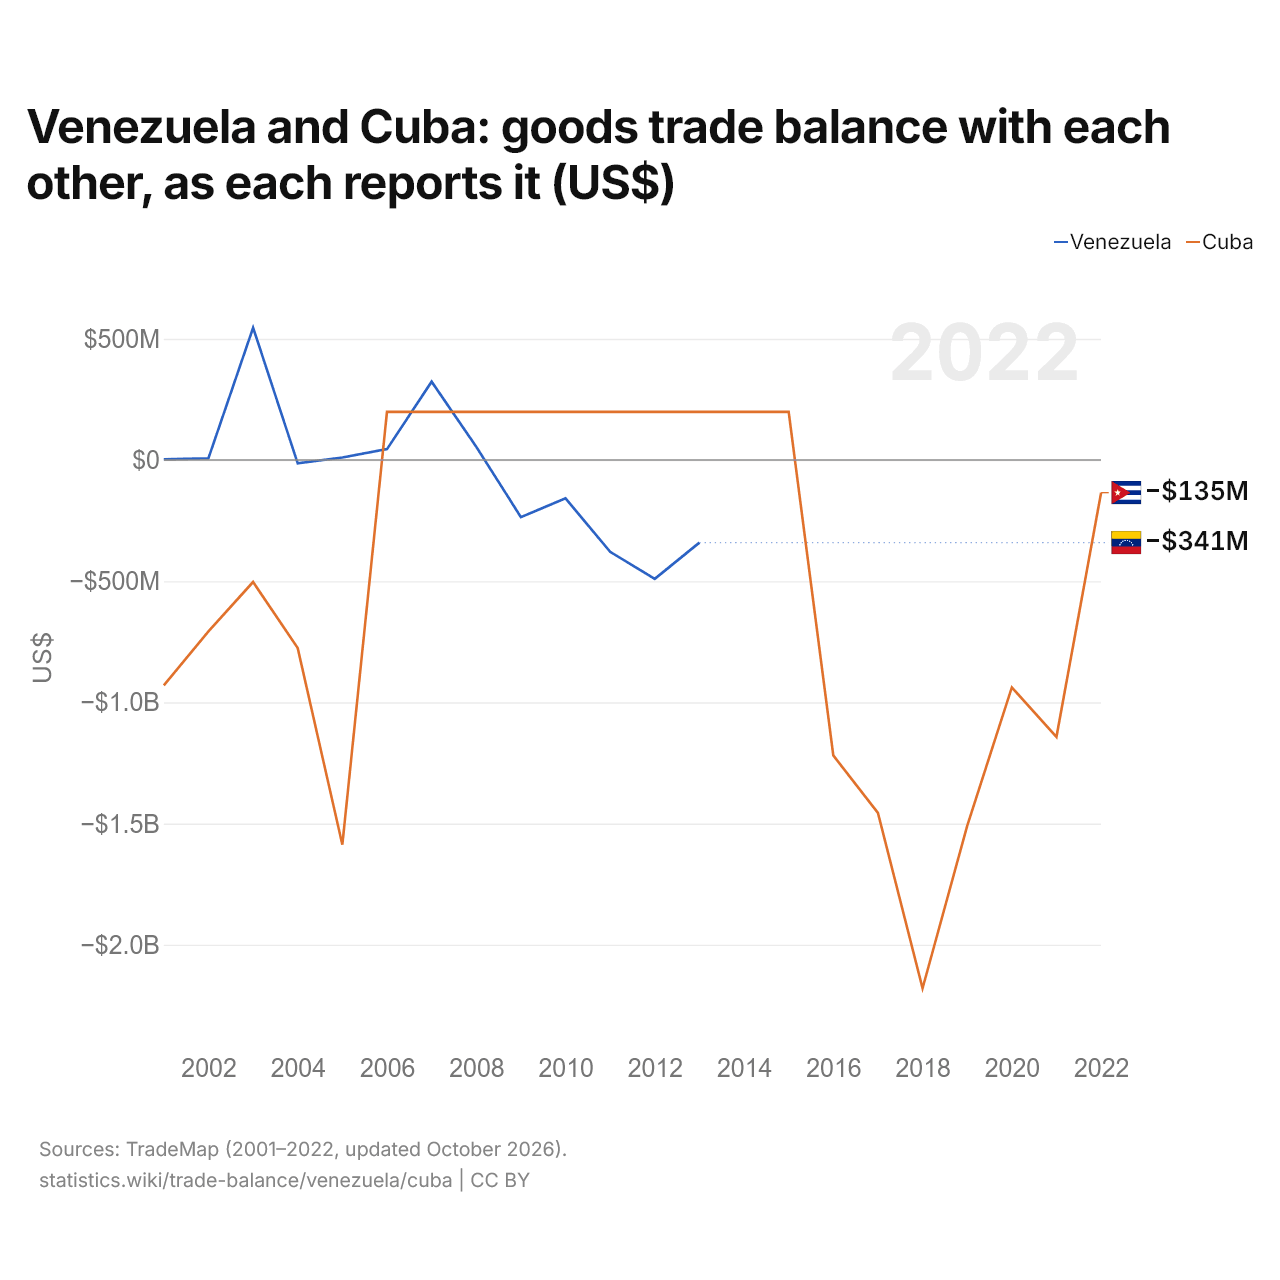
Le Venezuela et Cuba : solde de leur commerce de biens bilatéral, selon chacun ($ US)
| Année | $ US | |
|---|---|---|
| Venezuela | Cuba | |
| 2022 | - | −134 779 000 $ US |
| 2021 | - | −1 142 371 000 $ US |
| 2020 | - | −938 363 000 $ US |
| 2019 | - | −1 509 228 000 $ US |
| 2018 | - | −2 179 730 000 $ US |
| 2017 | - | −1 456 022 000 $ US |
| 2016 | - | −1 219 058 000 $ US |
| 2015 | - | 198 248 000 $ US |
| 2014 | - | 198 248 000 $ US |
| 2013 | −340 798 000 $ US | 198 248 000 $ US |
| 2012 | −490 669 000 $ US | 198 248 000 $ US |
| 2011 | −378 888 000 $ US | 198 248 000 $ US |
| 2010 | −158 323 000 $ US | 198 248 000 $ US |
| 2009 | −235 711 000 $ US | 198 248 000 $ US |
| 2008 | 54 926 000 $ US | 198 248 000 $ US |
| 2007 | 323 149 000 $ US | 198 248 000 $ US |
| 2006 | 44 706 000 $ US | 198 248 000 $ US |
| 2005 | 10 068 000 $ US | −1 587 374 000 $ US |
| 2004 | −14 020 000 $ US | −776 045 000 $ US |
| 2003 | 545 811 000 $ US | −503 288 000 $ US |
| 2002 | 7 220 000 $ US | −706 741 000 $ US |
| 2001 | 2 485 000 $ US | −929 657 000 $ US |
Selon le Venezuela, son commerce de biens avec Cuba affichait un déficit de 341 millions de dollars ; selon Cuba, son commerce de biens avec le Venezuela affichait un excédent de 198 millions de dollars. En 2001, les chiffres étaient un excédent de 2,49 millions de dollars pour le Venezuela et un déficit de 930 millions de dollars pour Cuba.
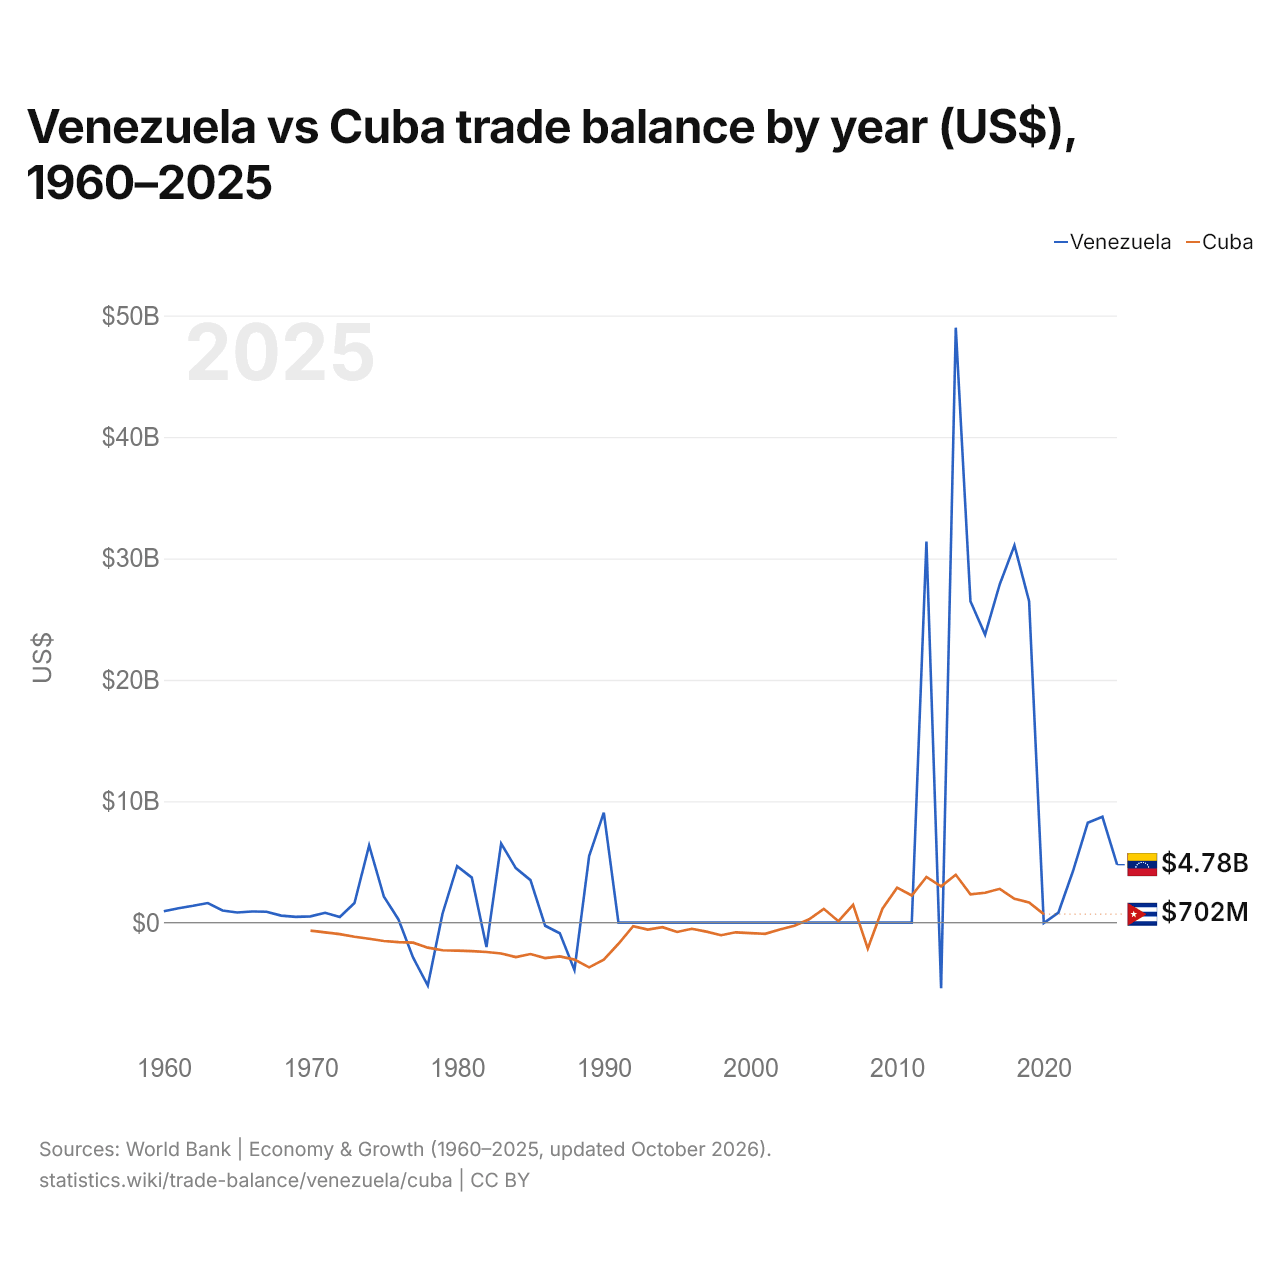
Venezuela vs Cuba : balance commerciale par année ($ US), 1960–2025
| Année | $ US | |
|---|---|---|
 Venezuela |
 Cuba |
|
| 2025 | 4 778 560 653 $ US | - |
| 2024 | 8 720 159 720 $ US | - |
| 2023 | 8 229 411 761 $ US | - |
| 2022 | 4 272 755 670 $ US | - |
| 2021 | 834 346 180 $ US | - |
| 2020 | −34 132 875 $ US | 702 000 000 $ US |
| 2019 | 26 476 840 424 $ US | 1 660 900 000 $ US |
| 2018 | 31 066 235 864 $ US | 1 962 900 000 $ US |
| 2017 | 27 874 138 562 $ US | 2 789 400 000 $ US |
| 2016 | 23 722 233 639 $ US | 2 463 300 000 $ US |
| 2015 | 26 467 912 241 $ US | 2 336 000 000 $ US |
| 2014 | 48 997 528 952 $ US | 3 947 000 000 $ US |
| 2013 | −5 403 332 873 $ US | 2 991 000 000 $ US |
| 2012 | 31 381 274 617 $ US | 3 771 000 000 $ US |
| 2011 | 0 $ US | 2 240 000 000 $ US |
| 2010 | 0 $ US | 2 887 962 963 $ US |
| 2009 | 0 $ US | 1 152 777 778 $ US |
| 2008 | 0 $ US | −2 129 351 852 $ US |
| 2007 | 0 $ US | 1 467 870 370 $ US |
| 2006 | 0 $ US | 116 666 667 $ US |
| 2005 | 0 $ US | 1 140 600 000 $ US |
| 2004 | 0 $ US | 279 700 000 $ US |
| 2003 | 0 $ US | −245 300 000 $ US |
| 2002 | 0 $ US | −562 700 000 $ US |
| 2001 | 0 $ US | −916 300 000 $ US |
| 2000 | 0 $ US | −860 700 000 $ US |
| 1999 | 0 $ US | −792 500 000 $ US |
| 1998 | 0 $ US | −1 029 300 000 $ US |
| 1997 | 0 $ US | −737 200 000 $ US |
| 1996 | 0 $ US | −500 000 000 $ US |
| 1995 | 0 $ US | −762 386 442 $ US |
| 1994 | 0 $ US | −368 823 784 $ US |
| 1993 | 0 $ US | −565 312 297 $ US |
| 1992 | 0 $ US | −289 398 378 $ US |
| 1991 | 0 $ US | −1 734 684 045 $ US |
| 1990 | 9 061 996 090 $ US | −3 046 844 016 $ US |
| 1989 | 5 491 872 208 $ US | −3 675 379 469 $ US |
| 1988 | −3 892 310 345 $ US | −3 043 123 879 $ US |
| 1987 | −877 193 103 $ US | −2 777 825 258 $ US |
| 1986 | −251 764 948 $ US | −2 918 851 692 $ US |
| 1985 | 3 506 506 667 $ US | −2 582 425 265 $ US |
| 1984 | 4 494 997 625 $ US | −2 837 376 779 $ US |
| 1983 | 6 526 279 070 $ US | −2 541 022 934 $ US |
| 1982 | −2 002 883 721 $ US | −2 412 947 059 $ US |
| 1981 | 3 713 232 558 $ US | −2 340 543 976 $ US |
| 1980 | 4 658 418 605 $ US | −2 295 740 833 $ US |
| 1979 | 720 139 535 $ US | −2 268 138 219 $ US |
| 1978 | −5 176 000 000 $ US | −2 058 740 779 $ US |
| 1977 | −2 880 558 140 $ US | −1 641 618 313 $ US |
| 1976 | 270 069 767 $ US | −1 594 581 973 $ US |
| 1975 | 2 160 418 605 $ US | −1 505 098 537 $ US |
| 1974 | 6 368 744 186 $ US | −1 318 322 927 $ US |
| 1973 | 1 620 302 326 $ US | −1 153 937 033 $ US |
| 1972 | 461 863 636 $ US | −940 170 199 $ US |
| 1971 | 813 750 000 $ US | −799 136 000 $ US |
| 1970 | 516 111 111 $ US | −657 873 400 $ US |
| 1969 | 473 111 111 $ US | - |
| 1968 | 580 600 000 $ US | - |
| 1967 | 903 177 778 $ US | - |
| 1966 | 924 688 889 $ US | - |
| 1965 | 838 644 444 $ US | - |
| 1964 | 998 252 874 $ US | - |
| 1963 | 1 619 952 235 $ US | - |
| 1962 | 1 390 138 323 $ US | - |
| 1961 | 1 191 969 750 $ US | - |
| 1960 | 941 520 090 $ US | - |
La balance commerciale du Venezuela affiche un excédent de 4,78 milliards de dollars (2025), et celle de Cuba un excédent de 702 millions de dollars (2020).
Sur les années depuis 1970 que les deux pays ont communiquées, la balance commerciale du Venezuela a été excédentaire pendant 22 des 30 années, et celle de Cuba pendant 9. Les balances commerciales du Venezuela et de Cuba ont été déficitaires en même temps pendant 6 de ces années, la dernière fois en 1988.
Venezuela vs Cuba : chiffres de la balance commerciale
|
Venezuela
|
Cuba
|
|
|---|---|---|
| Biens et services, $ US | +4,78 Md $US (2025) | +702 M $US (2020) |
| % du PIB | +4,8 % (2025) | +0,7 % (2020) |
| Années d'excédent depuis 2000 | 12 sur 26 | 16 sur 21 |
| Solde des biens entre les deux, chiffres propres | n.d. | −135 M $US (2022) |
| Premier excédent en biens avec | n.d. | Chypre (+17,5 M $US, 2022) |
| Premier déficit en biens avec | n.d. | Chine (−950 M $US, 2022) |
Comparer la balance commerciale de 2 pays au choix
Sources :
- Banque mondiale | Économie et croissance (1960–2025, mis à jour en octobre 2026)
- TradeMap (2001–2022, mis à jour en octobre 2026)
Creative Commons Attribution (CC BY) : vous pouvez copier, partager, adapter et réutiliser ce contenu, y compris à des fins commerciales, à condition de citer statistics.wiki et d’indiquer les modifications apportées. Les sources citées ci-dessus peuvent avoir leurs propres conditions de licence.