
Le Venezuela et la Belgique : solde de leur commerce de biens bilatéral, selon chacun ($ US), 2001–2025
| Année | $ US | |
|---|---|---|
| Venezuela | Belgique | |
| 2025 | - | 30 724 000 $ US |
| 2024 | - | 59 130 000 $ US |
| 2023 | - | 22 425 000 $ US |
| 2022 | - | 31 259 000 $ US |
| 2021 | - | 171 000 $ US |
| 2020 | - | 287 219 000 $ US |
| 2019 | - | −254 259 000 $ US |
| 2018 | - | −191 029 000 $ US |
| 2017 | - | −53 288 000 $ US |
| 2016 | - | 23 691 000 $ US |
| 2015 | - | 43 463 000 $ US |
| 2014 | - | −136 796 000 $ US |
| 2013 | −157 038 000 $ US | 5 581 000 $ US |
| 2012 | −272 600 000 $ US | −120 125 000 $ US |
| 2011 | −135 343 000 $ US | −480 102 000 $ US |
| 2010 | 106 485 000 $ US | −346 410 000 $ US |
| 2009 | −135 727 000 $ US | −222 233 000 $ US |
| 2008 | −164 449 000 $ US | −398 538 000 $ US |
| 2007 | −94 879 000 $ US | −349 041 000 $ US |
| 2006 | −100 796 000 $ US | −326 391 000 $ US |
| 2005 | −219 730 000 $ US | −194 676 000 $ US |
| 2004 | −118 230 000 $ US | −81 846 000 $ US |
| 2003 | 40 615 000 $ US | −104 891 000 $ US |
| 2002 | −13 284 000 $ US | −64 978 000 $ US |
| 2001 | −18 780 000 $ US | −17 489 000 $ US |
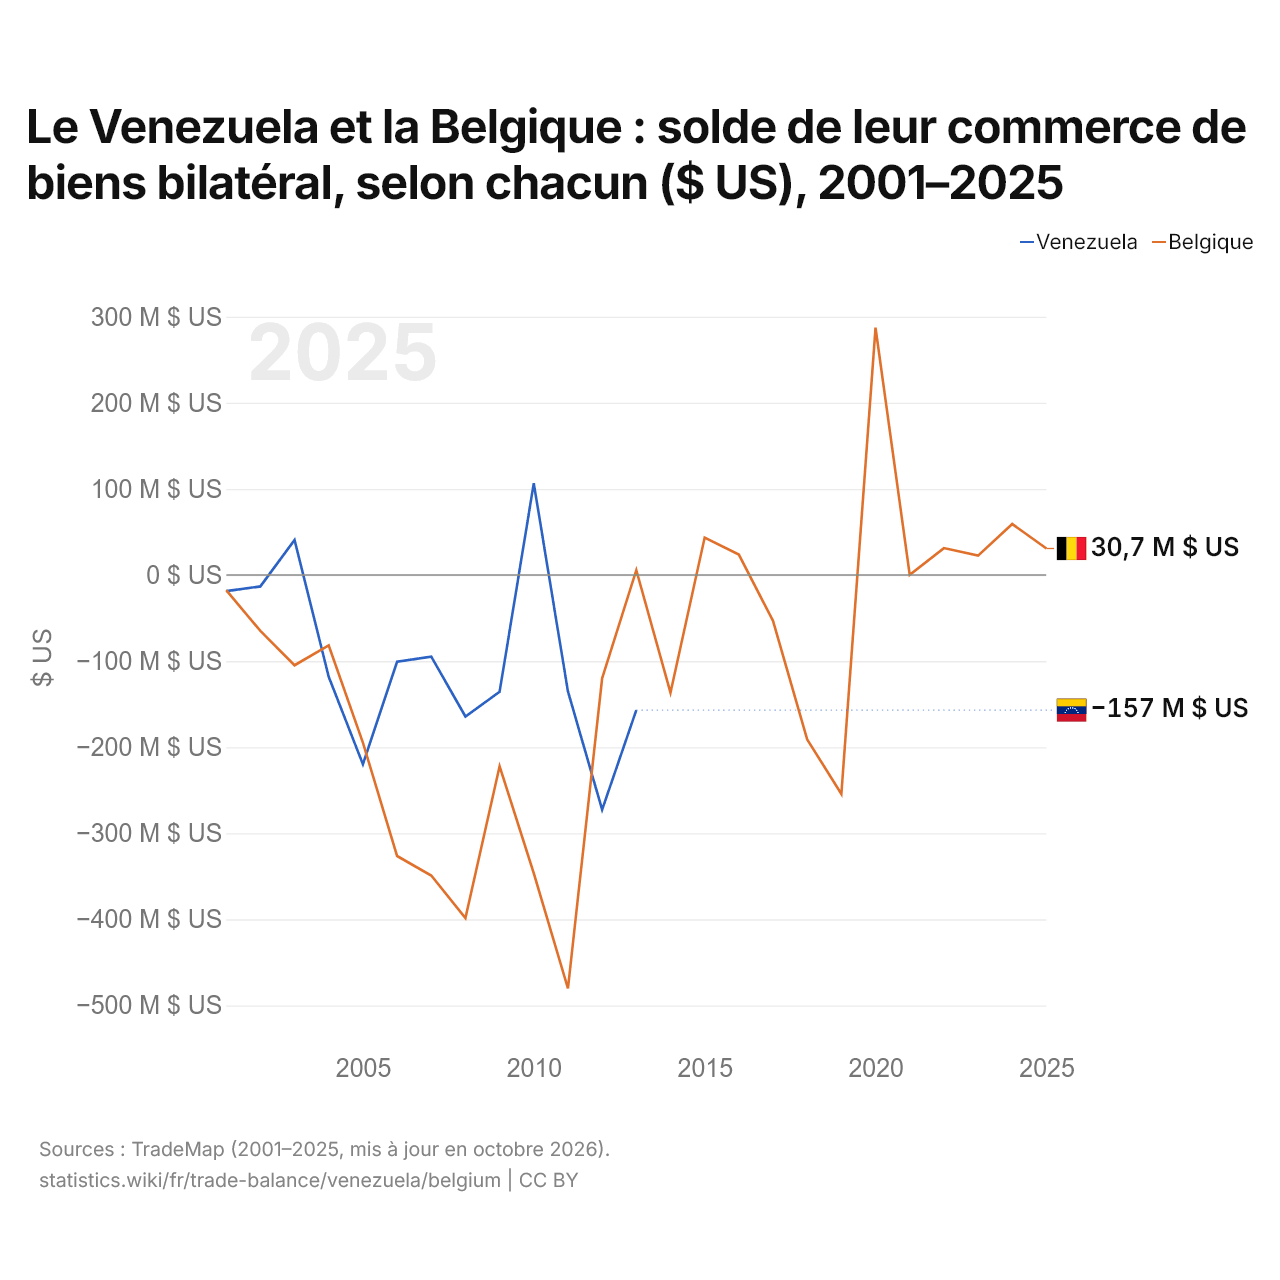
Selon le Venezuela, son commerce de biens avec la Belgique affichait un déficit de 157 millions de dollars ; selon la Belgique, son commerce de biens avec le Venezuela affichait un excédent de 5,58 millions de dollars. En 2001, les chiffres étaient un déficit de 18,8 millions de dollars pour le Venezuela et un déficit de 17,5 millions de dollars pour la Belgique.
Venezuela vs Belgique : balance commerciale par année ($ US), 1960–2025
| Année | $ US | |
|---|---|---|
 Venezuela |
 Belgique |
|
| 2025 | 4 778 560 653 $ US | −14 637 349 567 $ US |
| 2024 | 8 720 159 720 $ US | −2 589 378 795 $ US |
| 2023 | 8 229 411 761 $ US | −2 348 299 205 $ US |
| 2022 | 4 272 755 670 $ US | −13 809 679 840 $ US |
| 2021 | 834 346 180 $ US | 11 185 411 660 $ US |
| 2020 | −34 132 875 $ US | 7 646 774 510 $ US |
| 2019 | 26 476 840 424 $ US | 2 519 265 437 $ US |
| 2018 | 31 066 235 864 $ US | −7 117 140 449 $ US |
| 2017 | 27 874 138 562 $ US | −76 479 416 $ US |
| 2016 | 23 722 233 639 $ US | 846 891 572 $ US |
| 2015 | 26 467 912 241 $ US | 3 166 438 839 $ US |
| 2014 | 48 997 528 952 $ US | 1 191 266 653 $ US |
| 2013 | −5 403 332 873 $ US | 1 306 071 280 $ US |
| 2012 | 31 381 274 617 $ US | −1 422 261 060 $ US |
| 2011 | 0 $ US | −1 174 531 842 $ US |
| 2010 | 0 $ US | 7 194 531 778 $ US |
| 2009 | 0 $ US | 9 960 978 144 $ US |
| 2008 | 0 $ US | 3 480 542 817 $ US |
| 2007 | 0 $ US | 19 473 396 555 $ US |
| 2006 | 0 $ US | 16 503 842 056 $ US |
| 2005 | 0 $ US | 15 569 789 759 $ US |
| 2004 | 0 $ US | 18 069 920 173 $ US |
| 2003 | 0 $ US | 17 041 157 540 $ US |
| 2002 | 0 $ US | 14 411 205 478 $ US |
| 2001 | 0 $ US | 8 634 316 460 $ US |
| 2000 | 0 $ US | 6 783 287 644 $ US |
| 1999 | 0 $ US | 10 216 533 029 $ US |
| 1998 | 0 $ US | 9 409 313 181 $ US |
| 1997 | 0 $ US | 9 815 741 994 $ US |
| 1996 | 0 $ US | 8 856 286 645 $ US |
| 1995 | 0 $ US | 11 089 490 969 $ US |
| 1994 | 0 $ US | 8 858 973 957 $ US |
| 1993 | 0 $ US | 7 197 266 791 $ US |
| 1992 | 0 $ US | 5 983 582 183 $ US |
| 1991 | 0 $ US | 3 934 812 758 $ US |
| 1990 | 9 061 996 090 $ US | 3 612 875 423 $ US |
| 1989 | 5 491 872 208 $ US | 3 607 222 563 $ US |
| 1988 | −3 892 310 345 $ US | 3 884 174 438 $ US |
| 1987 | −877 193 103 $ US | 2 713 639 114 $ US |
| 1986 | −251 764 948 $ US | 2 687 310 818 $ US |
| 1985 | 3 506 506 667 $ US | 890 002 718 $ US |
| 1984 | 4 494 997 625 $ US | 495 069 813 $ US |
| 1983 | 6 526 279 070 $ US | 344 979 882 $ US |
| 1982 | −2 002 883 721 $ US | −1 582 876 567 $ US |
| 1981 | 3 713 232 558 $ US | −2 193 369 187 $ US |
| 1980 | 4 658 418 605 $ US | −3 577 711 408 $ US |
| 1979 | 720 139 535 $ US | −2 010 039 901 $ US |
| 1978 | −5 176 000 000 $ US | −799 154 605 $ US |
| 1977 | −2 880 558 140 $ US | −549 247 046 $ US |
| 1976 | 270 069 767 $ US | 208 368 861 $ US |
| 1975 | 2 160 418 605 $ US | 202 501 919 $ US |
| 1974 | 6 368 744 186 $ US | 288 928 128 $ US |
| 1973 | 1 620 302 326 $ US | 916 582 488 $ US |
| 1972 | 461 863 636 $ US | 1 138 651 819 $ US |
| 1971 | 813 750 000 $ US | 581 774 525 $ US |
| 1970 | 516 111 111 $ US | 583 597 418 $ US |
| 1969 | 473 111 111 $ US | - |
| 1968 | 580 600 000 $ US | - |
| 1967 | 903 177 778 $ US | - |
| 1966 | 924 688 889 $ US | - |
| 1965 | 838 644 444 $ US | - |
| 1964 | 998 252 874 $ US | - |
| 1963 | 1 619 952 235 $ US | - |
| 1962 | 1 390 138 323 $ US | - |
| 1961 | 1 191 969 750 $ US | - |
| 1960 | 941 520 090 $ US | - |
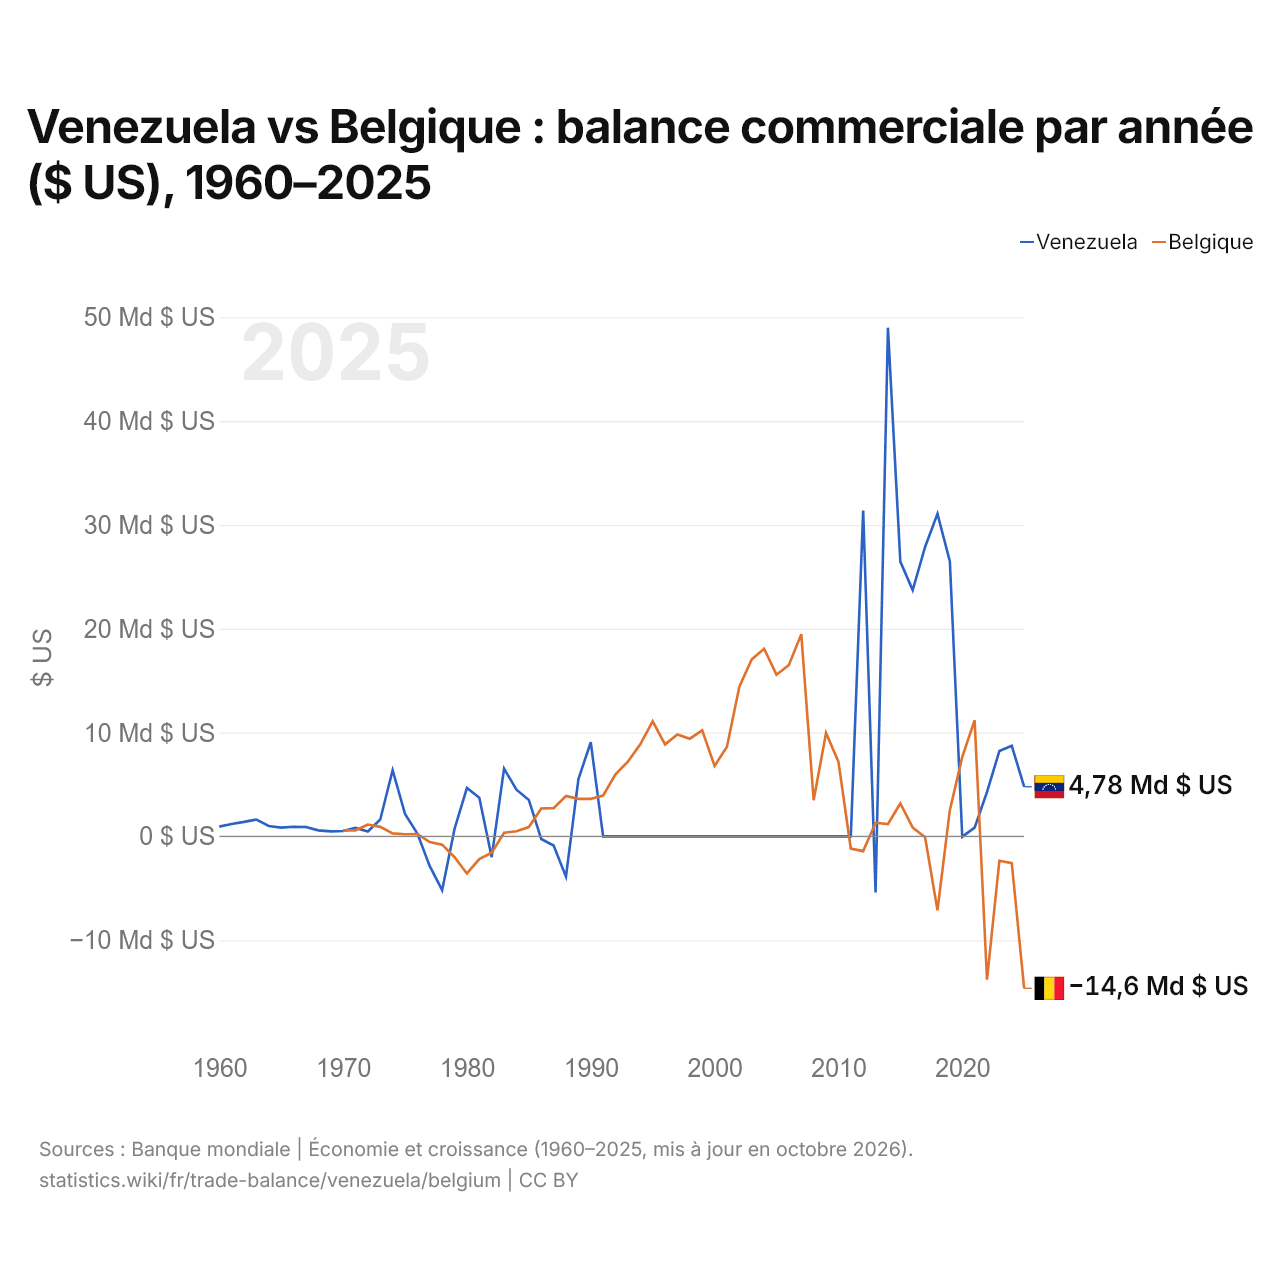
En 2025, la balance commerciale du Venezuela affichait un excédent de 4,78 milliards de dollars et celle de la Belgique un déficit de 14,6 milliards de dollars. En 1970, la balance commerciale du Venezuela affichait un excédent de 516 millions de dollars et celle de la Belgique un excédent de 584 millions de dollars.
Sur les années de 1970 à 2025 que les deux pays ont communiquées, la balance commerciale du Venezuela a été excédentaire pendant 27 des 35 années, et celle de la Belgique pendant 22. Les balances commerciales du Venezuela et de la Belgique ont été déficitaires en même temps pendant 3 de ces années, la dernière fois en 1982.
Venezuela vs Belgique : chiffres de la balance commerciale
|
Venezuela
|
Belgique
|
|
|---|---|---|
| Biens et services, $ US | +4,78 Md $US (2025) | −14,6 Md $US (2025) |
| % du PIB | +4,8 % (2025) | −2,0 % (2025) |
| Années d'excédent depuis 2000 | 12 sur 26 | 18 sur 26 |
| Solde des biens entre les deux, chiffres propres | n.d. | +30,7 M $US (2025) |
| Premier excédent en biens avec | n.d. | Allemagne (+42,1 Md $US, 2025) |
| Premier déficit en biens avec | n.d. | Pays-Bas (−33,2 Md $US, 2025) |
Comparer la balance commerciale de 2 pays au choix
Sources :
- Banque mondiale | Économie et croissance (1960–2025, mis à jour en octobre 2026)
- TradeMap (2001–2025, mis à jour en octobre 2026)
Creative Commons Attribution (CC BY) : vous pouvez copier, partager, adapter et réutiliser ce contenu, y compris à des fins commerciales, à condition de citer statistics.wiki et d’indiquer les modifications apportées. Les sources citées ci-dessus peuvent avoir leurs propres conditions de licence.