
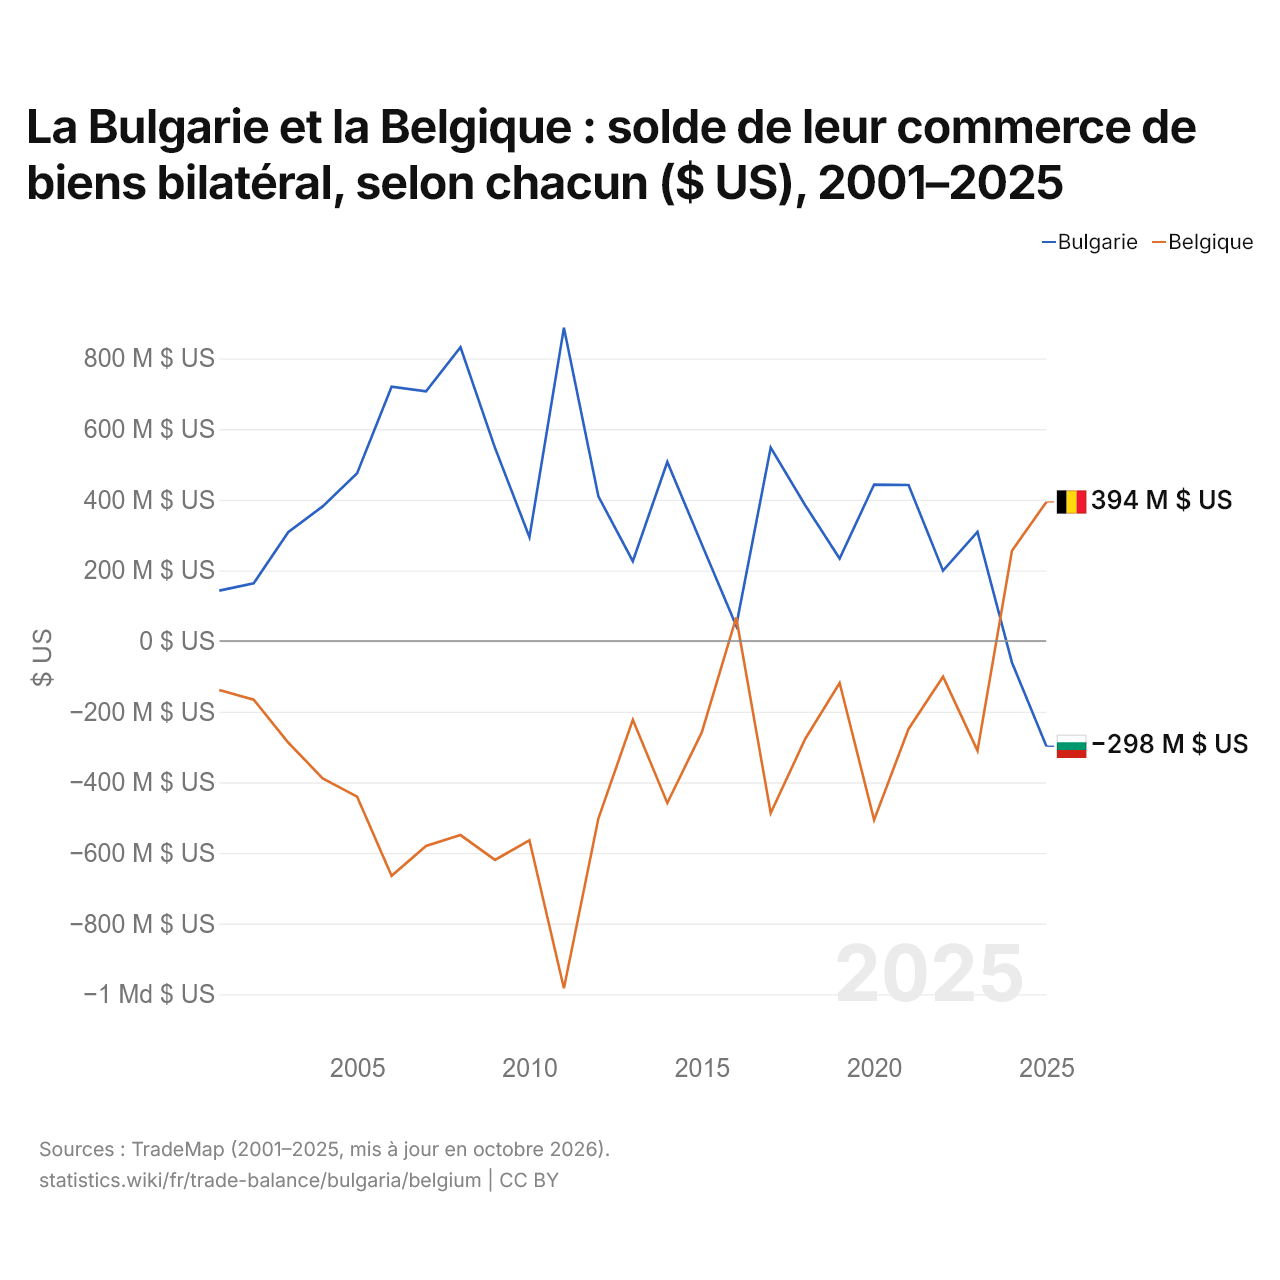
La Bulgarie et la Belgique : solde de leur commerce de biens bilatéral, selon chacun ($ US), 2001–2025
| Année | $ US | |
|---|---|---|
| Bulgarie | Belgique | |
| 2025 | −297 825 000 $ US | 393 813 000 $ US |
| 2024 | −60 667 000 $ US | 255 710 000 $ US |
| 2023 | 308 887 000 $ US | −310 515 000 $ US |
| 2022 | 199 157 000 $ US | −100 930 000 $ US |
| 2021 | 441 755 000 $ US | −248 740 000 $ US |
| 2020 | 443 085 000 $ US | −506 336 000 $ US |
| 2019 | 233 526 000 $ US | −118 670 000 $ US |
| 2018 | 384 705 000 $ US | −277 362 000 $ US |
| 2017 | 548 066 000 $ US | −487 092 000 $ US |
| 2016 | 43 129 000 $ US | 66 891 000 $ US |
| 2015 | 273 831 000 $ US | −258 692 000 $ US |
| 2014 | 507 103 000 $ US | −458 538 000 $ US |
| 2013 | 226 071 000 $ US | −222 860 000 $ US |
| 2012 | 409 587 000 $ US | −502 530 000 $ US |
| 2011 | 887 165 000 $ US | −983 227 000 $ US |
| 2010 | 294 274 000 $ US | −563 952 000 $ US |
| 2009 | 547 013 000 $ US | −619 867 000 $ US |
| 2008 | 831 935 000 $ US | −549 391 000 $ US |
| 2007 | 706 779 000 $ US | −580 268 000 $ US |
| 2006 | 719 916 000 $ US | −664 648 000 $ US |
| 2005 | 474 827 000 $ US | −440 693 000 $ US |
| 2004 | 381 239 000 $ US | −388 704 000 $ US |
| 2003 | 308 163 000 $ US | −287 244 000 $ US |
| 2002 | 163 697 000 $ US | −165 800 000 $ US |
| 2001 | 142 772 000 $ US | −138 867 000 $ US |
En 2025, selon la Bulgarie, son commerce de biens avec la Belgique affichait un déficit de 298 millions de dollars ; selon la Belgique, son commerce de biens avec la Bulgarie affichait un excédent de 394 millions de dollars. En 2001, les chiffres étaient un excédent de 143 millions de dollars pour la Bulgarie et un déficit de 139 millions de dollars pour la Belgique.
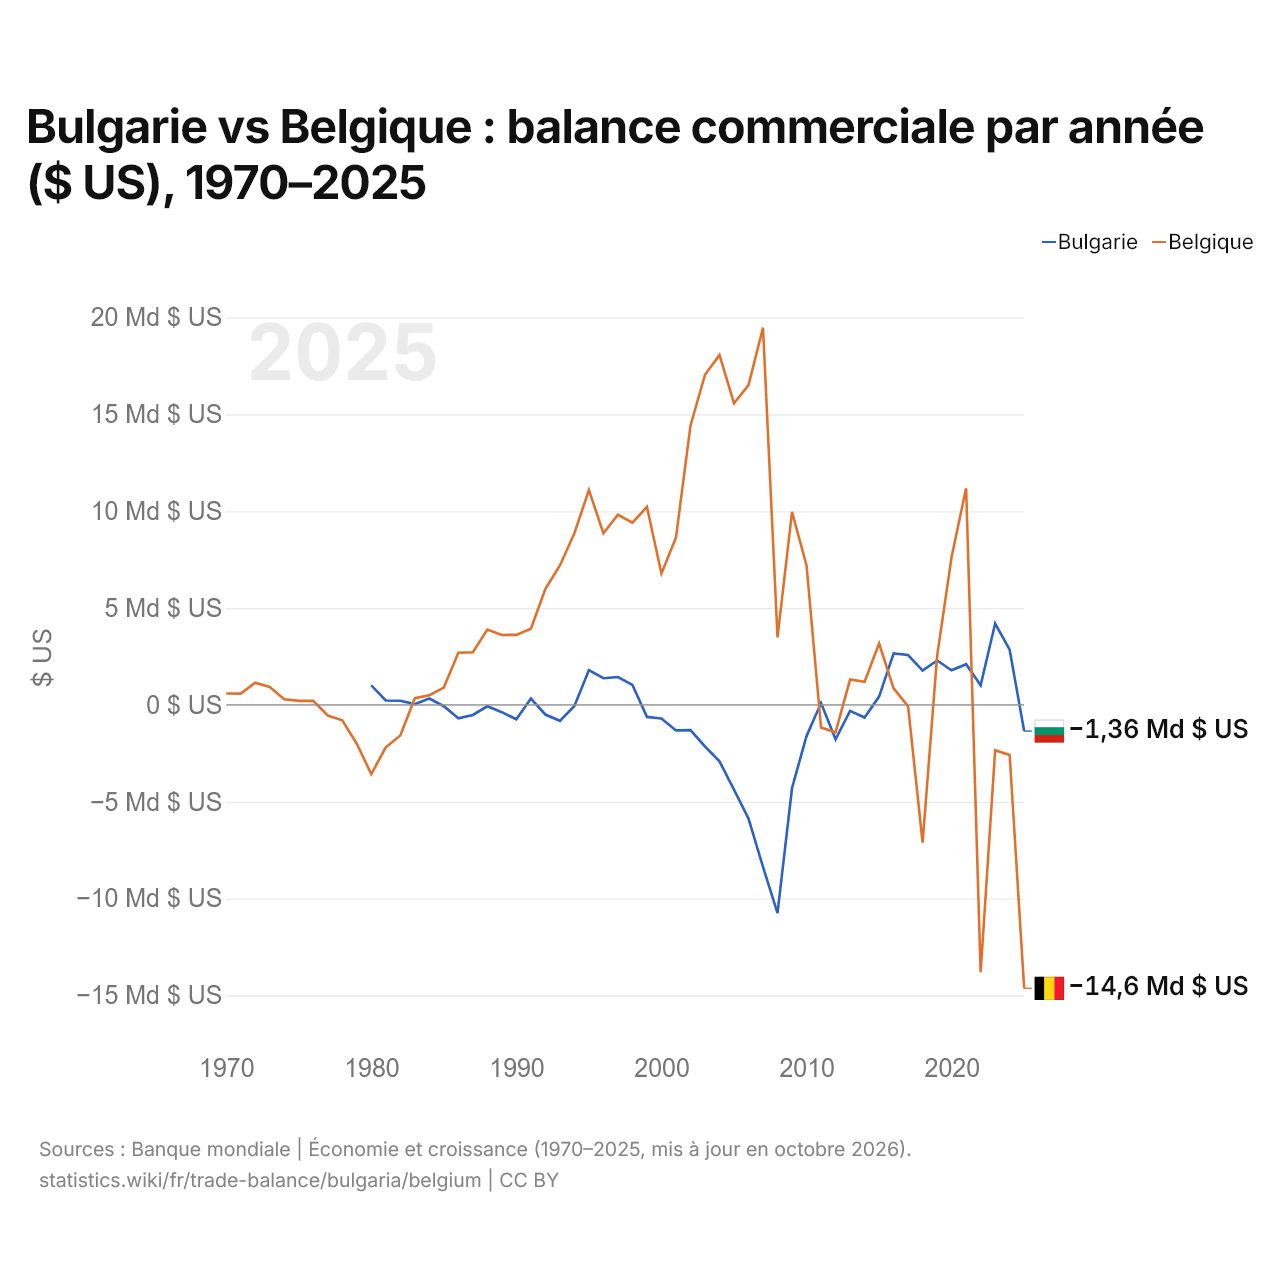
Bulgarie vs Belgique : balance commerciale par année ($ US), 1970–2025
| Année | $ US | |
|---|---|---|
 Bulgarie |
 Belgique |
|
| 2025 | −1 356 555 077 $ US | −14 637 349 567 $ US |
| 2024 | 2 849 155 149 $ US | −2 589 378 795 $ US |
| 2023 | 4 201 056 392 $ US | −2 348 299 205 $ US |
| 2022 | 1 008 354 257 $ US | −13 809 679 840 $ US |
| 2021 | 2 096 921 593 $ US | 11 185 411 660 $ US |
| 2020 | 1 780 835 295 $ US | 7 646 774 510 $ US |
| 2019 | 2 288 796 205 $ US | 2 519 265 437 $ US |
| 2018 | 1 765 497 833 $ US | −7 117 140 449 $ US |
| 2017 | 2 571 920 290 $ US | −76 479 416 $ US |
| 2016 | 2 651 492 189 $ US | 846 891 572 $ US |
| 2015 | 424 522 390 $ US | 3 166 438 839 $ US |
| 2014 | −654 613 881 $ US | 1 191 266 653 $ US |
| 2013 | −311 893 933 $ US | 1 306 071 280 $ US |
| 2012 | −1 780 368 561 $ US | −1 422 261 060 $ US |
| 2011 | 91 317 471 $ US | −1 174 531 842 $ US |
| 2010 | −1 614 240 127 $ US | 7 194 531 778 $ US |
| 2009 | −4 294 752 821 $ US | 9 960 978 144 $ US |
| 2008 | −10 751 457 358 $ US | 3 480 542 817 $ US |
| 2007 | −8 363 495 363 $ US | 19 473 396 555 $ US |
| 2006 | −5 876 520 559 $ US | 16 503 842 056 $ US |
| 2005 | −4 377 500 995 $ US | 15 569 789 759 $ US |
| 2004 | −2 916 899 455 $ US | 18 069 920 173 $ US |
| 2003 | −2 152 665 152 $ US | 17 041 157 540 $ US |
| 2002 | −1 308 209 910 $ US | 14 411 205 478 $ US |
| 2001 | −1 321 785 563 $ US | 8 634 316 460 $ US |
| 2000 | −703 130 708 $ US | 6 783 287 644 $ US |
| 1999 | −623 979 825 $ US | 10 216 533 029 $ US |
| 1998 | 1 027 798 850 $ US | 9 409 313 181 $ US |
| 1997 | 1 435 934 999 $ US | 9 815 741 994 $ US |
| 1996 | 1 373 809 678 $ US | 8 856 286 645 $ US |
| 1995 | 1 788 410 305 $ US | 11 089 490 969 $ US |
| 1994 | −60 700 528 $ US | 8 858 973 957 $ US |
| 1993 | −826 205 702 $ US | 7 197 266 791 $ US |
| 1992 | −501 279 860 $ US | 5 983 582 183 $ US |
| 1991 | 326 134 944 $ US | 3 934 812 758 $ US |
| 1990 | −747 540 351 $ US | 3 612 875 423 $ US |
| 1989 | −378 289 737 $ US | 3 607 222 563 $ US |
| 1988 | −76 266 016 $ US | 3 884 174 438 $ US |
| 1987 | −522 088 690 $ US | 2 713 639 114 $ US |
| 1986 | −696 490 666 $ US | 2 687 310 818 $ US |
| 1985 | −71 661 230 $ US | 890 002 718 $ US |
| 1984 | 327 959 669 $ US | 495 069 813 $ US |
| 1983 | 35 602 820 $ US | 344 979 882 $ US |
| 1982 | 210 946 720 $ US | −1 582 876 567 $ US |
| 1981 | 224 219 800 $ US | −2 193 369 187 $ US |
| 1980 | 1 004 560 797 $ US | −3 577 711 408 $ US |
| 1979 | - | −2 010 039 901 $ US |
| 1978 | - | −799 154 605 $ US |
| 1977 | - | −549 247 046 $ US |
| 1976 | - | 208 368 861 $ US |
| 1975 | - | 202 501 919 $ US |
| 1974 | - | 288 928 128 $ US |
| 1973 | - | 916 582 488 $ US |
| 1972 | - | 1 138 651 819 $ US |
| 1971 | - | 581 774 525 $ US |
| 1970 | - | 583 597 418 $ US |
En 2025, la balance commerciale de la Bulgarie affichait un déficit de 1,36 milliard de dollars et celle de la Belgique un déficit de 14,6 milliards de dollars ; le déficit de la Belgique était 11 fois plus grand. En 1980, la balance commerciale de la Bulgarie affichait un excédent de 1 milliard de dollars et celle de la Belgique un déficit de 3,58 milliards de dollars.
De 1980 à 2025, la balance commerciale de la Bulgarie a été excédentaire pendant 21 des 46 années, et celle de la Belgique pendant 35. Les balances commerciales de la Bulgarie et de la Belgique ont été déficitaires en même temps pendant 2 de ces années, la dernière fois en 2025.
Bulgarie vs Belgique : chiffres de la balance commerciale
|
Bulgarie
|
Belgique
|
|
|---|---|---|
| Biens et services, $ US | −1,36 Md $US (2025) | −14,6 Md $US (2025) |
| % du PIB | −1,0 % (2025) | −2,0 % (2025) |
| Années d'excédent depuis 2000 | 11 sur 26 | 18 sur 26 |
| Solde des biens entre les deux, chiffres propres | −298 M $US (2025) | +394 M $US (2025) |
| Premier excédent en biens avec | Algérie (+633 M $US, 2025) | Allemagne (+42,1 Md $US, 2025) |
| Premier déficit en biens avec | Chine (−3,74 Md $US, 2025) | Pays-Bas (−33,2 Md $US, 2025) |
Comparer la balance commerciale de 2 pays au choix
Sources :
- Banque mondiale | Économie et croissance (1970–2025, mis à jour en octobre 2026)
- TradeMap (2001–2025, mis à jour en octobre 2026)
Creative Commons Attribution (CC BY) : vous pouvez copier, partager, adapter et réutiliser ce contenu, y compris à des fins commerciales, à condition de citer statistics.wiki et d’indiquer les modifications apportées. Les sources citées ci-dessus peuvent avoir leurs propres conditions de licence.