
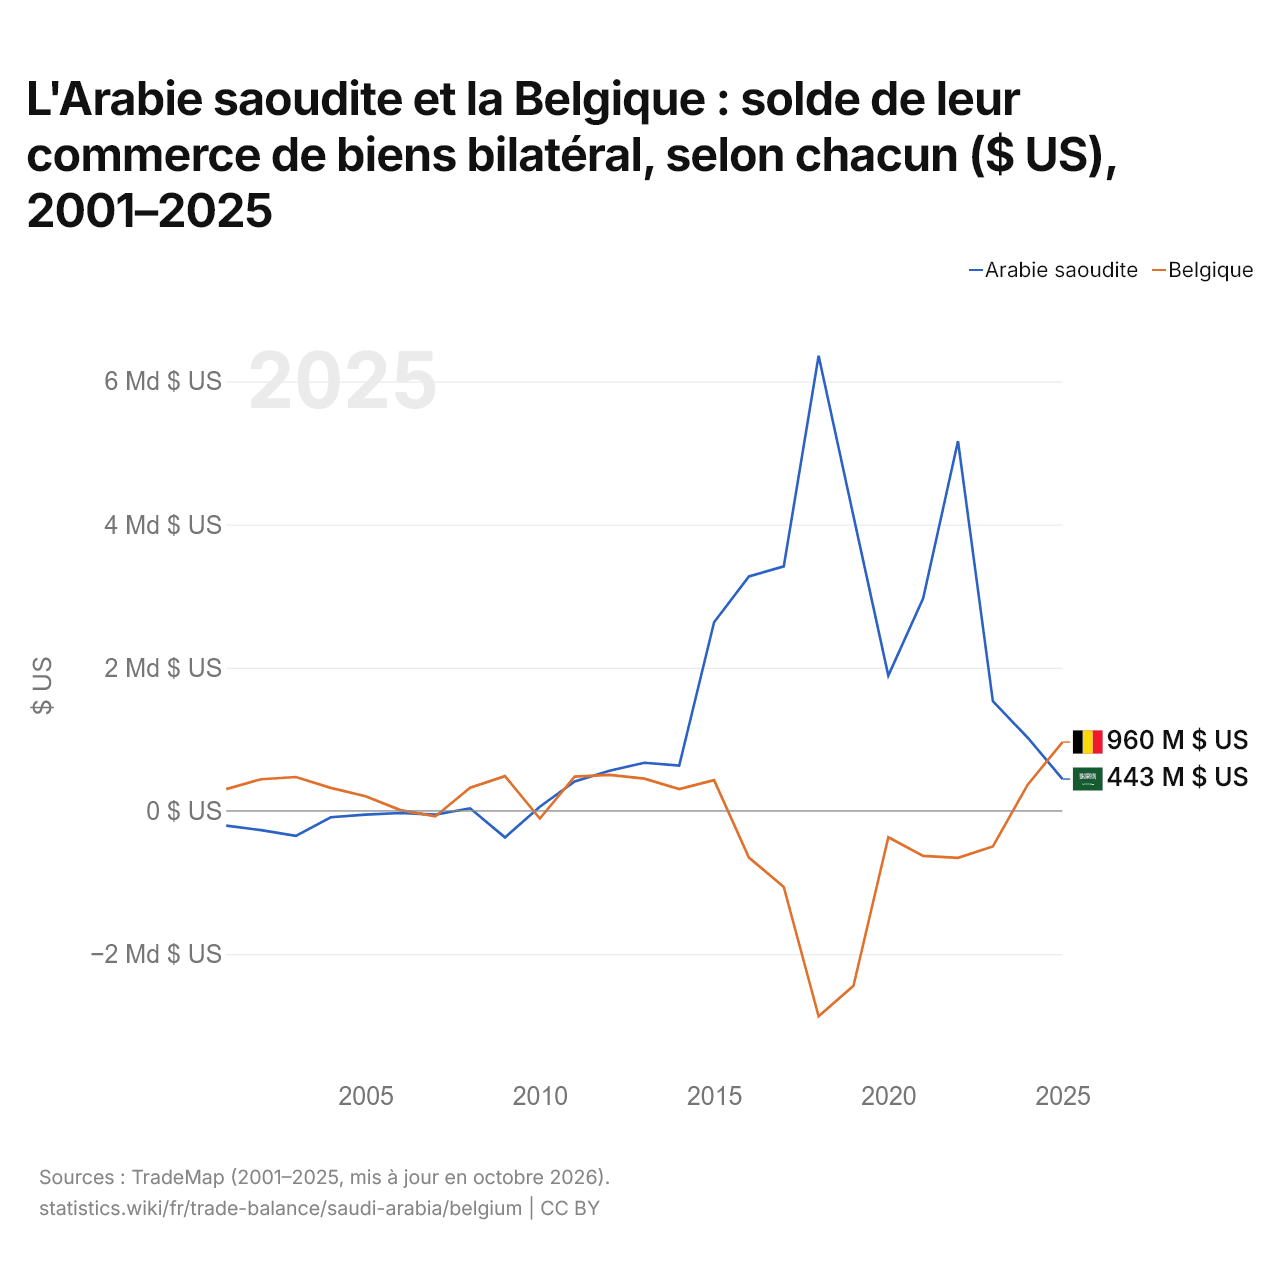
L'Arabie saoudite et la Belgique : solde de leur commerce de biens bilatéral, selon chacun ($ US), 2001–2025
| Année | $ US | |
|---|---|---|
| Arabie saoudite | Belgique | |
| 2025 | 443 292 000 $ US | 960 300 000 $ US |
| 2024 | 1 021 083 000 $ US | 365 208 000 $ US |
| 2023 | 1 531 685 000 $ US | −497 567 000 $ US |
| 2022 | 5 166 354 000 $ US | −658 179 000 $ US |
| 2021 | 2 969 356 000 $ US | −630 692 000 $ US |
| 2020 | 1 888 282 000 $ US | −369 225 000 $ US |
| 2019 | 4 118 182 000 $ US | −2 445 846 000 $ US |
| 2018 | 6 359 338 000 $ US | −2 871 701 000 $ US |
| 2017 | 3 415 124 000 $ US | −1 063 486 000 $ US |
| 2016 | 3 275 685 000 $ US | −653 771 000 $ US |
| 2015 | 2 634 275 000 $ US | 428 591 000 $ US |
| 2014 | 632 495 000 $ US | 303 394 000 $ US |
| 2013 | 670 995 000 $ US | 448 708 000 $ US |
| 2012 | 559 764 000 $ US | 502 286 000 $ US |
| 2011 | 410 484 000 $ US | 477 409 000 $ US |
| 2010 | 57 170 000 $ US | −108 664 000 $ US |
| 2009 | −371 870 000 $ US | 484 680 000 $ US |
| 2008 | 34 885 000 $ US | 321 397 000 $ US |
| 2007 | −54 381 000 $ US | −78 712 000 $ US |
| 2006 | −30 606 000 $ US | 9 515 000 $ US |
| 2005 | −52 964 000 $ US | 204 506 000 $ US |
| 2004 | −90 162 000 $ US | 320 079 000 $ US |
| 2003 | −350 339 000 $ US | 472 490 000 $ US |
| 2002 | −270 212 000 $ US | 441 483 000 $ US |
| 2001 | −207 540 000 $ US | 302 453 000 $ US |
En 2025, selon l'Arabie saoudite, son commerce de biens avec la Belgique affichait un excédent de 443 millions de dollars ; selon la Belgique, son commerce de biens avec l'Arabie saoudite affichait un excédent de 960 millions de dollars. En 2001, les chiffres étaient un déficit de 208 millions de dollars pour l'Arabie saoudite et un excédent de 302 millions de dollars pour la Belgique.
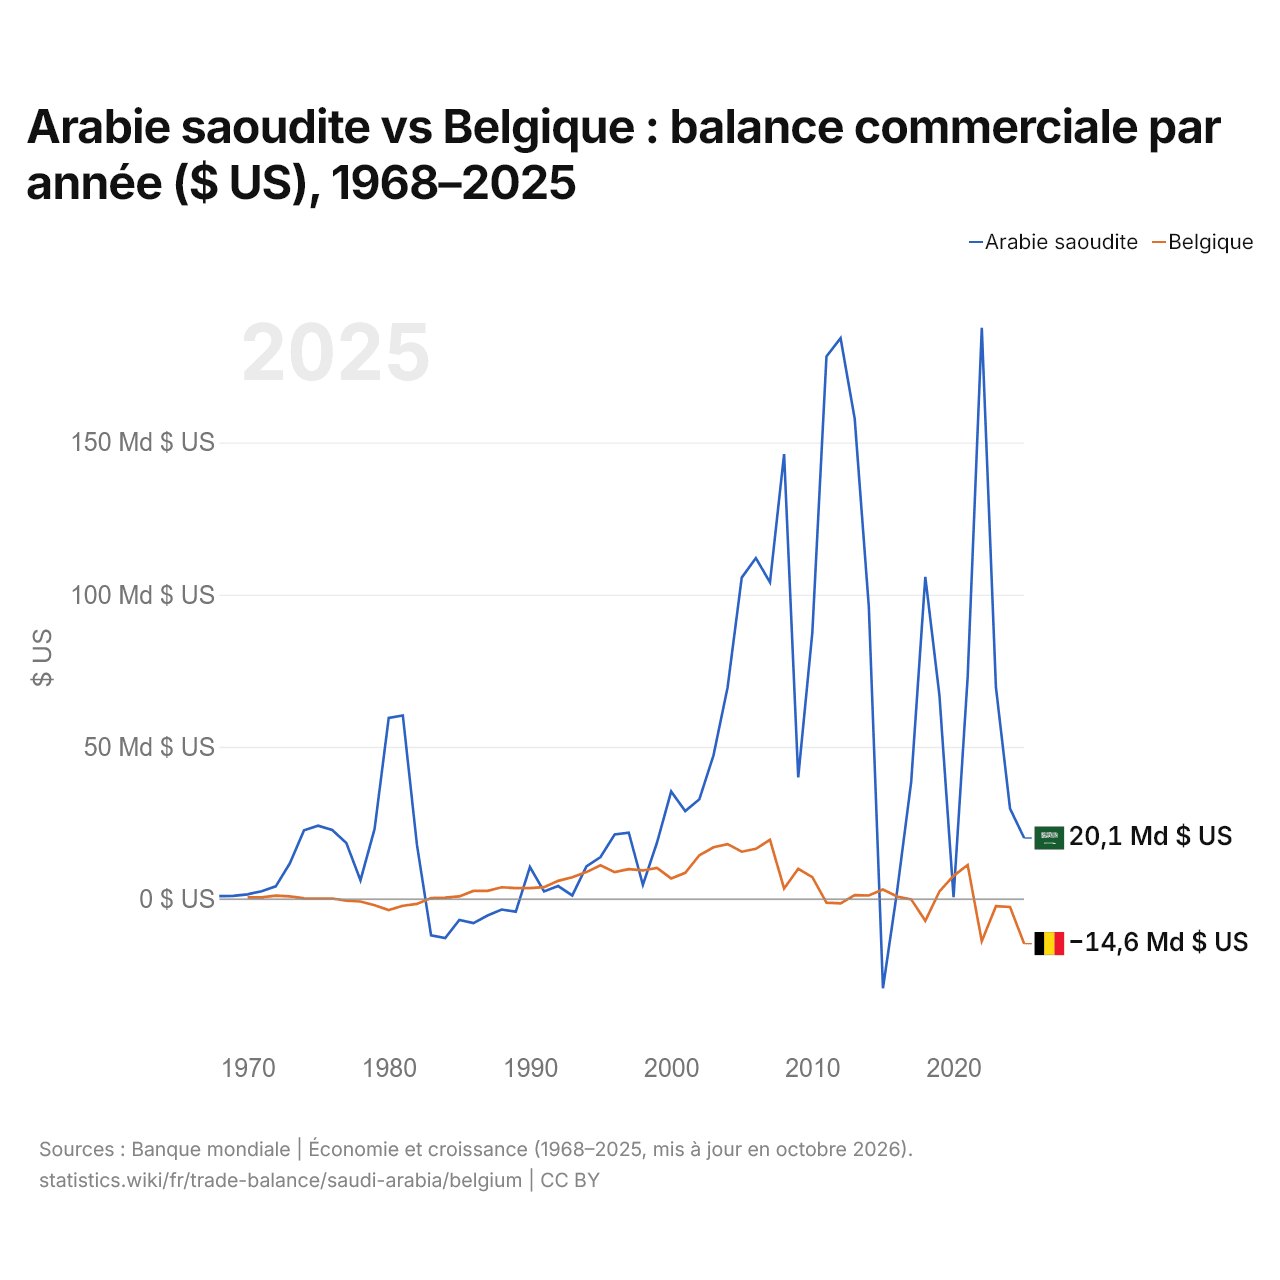
Arabie saoudite vs Belgique : balance commerciale par année ($ US), 1968–2025
| Année | $ US | |
|---|---|---|
 Arabie saoudite |
 Belgique |
|
| 2025 | 20 067 466 667 $ US | −14 637 349 567 $ US |
| 2024 | 29 736 533 333 $ US | −2 589 378 795 $ US |
| 2023 | 69 635 466 667 $ US | −2 348 299 205 $ US |
| 2022 | 187 668 533 333 $ US | −13 809 679 840 $ US |
| 2021 | 72 986 133 333 $ US | 11 185 411 660 $ US |
| 2020 | 664 000 000 $ US | 7 646 774 510 $ US |
| 2019 | 66 885 333 333 $ US | 2 519 265 437 $ US |
| 2018 | 105 847 466 667 $ US | −7 117 140 449 $ US |
| 2017 | 38 494 666 667 $ US | −76 479 416 $ US |
| 2016 | 2 512 533 333 $ US | 846 891 572 $ US |
| 2015 | −29 296 800 000 $ US | 3 166 438 839 $ US |
| 2014 | 95 966 400 000 $ US | 1 191 266 653 $ US |
| 2013 | 157 750 133 333 $ US | 1 306 071 280 $ US |
| 2012 | 184 213 333 333 $ US | −1 422 261 060 $ US |
| 2011 | 178 246 400 000 $ US | −1 174 531 842 $ US |
| 2010 | 87 628 266 667 $ US | 7 194 531 778 $ US |
| 2009 | 39 987 200 000 $ US | 9 960 978 144 $ US |
| 2008 | 146 168 800 000 $ US | 3 480 542 817 $ US |
| 2007 | 104 039 226 151 $ US | 19 473 396 555 $ US |
| 2006 | 112 011 748 999 $ US | 16 503 842 056 $ US |
| 2005 | 105 591 257 239 $ US | 15 569 789 759 $ US |
| 2004 | 69 570 133 333 $ US | 18 069 920 173 $ US |
| 2003 | 47 212 533 333 $ US | 17 041 157 540 $ US |
| 2002 | 32 810 933 333 $ US | 14 411 205 478 $ US |
| 2001 | 28 922 133 333 $ US | 8 634 316 460 $ US |
| 2000 | 35 333 333 333 $ US | 6 783 287 644 $ US |
| 1999 | 18 576 266 667 $ US | 10 216 533 029 $ US |
| 1998 | 4 662 133 333 $ US | 9 409 313 181 $ US |
| 1997 | 21 789 586 115 $ US | 9 815 741 994 $ US |
| 1996 | 21 247 797 063 $ US | 8 856 286 645 $ US |
| 1995 | 13 809 612 817 $ US | 11 089 490 969 $ US |
| 1994 | 10 720 160 214 $ US | 8 858 973 957 $ US |
| 1993 | 1 194 926 569 $ US | 7 197 266 791 $ US |
| 1992 | 4 279 305 741 $ US | 5 983 582 183 $ US |
| 1991 | 2 535 380 507 $ US | 3 934 812 758 $ US |
| 1990 | 10 541 522 029 $ US | 3 612 875 423 $ US |
| 1989 | −4 130 040 053 $ US | 3 607 222 563 $ US |
| 1988 | −3 423 497 997 $ US | 3 884 174 438 $ US |
| 1987 | −5 373 831 776 $ US | 2 713 639 114 $ US |
| 1986 | −7 899 000 810 $ US | 2 687 310 818 $ US |
| 1985 | −6 827 443 401 $ US | 890 002 718 $ US |
| 1984 | −12 800 510 783 $ US | 495 069 813 $ US |
| 1983 | −11 894 066 570 $ US | 344 979 882 $ US |
| 1982 | 17 796 370 134 $ US | −1 582 876 567 $ US |
| 1981 | 60 310 278 645 $ US | −2 193 369 187 $ US |
| 1980 | 59 490 035 596 $ US | −3 577 711 408 $ US |
| 1979 | 23 056 756 397 $ US | −2 010 039 901 $ US |
| 1978 | 6 195 798 165 $ US | −799 154 605 $ US |
| 1977 | 18 443 064 170 $ US | −549 247 046 $ US |
| 1976 | 22 707 932 011 $ US | 208 368 861 $ US |
| 1975 | 24 135 407 771 $ US | 202 501 919 $ US |
| 1974 | 22 585 633 803 $ US | 288 928 128 $ US |
| 1973 | 11 776 865 468 $ US | 916 582 488 $ US |
| 1972 | 4 185 774 158 $ US | 1 138 651 819 $ US |
| 1971 | 2 591 362 408 $ US | 581 774 525 $ US |
| 1970 | 1 572 222 222 $ US | 583 597 418 $ US |
| 1969 | 1 042 836 022 $ US | - |
| 1968 | 963 960 711 $ US | - |
En 2025, la balance commerciale de l'Arabie saoudite affichait un excédent de 20,1 milliards de dollars et celle de la Belgique un déficit de 14,6 milliards de dollars. En 1970, la balance commerciale de l'Arabie saoudite affichait un excédent de 1,57 milliard de dollars et celle de la Belgique un excédent de 584 millions de dollars.
De 1970 à 2025, la balance commerciale de l'Arabie saoudite a été excédentaire pendant 48 des 56 années, et celle de la Belgique pendant 42. Les balances commerciales de l'Arabie saoudite et de la Belgique n'ont jamais été déficitaires la même année.
Arabie saoudite vs Belgique : chiffres de la balance commerciale
|
Arabie saoudite
|
Belgique
|
|
|---|---|---|
| Biens et services, $ US | +20,1 Md $US (2025) | −14,6 Md $US (2025) |
| % du PIB | +1,6 % (2025) | −2,0 % (2025) |
| Années d'excédent depuis 2000 | 25 sur 26 | 18 sur 26 |
| Solde des biens entre les deux, chiffres propres | +443 M $US (2025) | +960 M $US (2025) |
| Premier excédent en biens avec | Émirats arabes unis (+14,2 Md $US, 2025) | Allemagne (+42,1 Md $US, 2025) |
| Premier déficit en biens avec | Chine (−61,7 Md $US, 2025) | Pays-Bas (−33,2 Md $US, 2025) |
Comparer la balance commerciale de 2 pays au choix
Sources :
- Banque mondiale | Économie et croissance (1968–2025, mis à jour en octobre 2026)
- TradeMap (2001–2025, mis à jour en octobre 2026)
Creative Commons Attribution (CC BY) : vous pouvez copier, partager, adapter et réutiliser ce contenu, y compris à des fins commerciales, à condition de citer statistics.wiki et d’indiquer les modifications apportées. Les sources citées ci-dessus peuvent avoir leurs propres conditions de licence.