
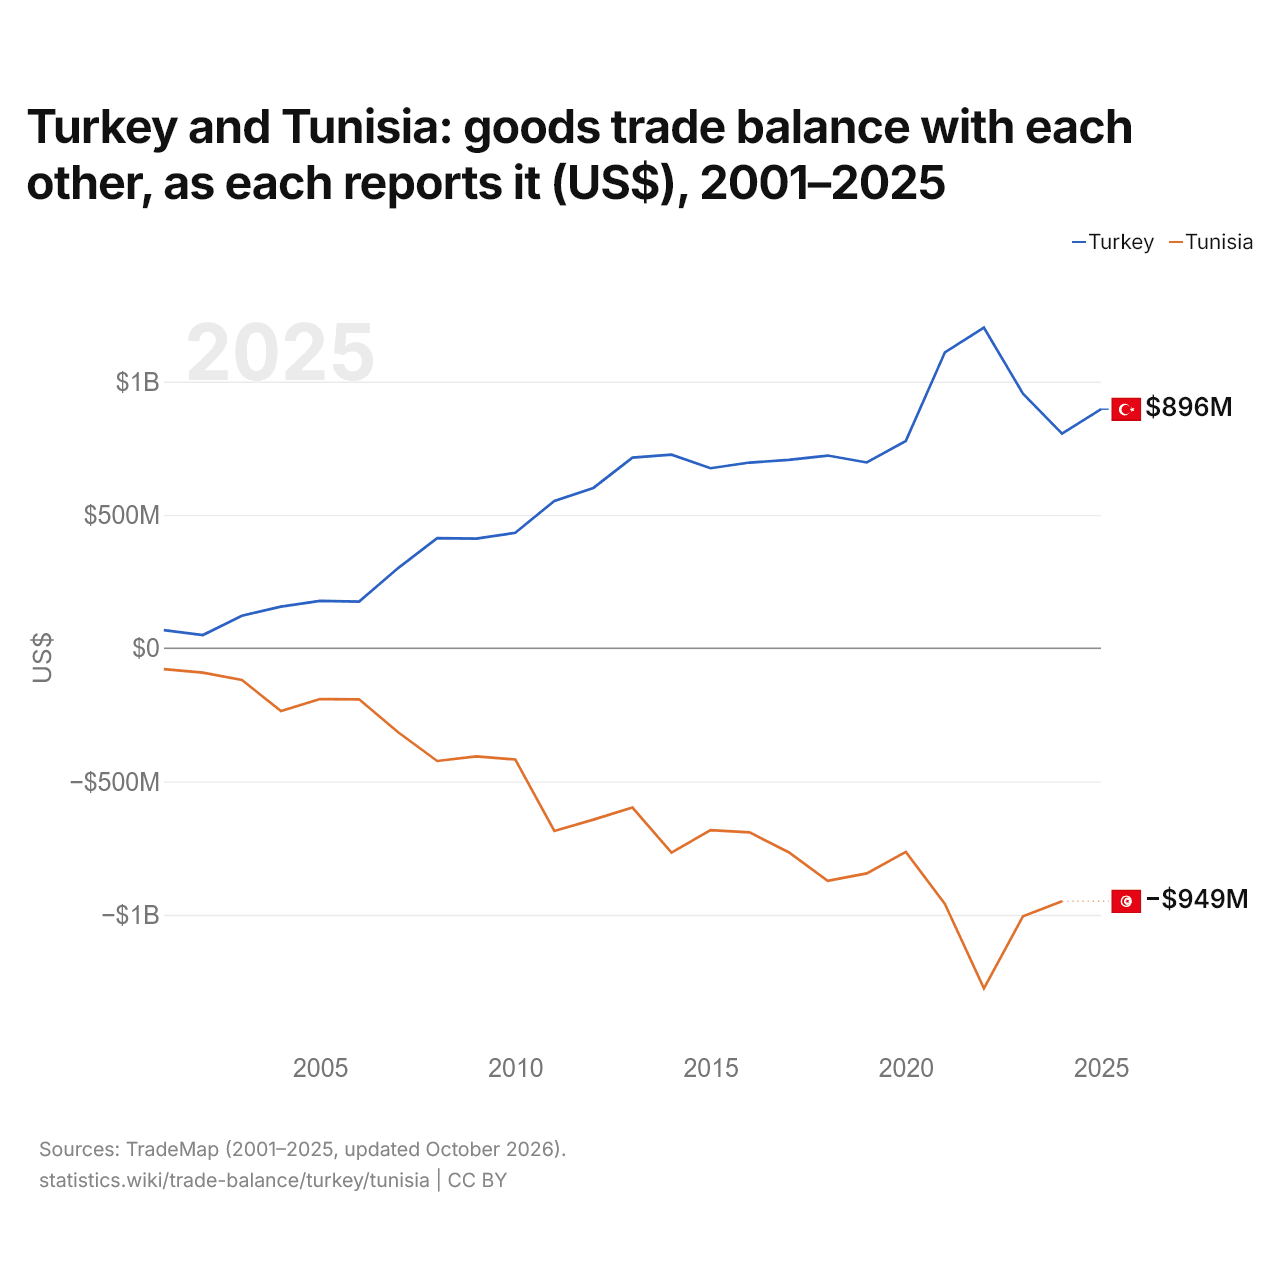
La Turquie et la Tunisie : solde de leur commerce de biens bilatéral, selon chacun ($ US), 2001–2025
| Année | $ US | |
|---|---|---|
| Turquie | Tunisie | |
| 2025 | 896 492 000 $ US | - |
| 2024 | 804 937 000 $ US | −949 109 000 $ US |
| 2023 | 954 614 000 $ US | −1 005 251 000 $ US |
| 2022 | 1 202 131 000 $ US | −1 275 566 000 $ US |
| 2021 | 1 109 615 000 $ US | −959 301 000 $ US |
| 2020 | 777 493 000 $ US | −763 946 000 $ US |
| 2019 | 696 666 000 $ US | −844 451 000 $ US |
| 2018 | 722 583 000 $ US | −872 437 000 $ US |
| 2017 | 706 237 000 $ US | −765 161 000 $ US |
| 2016 | 696 338 000 $ US | −690 710 000 $ US |
| 2015 | 674 984 000 $ US | −682 196 000 $ US |
| 2014 | 725 950 000 $ US | −766 482 000 $ US |
| 2013 | 714 628 000 $ US | −597 496 000 $ US |
| 2012 | 601 114 000 $ US | −642 797 000 $ US |
| 2011 | 552 512 000 $ US | −685 686 000 $ US |
| 2010 | 432 912 000 $ US | −417 561 000 $ US |
| 2009 | 410 787 000 $ US | −405 807 000 $ US |
| 2008 | 412 717 000 $ US | −422 942 000 $ US |
| 2007 | 300 489 000 $ US | −315 346 000 $ US |
| 2006 | 174 799 000 $ US | −191 740 000 $ US |
| 2005 | 177 413 000 $ US | −190 848 000 $ US |
| 2004 | 155 752 000 $ US | −235 736 000 $ US |
| 2003 | 121 875 000 $ US | −119 283 000 $ US |
| 2002 | 49 341 000 $ US | −91 560 000 $ US |
| 2001 | 67 657 000 $ US | −78 156 000 $ US |
Selon la Turquie, son commerce de biens avec la Tunisie affichait un excédent de 805 millions de dollars ; selon la Tunisie, son commerce de biens avec la Turquie affichait un déficit de 949 millions de dollars. En 2001, les chiffres étaient un excédent de 67,7 millions de dollars pour la Turquie et un déficit de 78,2 millions de dollars pour la Tunisie.
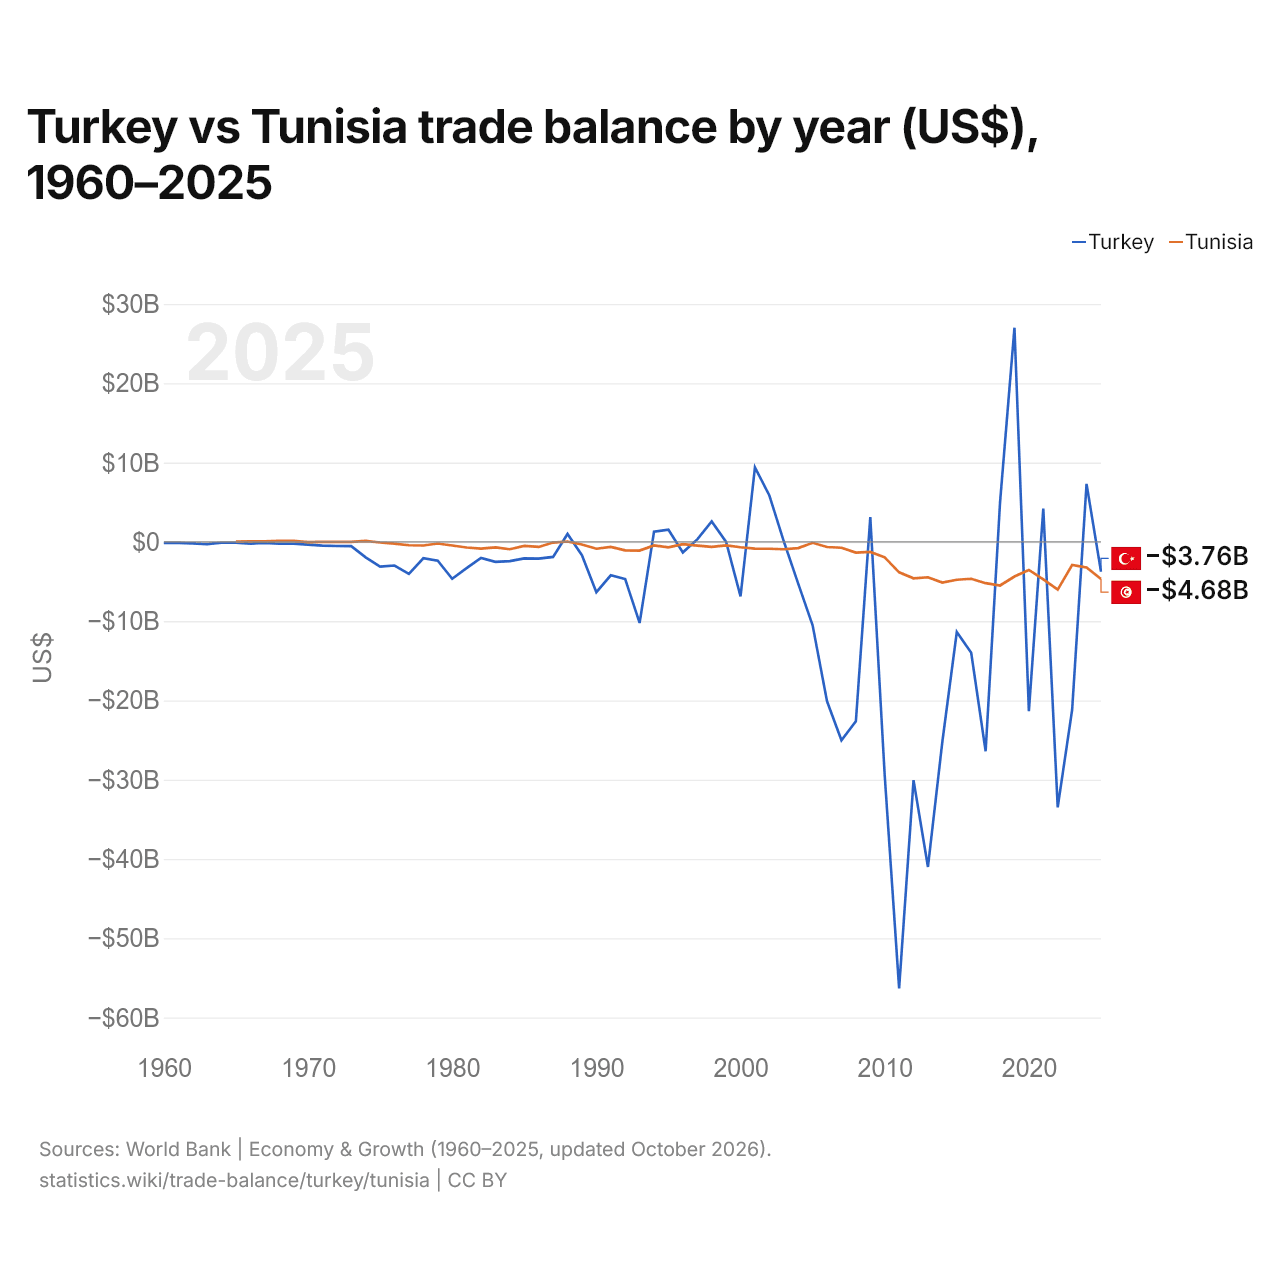
Turquie vs Tunisie : balance commerciale par année ($ US), 1960–2025
| Année | $ US | |
|---|---|---|
 Turquie |
 Tunisie |
|
| 2025 | −3 755 785 561 $ US | −4 682 306 614 $ US |
| 2024 | 7 307 197 101 $ US | −3 236 480 072 $ US |
| 2023 | −21 181 731 331 $ US | −2 916 456 198 $ US |
| 2022 | −33 486 302 440 $ US | −6 040 340 250 $ US |
| 2021 | 4 185 993 617 $ US | −4 741 691 349 $ US |
| 2020 | −21 347 440 639 $ US | −3 547 948 021 $ US |
| 2019 | 27 009 801 864 $ US | −4 371 577 064 $ US |
| 2018 | 4 971 181 455 $ US | −5 506 699 052 $ US |
| 2017 | −26 405 711 552 $ US | −5 214 627 442 $ US |
| 2016 | −13 983 412 331 $ US | −4 658 727 310 $ US |
| 2015 | −11 366 572 353 $ US | −4 783 432 103 $ US |
| 2014 | −25 180 591 325 $ US | −5 133 844 817 $ US |
| 2013 | −41 005 981 821 $ US | −4 467 155 549 $ US |
| 2012 | −30 066 833 315 $ US | −4 601 047 256 $ US |
| 2011 | −56 314 976 402 $ US | −3 848 456 900 $ US |
| 2010 | −29 450 676 482 $ US | −1 955 235 015 $ US |
| 2009 | 3 116 333 325 $ US | −1 276 406 658 $ US |
| 2008 | −22 630 468 482 $ US | −1 362 829 934 $ US |
| 2007 | −25 026 651 296 $ US | −740 542 456 $ US |
| 2006 | −20 116 184 782 $ US | −647 621 194 $ US |
| 2005 | −10 528 378 745 $ US | −124 784 864 $ US |
| 2004 | −5 268 792 743 $ US | −788 700 142 $ US |
| 2003 | 66 756 414 $ US | −939 805 566 $ US |
| 2002 | 5 845 228 386 $ US | −873 019 055 $ US |
| 2001 | 9 400 731 322 $ US | −864 661 680 $ US |
| 2000 | −6 890 257 814 $ US | −682 652 371 $ US |
| 1999 | −12 805 916 $ US | −446 711 206 $ US |
| 1998 | 2 572 582 501 $ US | −640 980 043 $ US |
| 1997 | 308 677 444 $ US | −471 467 789 $ US |
| 1996 | −1 330 688 533 $ US | −294 121 273 $ US |
| 1995 | 1 537 801 287 $ US | −704 240 245 $ US |
| 1994 | 1 278 297 139 $ US | −459 589 898 $ US |
| 1993 | −10 228 639 053 $ US | −1 098 589 080 $ US |
| 1992 | −4 698 195 576 $ US | −1 073 908 368 $ US |
| 1991 | −4 219 534 995 $ US | −647 826 087 $ US |
| 1990 | −6 346 799 540 $ US | −866 136 364 $ US |
| 1989 | −1 690 292 177 $ US | −334 976 262 $ US |
| 1988 | 1 000 632 911 $ US | 36 371 945 $ US |
| 1987 | −1 897 782 964 $ US | −95 937 789 $ US |
| 1986 | −2 110 962 963 $ US | −642 042 041 $ US |
| 1985 | −2 087 931 034 $ US | −507 132 449 $ US |
| 1984 | −2 437 602 180 $ US | −938 168 178 $ US |
| 1983 | −2 524 444 444 $ US | −697 735 747 $ US |
| 1982 | −2 029 447 853 $ US | −856 460 359 $ US |
| 1981 | −3 322 522 523 $ US | −713 643 470 $ US |
| 1980 | −4 656 578 947 $ US | −469 004 693 $ US |
| 1979 | −2 387 096 774 $ US | −214 780 225 $ US |
| 1978 | −2 070 833 333 $ US | −463 991 965 $ US |
| 1977 | −4 044 444 444 $ US | −430 769 231 $ US |
| 1976 | −2 987 500 000 $ US | −222 261 093 $ US |
| 1975 | −3 135 714 286 $ US | −81 040 702 $ US |
| 1974 | −1 964 285 714 $ US | 112 025 438 $ US |
| 1973 | −535 714 286 $ US | −9 724 950 $ US |
| 1972 | −521 428 571 $ US | 13 624 464 $ US |
| 1971 | −473 333 333 $ US | −5 545 813 $ US |
| 1970 | −345 454 545 $ US | −39 619 048 $ US |
| 1969 | −222 222 222 $ US | 122 095 238 $ US |
| 1968 | −244 444 444 $ US | 122 476 190 $ US |
| 1967 | −133 333 333 $ US | 72 571 429 $ US |
| 1966 | −222 222 222 $ US | 78 666 667 $ US |
| 1965 | −100 000 000 $ US | 46 095 238 $ US |
| 1964 | −111 111 111 $ US | - |
| 1963 | −288 888 889 $ US | - |
| 1962 | −211 111 111 $ US | - |
| 1961 | −133 333 333 $ US | - |
| 1960 | −122 222 222 $ US | - |
En 2025, la balance commerciale de la Turquie affichait un déficit de 3,76 milliards de dollars et celle de la Tunisie un déficit de 4,68 milliards de dollars ; le déficit de la Tunisie était plus grand de 25 %. En 1965, la balance commerciale de la Turquie affichait un déficit de 100 millions de dollars et celle de la Tunisie un excédent de 46,1 millions de dollars.
De 1965 à 2025, la balance commerciale de la Turquie a été excédentaire pendant 13 des 61 années, et celle de la Tunisie pendant 8. Les balances commerciales de la Turquie et de la Tunisie ont été déficitaires en même temps pendant 41 de ces années, la dernière fois en 2025.
Turquie vs Tunisie : chiffres de la balance commerciale
|
Turquie
|
Tunisie
|
|
|---|---|---|
| Biens et services, $ US | −3,76 Md $US (2025) | −4,68 Md $US (2025) |
| % du PIB | −0,2 % (2025) | −8,1 % (2025) |
| Années d'excédent depuis 2000 | 8 sur 26 | 0 sur 26 |
| Solde des biens entre les deux, chiffres propres | +896 M $US (2025) | −949 M $US (2024) |
| Premier excédent en biens avec | Irak (+10,4 Md $US, 2025) | France (+1,66 Md $US, 2024) |
| Premier déficit en biens avec | Chine (−46,3 Md $US, 2025) | Chine (−2,91 Md $US, 2024) |
Comparer la balance commerciale de 2 pays au choix
Sources :
- Banque mondiale | Économie et croissance (1960–2025, mis à jour en octobre 2026)
- TradeMap (2001–2025, mis à jour en octobre 2026)
Creative Commons Attribution (CC BY) : vous pouvez copier, partager, adapter et réutiliser ce contenu, y compris à des fins commerciales, à condition de citer statistics.wiki et d’indiquer les modifications apportées. Les sources citées ci-dessus peuvent avoir leurs propres conditions de licence.