
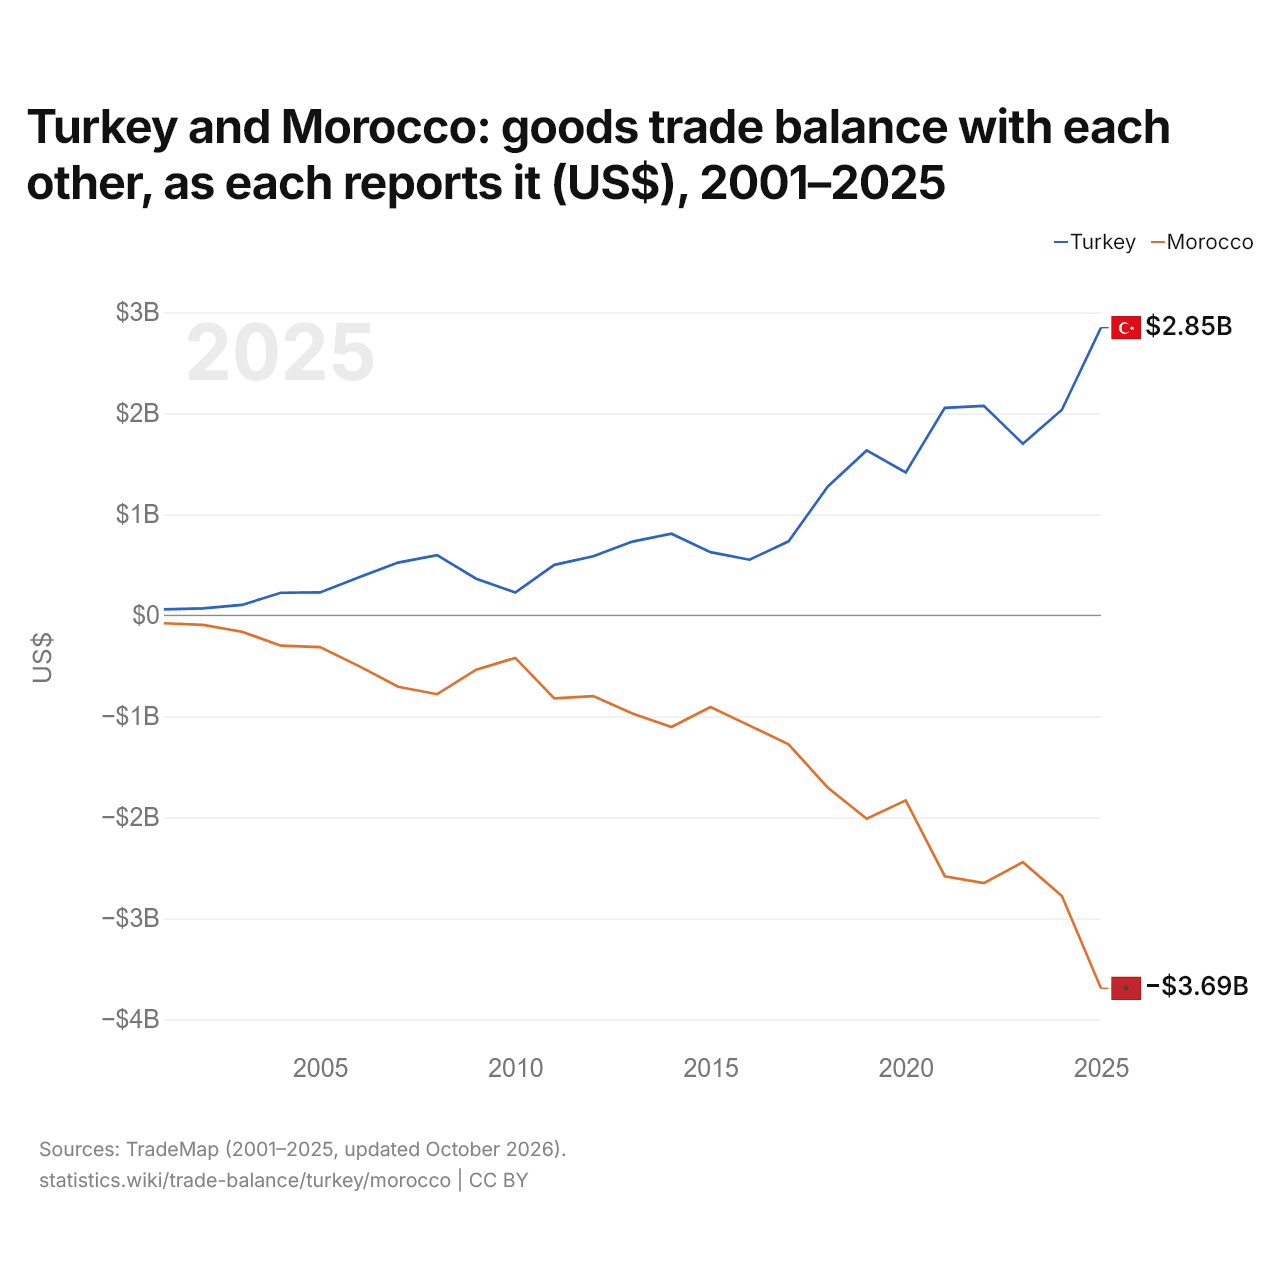
La Turquie et le Maroc : solde de leur commerce de biens bilatéral, selon chacun ($ US), 2001–2025
| Année | $ US | |
|---|---|---|
| Turquie | Maroc | |
| 2025 | 2 848 352 000 $ US | −3 691 235 000 $ US |
| 2024 | 2 035 844 000 $ US | −2 777 742 000 $ US |
| 2023 | 1 700 112 000 $ US | −2 442 148 000 $ US |
| 2022 | 2 074 532 000 $ US | −2 649 829 000 $ US |
| 2021 | 2 054 685 000 $ US | −2 581 820 000 $ US |
| 2020 | 1 415 169 000 $ US | −1 831 011 000 $ US |
| 2019 | 1 633 479 000 $ US | −2 013 137 000 $ US |
| 2018 | 1 273 872 000 $ US | −1 703 472 000 $ US |
| 2017 | 733 656 000 $ US | −1 275 880 000 $ US |
| 2016 | 551 618 000 $ US | −1 090 810 000 $ US |
| 2015 | 626 919 000 $ US | −905 982 000 $ US |
| 2014 | 809 385 000 $ US | −1 104 593 000 $ US |
| 2013 | 730 993 000 $ US | −970 902 000 $ US |
| 2012 | 585 424 000 $ US | −798 418 000 $ US |
| 2011 | 500 951 000 $ US | −821 611 000 $ US |
| 2010 | 227 159 000 $ US | −420 706 000 $ US |
| 2009 | 363 812 000 $ US | −537 351 000 $ US |
| 2008 | 597 249 000 $ US | −779 797 000 $ US |
| 2007 | 523 135 000 $ US | −706 124 000 $ US |
| 2006 | 377 475 000 $ US | −501 758 000 $ US |
| 2005 | 227 594 000 $ US | −314 151 000 $ US |
| 2004 | 224 281 000 $ US | −299 120 000 $ US |
| 2003 | 103 789 000 $ US | −161 029 000 $ US |
| 2002 | 70 016 000 $ US | −94 192 000 $ US |
| 2001 | 59 955 000 $ US | −77 568 000 $ US |
En 2025, selon la Turquie, son commerce de biens avec le Maroc affichait un excédent de 2,85 milliards de dollars ; selon le Maroc, son commerce de biens avec la Turquie affichait un déficit de 3,69 milliards de dollars. En 2001, les chiffres étaient un excédent de 60 millions de dollars pour la Turquie et un déficit de 77,6 millions de dollars pour le Maroc.
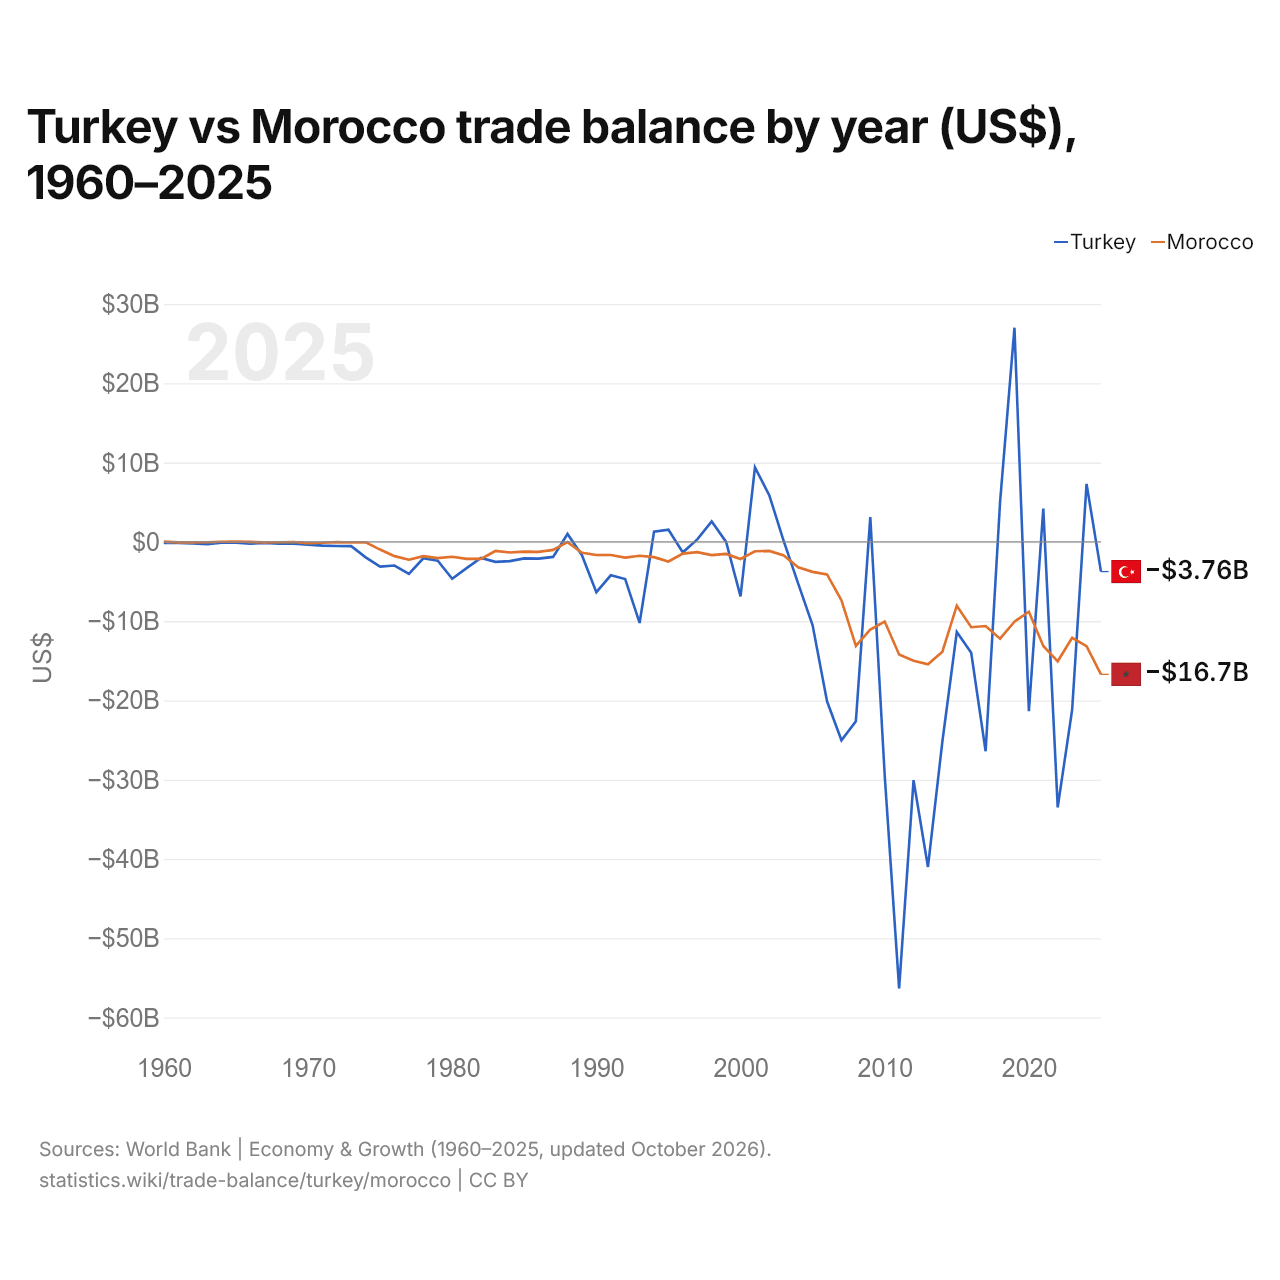
Turquie vs Maroc : balance commerciale par année ($ US), 1960–2025
| Année | $ US | |
|---|---|---|
 Turquie |
 Maroc |
|
| 2025 | −3 755 785 561 $ US | −16 711 370 159 $ US |
| 2024 | 7 307 197 101 $ US | −13 154 358 447 $ US |
| 2023 | −21 181 731 331 $ US | −12 095 698 963 $ US |
| 2022 | −33 486 302 440 $ US | −15 070 969 799 $ US |
| 2021 | 4 185 993 617 $ US | −13 138 811 840 $ US |
| 2020 | −21 347 440 639 $ US | −8 804 922 307 $ US |
| 2019 | 27 009 801 864 $ US | −10 071 252 426 $ US |
| 2018 | 4 971 181 455 $ US | −12 222 219 618 $ US |
| 2017 | −26 405 711 552 $ US | −10 621 752 089 $ US |
| 2016 | −13 983 412 331 $ US | −10 770 661 075 $ US |
| 2015 | −11 366 572 353 $ US | −8 056 861 554 $ US |
| 2014 | −25 180 591 325 $ US | −13 852 049 948 $ US |
| 2013 | −41 005 981 821 $ US | −15 452 612 955 $ US |
| 2012 | −30 066 833 315 $ US | −15 001 080 728 $ US |
| 2011 | −56 314 976 402 $ US | −14 219 008 328 $ US |
| 2010 | −29 450 676 482 $ US | −10 050 304 390 $ US |
| 2009 | 3 116 333 325 $ US | −11 062 913 455 $ US |
| 2008 | −22 630 468 482 $ US | −13 124 997 984 $ US |
| 2007 | −25 026 651 296 $ US | −7 385 441 974 $ US |
| 2006 | −20 116 184 782 $ US | −4 108 550 667 $ US |
| 2005 | −10 528 378 745 $ US | −3 788 292 814 $ US |
| 2004 | −5 268 792 743 $ US | −3 208 669 864 $ US |
| 2003 | 66 756 414 $ US | −1 728 628 059 $ US |
| 2002 | 5 845 228 386 $ US | −1 139 912 204 $ US |
| 2001 | 9 400 731 322 $ US | −1 183 660 488 $ US |
| 2000 | −6 890 257 814 $ US | −2 170 940 439 $ US |
| 1999 | −12 805 916 $ US | −1 531 205 001 $ US |
| 1998 | 2 572 582 501 $ US | −1 668 096 217 $ US |
| 1997 | 308 677 444 $ US | −1 292 630 083 $ US |
| 1996 | −1 330 688 533 $ US | −1 477 676 771 $ US |
| 1995 | 1 537 801 287 $ US | −2 485 677 026 $ US |
| 1994 | 1 278 297 139 $ US | −1 935 637 021 $ US |
| 1993 | −10 228 639 053 $ US | −1 755 914 442 $ US |
| 1992 | −4 698 195 576 $ US | −1 995 360 541 $ US |
| 1991 | −4 219 534 995 $ US | −1 660 046 700 $ US |
| 1990 | −6 346 799 540 $ US | −1 662 325 914 $ US |
| 1989 | −1 690 292 177 $ US | −1 379 125 300 $ US |
| 1988 | 1 000 632 911 $ US | −37 146 581 $ US |
| 1987 | −1 897 782 964 $ US | −1 021 875 832 $ US |
| 1986 | −2 110 962 963 $ US | −1 268 123 845 $ US |
| 1985 | −2 087 931 034 $ US | −1 242 570 804 $ US |
| 1984 | −2 437 602 180 $ US | −1 348 202 879 $ US |
| 1983 | −2 524 444 444 $ US | −1 154 613 565 $ US |
| 1982 | −2 029 447 853 $ US | −2 146 213 313 $ US |
| 1981 | −3 322 522 523 $ US | −2 151 238 058 $ US |
| 1980 | −4 656 578 947 $ US | −1 883 905 741 $ US |
| 1979 | −2 387 096 774 $ US | −2 045 402 902 $ US |
| 1978 | −2 070 833 333 $ US | −1 813 126 114 $ US |
| 1977 | −4 044 444 444 $ US | −2 256 944 059 $ US |
| 1976 | −2 987 500 000 $ US | −1 803 221 859 $ US |
| 1975 | −3 135 714 286 $ US | −976 930 956 $ US |
| 1974 | −1 964 285 714 $ US | −48 812 671 $ US |
| 1973 | −535 714 286 $ US | −79 232 106 $ US |
| 1972 | −521 428 571 $ US | −32 929 056 $ US |
| 1971 | −473 333 333 $ US | −120 793 060 $ US |
| 1970 | −345 454 545 $ US | −155 973 038 $ US |
| 1969 | −222 222 222 $ US | −16 599 183 $ US |
| 1968 | −244 444 444 $ US | −51 378 424 $ US |
| 1967 | −133 333 333 $ US | −69 163 263 $ US |
| 1966 | −222 222 222 $ US | −11 856 559 $ US |
| 1965 | −100 000 000 $ US | 37 545 771 $ US |
| 1964 | −111 111 111 $ US | 9 880 387 $ US |
| 1963 | −288 888 889 $ US | −57 306 684 $ US |
| 1962 | −211 111 111 $ US | −73 115 430 $ US |
| 1961 | −133 333 333 $ US | −61 258 870 $ US |
| 1960 | −122 222 222 $ US | 17 784 859 $ US |
En 2025, la balance commerciale de la Turquie affichait un déficit de 3,76 milliards de dollars et celle du Maroc un déficit de 16,7 milliards de dollars ; le déficit du Maroc était 4,4 fois plus grand. En 1960, la balance commerciale de la Turquie affichait un déficit de 122 millions de dollars et celle du Maroc un excédent de 17,8 millions de dollars.
De 1960 à 2025, la balance commerciale de la Turquie a été excédentaire pendant 13 des 66 années, et celle du Maroc pendant 3. Les balances commerciales de la Turquie et du Maroc ont été déficitaires en même temps pendant 50 de ces années, la dernière fois en 2025.
Turquie vs Maroc : chiffres de la balance commerciale
|
Turquie
|
Maroc
|
|
|---|---|---|
| Biens et services, $ US | −3,76 Md $US (2025) | −16,7 Md $US (2025) |
| % du PIB | −0,2 % (2025) | −9,2 % (2025) |
| Années d'excédent depuis 2000 | 8 sur 26 | 0 sur 26 |
| Solde des biens entre les deux, chiffres propres | +2,85 Md $US (2025) | −3,69 Md $US (2025) |
| Premier excédent en biens avec | Irak (+10,4 Md $US, 2025) | France (+1,63 Md $US, 2025) |
| Premier déficit en biens avec | Chine (−46,3 Md $US, 2025) | Chine (−11,8 Md $US, 2025) |
Comparer la balance commerciale de 2 pays au choix
Sources :
- Banque mondiale | Économie et croissance (1960–2025, mis à jour en octobre 2026)
- TradeMap (2001–2025, mis à jour en octobre 2026)
Creative Commons Attribution (CC BY) : vous pouvez copier, partager, adapter et réutiliser ce contenu, y compris à des fins commerciales, à condition de citer statistics.wiki et d’indiquer les modifications apportées. Les sources citées ci-dessus peuvent avoir leurs propres conditions de licence.