
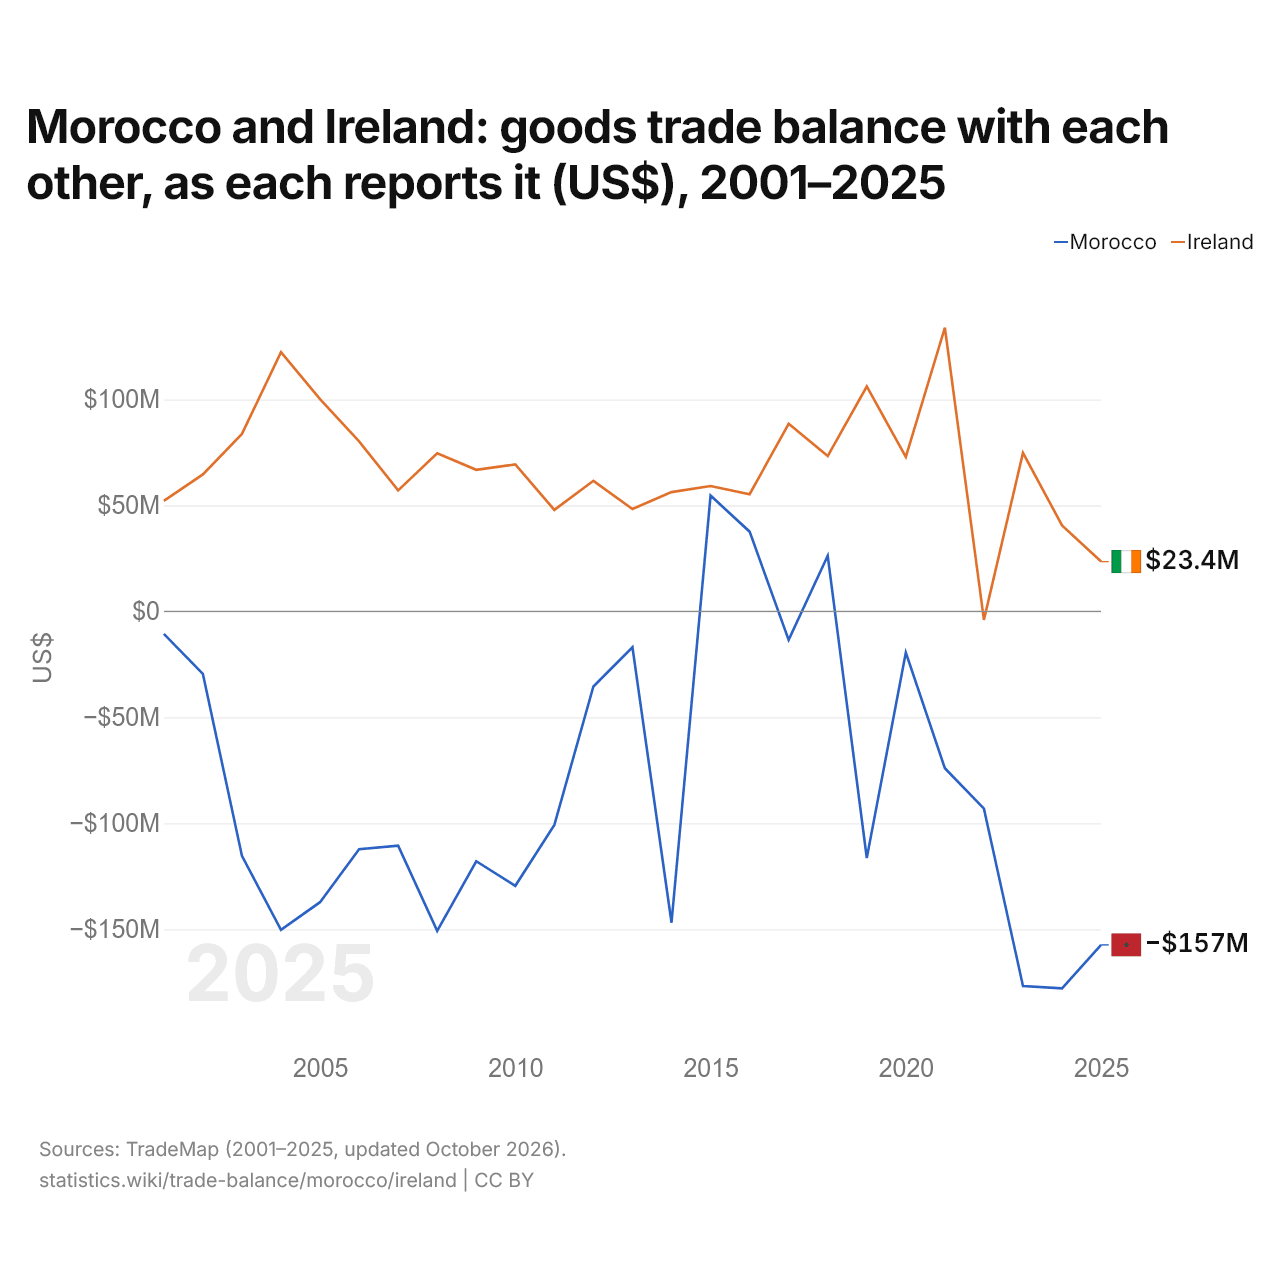
Le Maroc et l'Irlande : solde de leur commerce de biens bilatéral, selon chacun ($ US), 2001–2025
| Année | $ US | |
|---|---|---|
| Maroc | Irlande | |
| 2025 | −157 428 000 $ US | 23 449 000 $ US |
| 2024 | −177 913 000 $ US | 40 534 000 $ US |
| 2023 | −176 857 000 $ US | 74 771 000 $ US |
| 2022 | −93 131 000 $ US | −4 033 000 $ US |
| 2021 | −74 096 000 $ US | 133 839 000 $ US |
| 2020 | −19 490 000 $ US | 72 837 000 $ US |
| 2019 | −116 443 000 $ US | 106 109 000 $ US |
| 2018 | 26 241 000 $ US | 73 249 000 $ US |
| 2017 | −13 473 000 $ US | 88 504 000 $ US |
| 2016 | 37 593 000 $ US | 55 223 000 $ US |
| 2015 | 54 598 000 $ US | 59 122 000 $ US |
| 2014 | −146 961 000 $ US | 56 269 000 $ US |
| 2013 | −16 947 000 $ US | 48 277 000 $ US |
| 2012 | −35 457 000 $ US | 61 593 000 $ US |
| 2011 | −100 818 000 $ US | 47 841 000 $ US |
| 2010 | −129 553 000 $ US | 69 289 000 $ US |
| 2009 | −117 942 000 $ US | 66 773 000 $ US |
| 2008 | −150 816 000 $ US | 74 579 000 $ US |
| 2007 | −110 587 000 $ US | 57 055 000 $ US |
| 2006 | −112 306 000 $ US | 80 210 000 $ US |
| 2005 | −137 286 000 $ US | 100 100 000 $ US |
| 2004 | −150 347 000 $ US | 122 252 000 $ US |
| 2003 | −115 384 000 $ US | 83 691 000 $ US |
| 2002 | −29 538 000 $ US | 64 564 000 $ US |
| 2001 | −10 673 000 $ US | 52 157 000 $ US |
En 2025, selon le Maroc, son commerce de biens avec l'Irlande affichait un déficit de 157 millions de dollars ; selon l'Irlande, son commerce de biens avec le Maroc affichait un excédent de 23,4 millions de dollars. En 2001, les chiffres étaient un déficit de 10,7 millions de dollars pour le Maroc et un excédent de 52,2 millions de dollars pour l'Irlande.
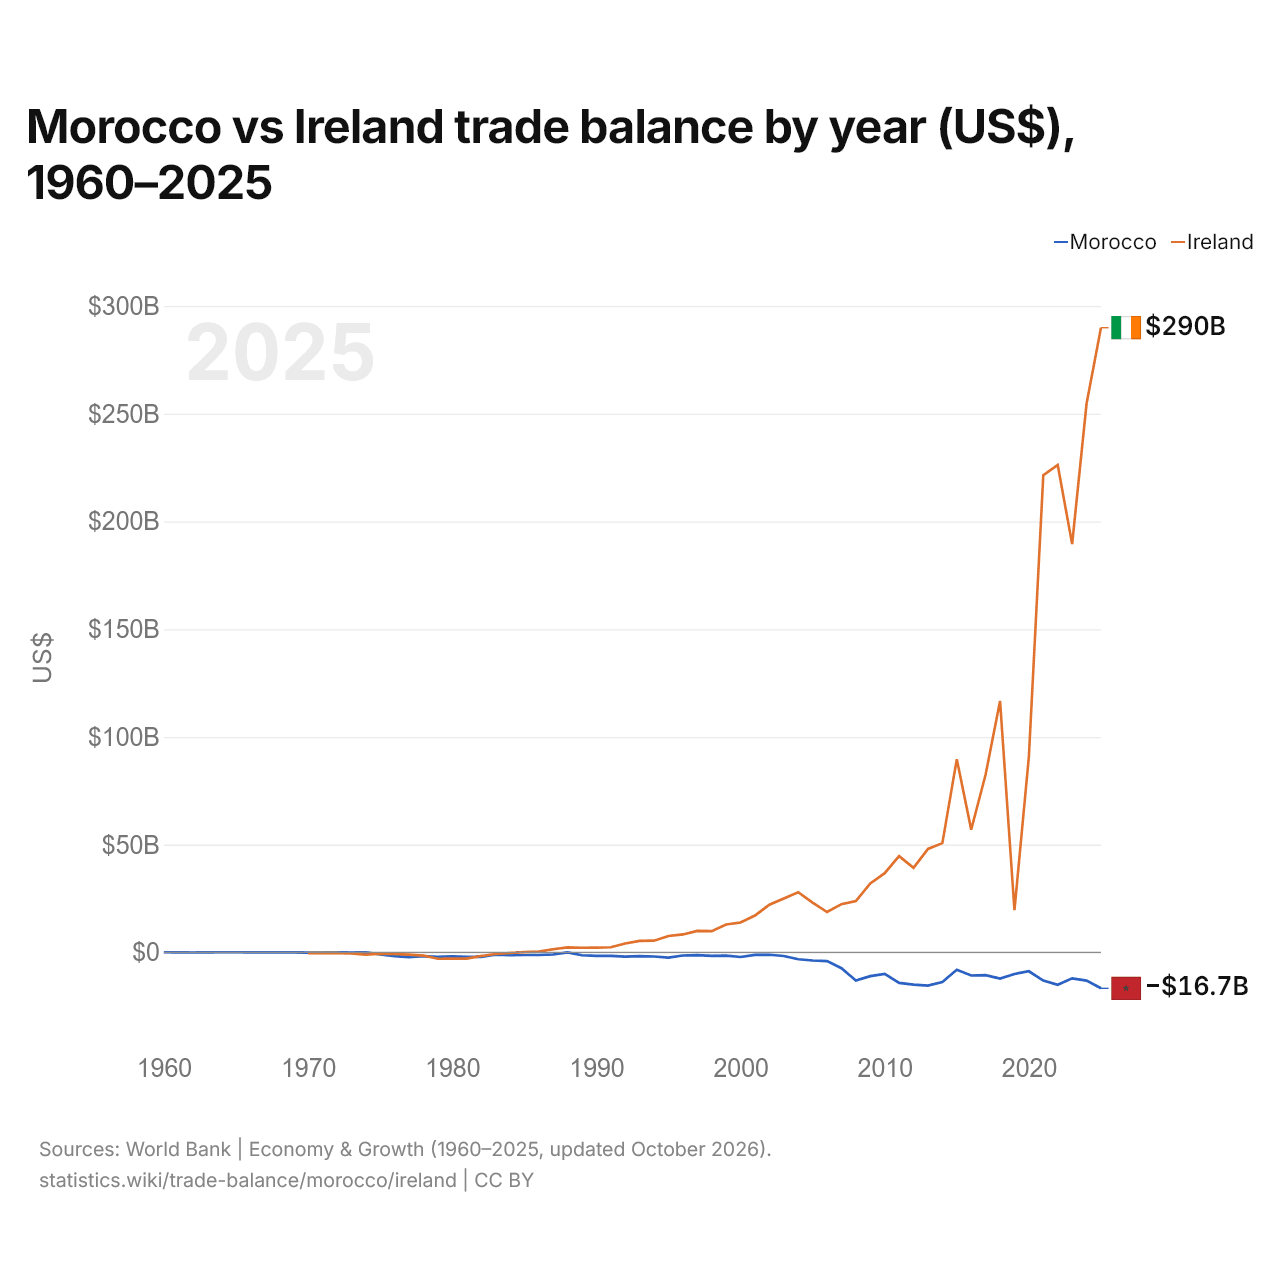
Maroc vs Irlande : balance commerciale par année ($ US), 1960–2025
| Année | $ US | |
|---|---|---|
 Maroc |
 Irlande |
|
| 2025 | −16 711 370 159 $ US | 289 939 322 234 $ US |
| 2024 | −13 154 358 447 $ US | 254 623 727 467 $ US |
| 2023 | −12 095 698 963 $ US | 189 520 115 565 $ US |
| 2022 | −15 070 969 799 $ US | 226 226 860 149 $ US |
| 2021 | −13 138 811 840 $ US | 221 508 442 679 $ US |
| 2020 | −8 804 922 307 $ US | 90 878 856 252 $ US |
| 2019 | −10 071 252 426 $ US | 19 530 878 451 $ US |
| 2018 | −12 222 219 618 $ US | 116 690 741 020 $ US |
| 2017 | −10 621 752 089 $ US | 82 519 979 053 $ US |
| 2016 | −10 770 661 075 $ US | 56 957 858 132 $ US |
| 2015 | −8 056 861 554 $ US | 89 639 843 125 $ US |
| 2014 | −13 852 049 948 $ US | 50 667 638 273 $ US |
| 2013 | −15 452 612 955 $ US | 47 978 450 103 $ US |
| 2012 | −15 001 080 728 $ US | 39 229 583 132 $ US |
| 2011 | −14 219 008 328 $ US | 44 621 241 404 $ US |
| 2010 | −10 050 304 390 $ US | 36 749 740 973 $ US |
| 2009 | −11 062 913 455 $ US | 31 969 096 553 $ US |
| 2008 | −13 124 997 984 $ US | 23 763 202 014 $ US |
| 2007 | −7 385 441 974 $ US | 22 353 730 250 $ US |
| 2006 | −4 108 550 667 $ US | 18 684 829 769 $ US |
| 2005 | −3 788 292 814 $ US | 23 051 810 861 $ US |
| 2004 | −3 208 669 864 $ US | 27 918 902 374 $ US |
| 2003 | −1 728 628 059 $ US | 24 947 120 311 $ US |
| 2002 | −1 139 912 204 $ US | 22 092 289 965 $ US |
| 2001 | −1 183 660 488 $ US | 17 066 865 501 $ US |
| 2000 | −2 170 940 439 $ US | 13 853 052 192 $ US |
| 1999 | −1 531 205 001 $ US | 12 904 847 541 $ US |
| 1998 | −1 668 096 217 $ US | 9 809 846 361 $ US |
| 1997 | −1 292 630 083 $ US | 9 926 325 215 $ US |
| 1996 | −1 477 676 771 $ US | 8 295 972 782 $ US |
| 1995 | −2 485 677 026 $ US | 7 561 709 596 $ US |
| 1994 | −1 935 637 021 $ US | 5 384 972 909 $ US |
| 1993 | −1 755 914 442 $ US | 5 310 547 738 $ US |
| 1992 | −1 995 360 541 $ US | 4 062 749 565 $ US |
| 1991 | −1 660 046 700 $ US | 2 351 692 230 $ US |
| 1990 | −1 662 325 914 $ US | 2 161 072 033 $ US |
| 1989 | −1 379 125 300 $ US | 2 115 397 924 $ US |
| 1988 | −37 146 581 $ US | 2 253 683 263 $ US |
| 1987 | −1 021 875 832 $ US | 1 402 758 661 $ US |
| 1986 | −1 268 123 845 $ US | 308 043 663 $ US |
| 1985 | −1 242 570 804 $ US | 66 860 998 $ US |
| 1984 | −1 348 202 879 $ US | −338 802 288 $ US |
| 1983 | −1 154 613 565 $ US | −794 919 252 $ US |
| 1982 | −2 146 213 313 $ US | −1 695 763 470 $ US |
| 1981 | −2 151 238 058 $ US | −2 940 177 462 $ US |
| 1980 | −1 883 905 741 $ US | −2 953 078 168 $ US |
| 1979 | −2 045 402 902 $ US | −2 981 858 478 $ US |
| 1978 | −1 813 126 114 $ US | −1 510 371 489 $ US |
| 1977 | −2 256 944 059 $ US | −1 076 042 039 $ US |
| 1976 | −1 803 221 859 $ US | −795 849 137 $ US |
| 1975 | −976 930 956 $ US | −626 193 380 $ US |
| 1974 | −48 812 671 $ US | −1 142 008 838 $ US |
| 1973 | −79 232 106 $ US | −538 410 187 $ US |
| 1972 | −32 929 056 $ US | −363 749 017 $ US |
| 1971 | −120 793 060 $ US | −385 203 143 $ US |
| 1970 | −155 973 038 $ US | −362 337 932 $ US |
| 1969 | −16 599 183 $ US | - |
| 1968 | −51 378 424 $ US | - |
| 1967 | −69 163 263 $ US | - |
| 1966 | −11 856 559 $ US | - |
| 1965 | 37 545 771 $ US | - |
| 1964 | 9 880 387 $ US | - |
| 1963 | −57 306 684 $ US | - |
| 1962 | −73 115 430 $ US | - |
| 1961 | −61 258 870 $ US | - |
| 1960 | 17 784 859 $ US | - |
En 2025, la balance commerciale du Maroc affichait un déficit de 16,7 milliards de dollars et celle de l'Irlande un excédent de 290 milliards de dollars. En 1970, la balance commerciale du Maroc affichait un déficit de 156 millions de dollars et celle de l'Irlande un déficit de 362 millions de dollars.
De 1970 à 2025, la balance commerciale du Maroc a été excédentaire pendant aucune des 56 années, et celle de l'Irlande pendant 41. Les balances commerciales du Maroc et de l'Irlande ont été déficitaires en même temps pendant 15 de ces années, la dernière fois en 1984.
Maroc vs Irlande : chiffres de la balance commerciale
|
Maroc
|
Irlande
|
|
|---|---|---|
| Biens et services, $ US | −16,7 Md $US (2025) | +290 Md $US (2025) |
| % du PIB | −9,2 % (2025) | +40,2 % (2025) |
| Années d'excédent depuis 2000 | 0 sur 26 | 26 sur 26 |
| Solde des biens entre les deux, chiffres propres | −157 M $US (2025) | +23,4 M $US (2025) |
| Premier excédent en biens avec | France (+1,63 Md $US, 2025) | États-Unis (+98,2 Md $US, 2025) |
| Premier déficit en biens avec | Chine (−11,8 Md $US, 2025) | France (−7,48 Md $US, 2025) |
Comparer la balance commerciale de 2 pays au choix
Sources :
- Banque mondiale | Économie et croissance (1960–2025, mis à jour en octobre 2026)
- TradeMap (2001–2025, mis à jour en octobre 2026)
Creative Commons Attribution (CC BY) : vous pouvez copier, partager, adapter et réutiliser ce contenu, y compris à des fins commerciales, à condition de citer statistics.wiki et d’indiquer les modifications apportées. Les sources citées ci-dessus peuvent avoir leurs propres conditions de licence.