
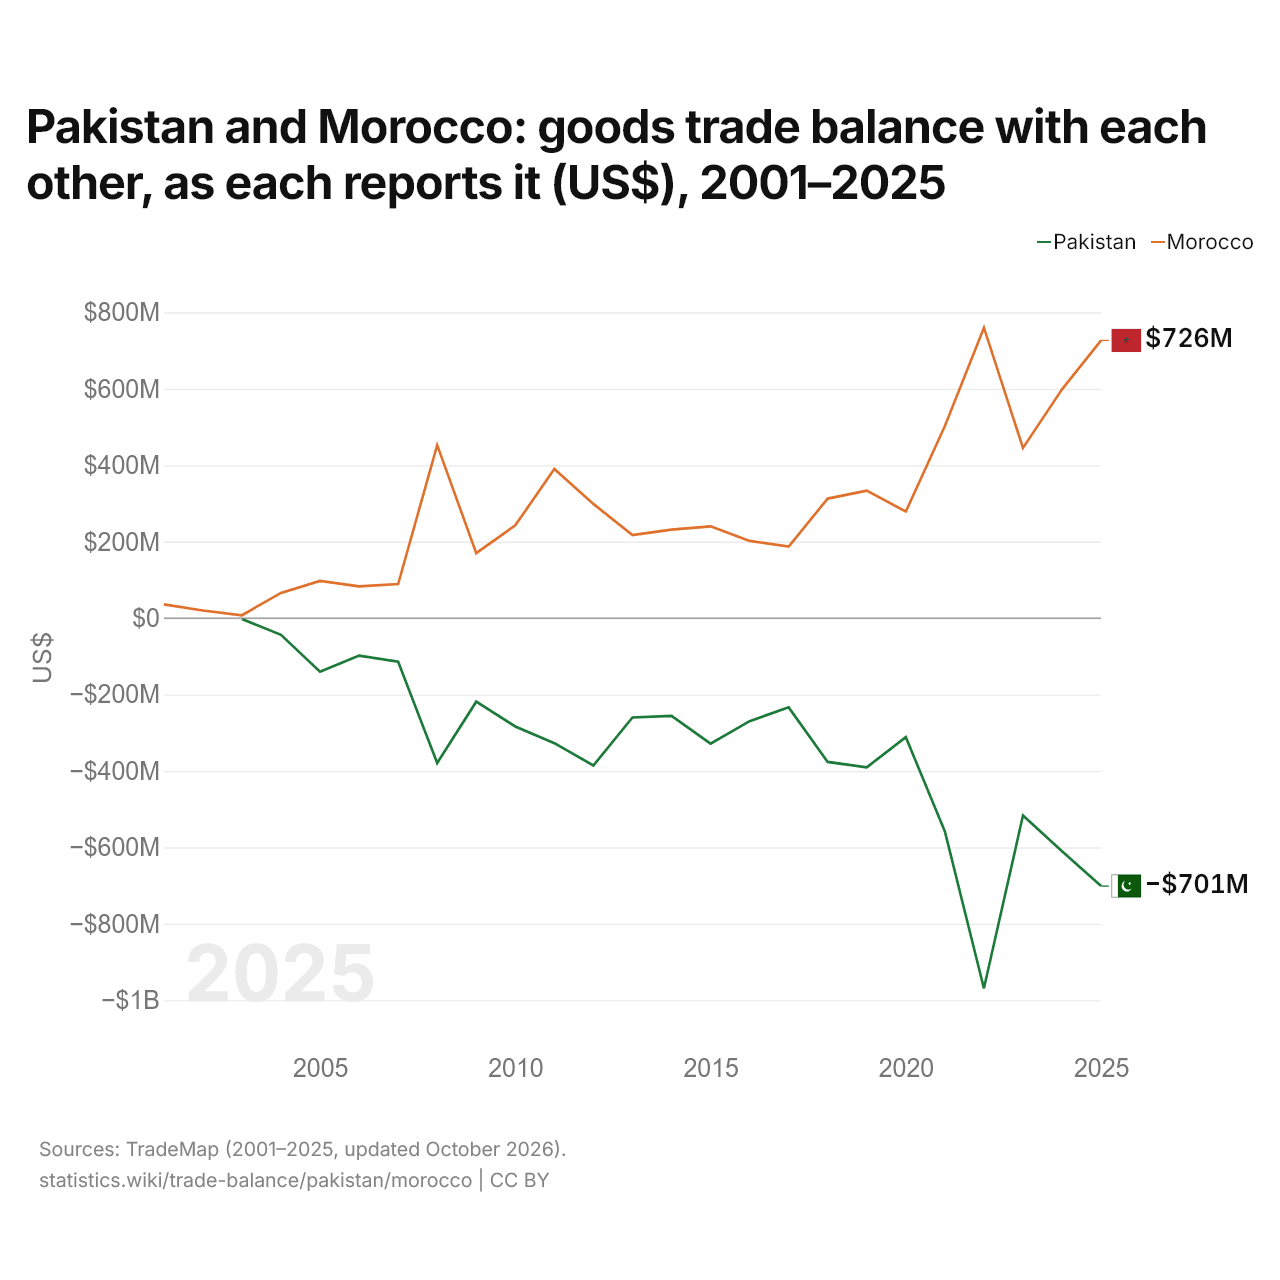
Le Pakistan et le Maroc : solde de leur commerce de biens bilatéral, selon chacun ($ US), 2001–2025
| Année | $ US | |
|---|---|---|
| Pakistan | Maroc | |
| 2025 | −701 237 000 $ US | 726 499 000 $ US |
| 2024 | −610 442 000 $ US | 598 461 000 $ US |
| 2023 | −516 735 000 $ US | 445 175 000 $ US |
| 2022 | −968 875 000 $ US | 759 770 000 $ US |
| 2021 | −558 445 000 $ US | 502 575 000 $ US |
| 2020 | −311 772 000 $ US | 278 652 000 $ US |
| 2019 | −390 593 000 $ US | 333 297 000 $ US |
| 2018 | −376 500 000 $ US | 312 632 000 $ US |
| 2017 | −233 686 000 $ US | 187 146 000 $ US |
| 2016 | −269 781 000 $ US | 201 833 000 $ US |
| 2015 | −328 777 000 $ US | 239 937 000 $ US |
| 2014 | −255 835 000 $ US | 231 289 000 $ US |
| 2013 | −260 125 000 $ US | 216 943 000 $ US |
| 2012 | −385 823 000 $ US | 298 611 000 $ US |
| 2011 | −327 476 000 $ US | 389 884 000 $ US |
| 2010 | −283 677 000 $ US | 242 794 000 $ US |
| 2009 | −218 788 000 $ US | 169 645 000 $ US |
| 2008 | −379 466 000 $ US | 452 458 000 $ US |
| 2007 | −114 382 000 $ US | 88 920 000 $ US |
| 2006 | −98 338 000 $ US | 83 024 000 $ US |
| 2005 | −140 583 000 $ US | 96 983 000 $ US |
| 2004 | −43 999 000 $ US | 65 744 000 $ US |
| 2003 | −2 501 000 $ US | 7 306 000 $ US |
| 2002 | - | 19 746 000 $ US |
| 2001 | - | 35 836 000 $ US |
En 2025, selon le Pakistan, son commerce de biens avec le Maroc affichait un déficit de 701 millions de dollars ; selon le Maroc, son commerce de biens avec le Pakistan affichait un excédent de 726 millions de dollars. En 2003, les chiffres étaient un déficit de 2,5 millions de dollars pour le Pakistan et un excédent de 7,31 millions de dollars pour le Maroc.
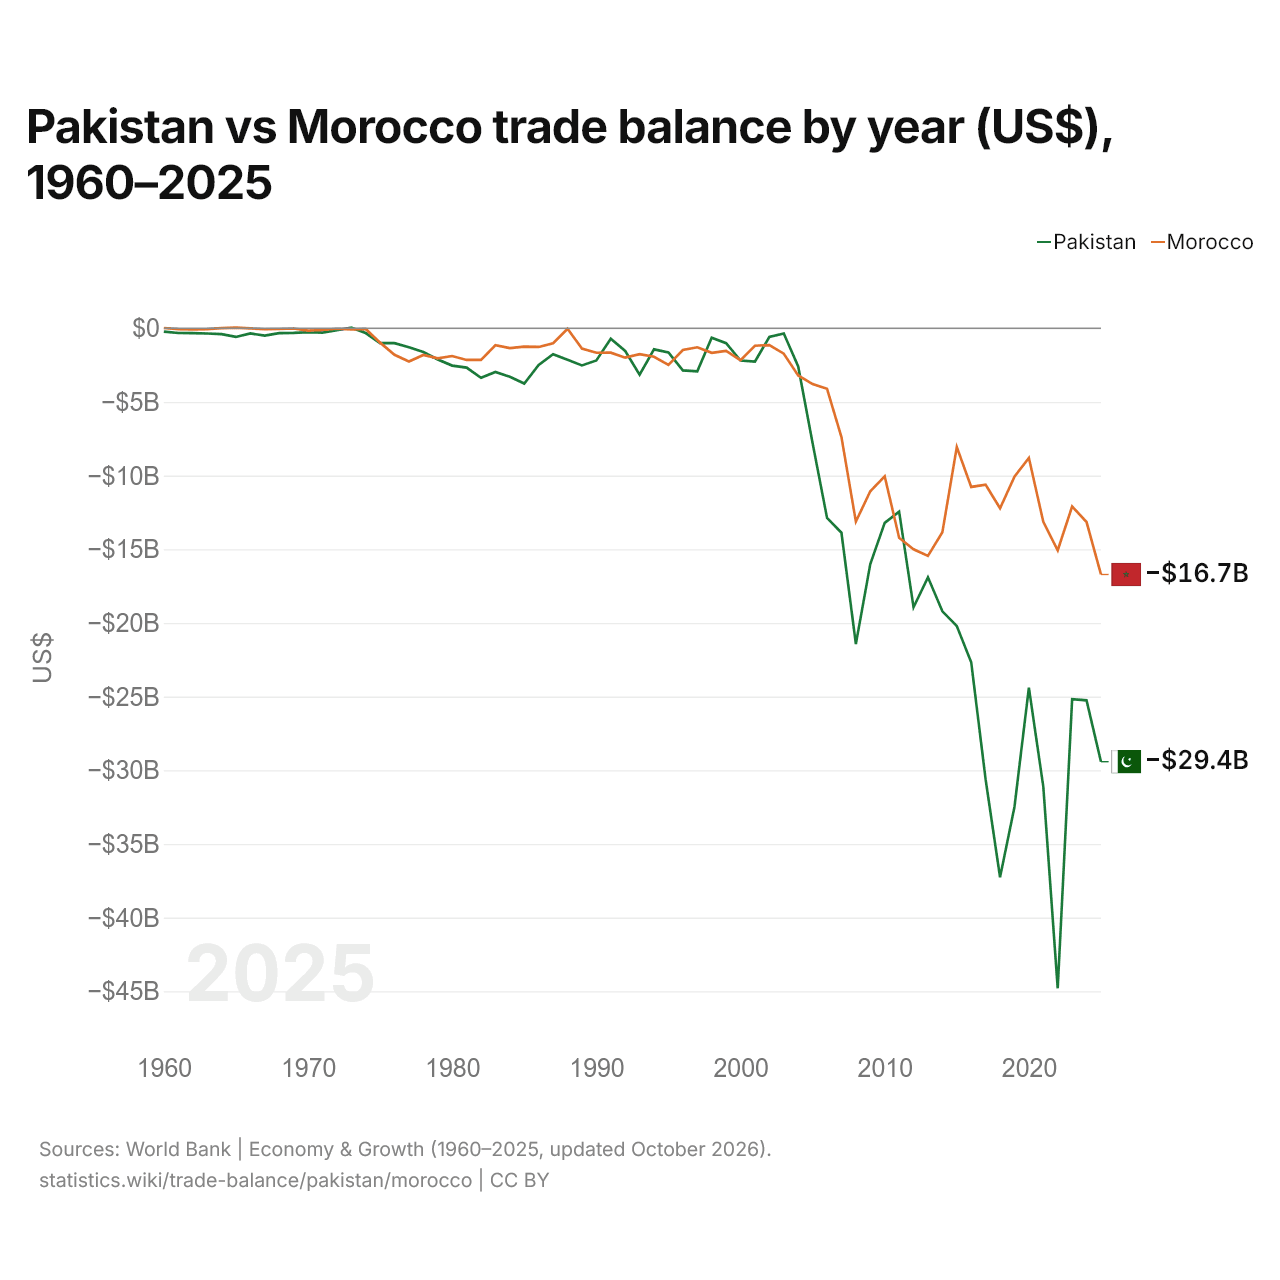
Pakistan vs Maroc : balance commerciale par année ($ US), 1960–2025
| Année | $ US | |
|---|---|---|
 Pakistan |
 Maroc |
|
| 2025 | −29 420 304 991 $ US | −16 711 370 159 $ US |
| 2024 | −25 257 703 998 $ US | −13 154 358 447 $ US |
| 2023 | −25 183 381 482 $ US | −12 095 698 963 $ US |
| 2022 | −44 800 038 644 $ US | −15 070 969 799 $ US |
| 2021 | −31 112 850 067 $ US | −13 138 811 840 $ US |
| 2020 | −24 392 041 495 $ US | −8 804 922 307 $ US |
| 2019 | −32 488 393 369 $ US | −10 071 252 426 $ US |
| 2018 | −37 259 759 399 $ US | −12 222 219 618 $ US |
| 2017 | −30 626 231 103 $ US | −10 621 752 089 $ US |
| 2016 | −22 669 632 006 $ US | −10 770 661 075 $ US |
| 2015 | −20 214 678 694 $ US | −8 056 861 554 $ US |
| 2014 | −19 214 125 936 $ US | −13 852 049 948 $ US |
| 2013 | −16 903 963 808 $ US | −15 452 612 955 $ US |
| 2012 | −18 935 710 905 $ US | −15 001 080 728 $ US |
| 2011 | −12 445 976 549 $ US | −14 219 008 328 $ US |
| 2010 | −13 208 171 673 $ US | −10 050 304 390 $ US |
| 2009 | −16 007 846 667 $ US | −11 062 913 455 $ US |
| 2008 | −21 428 199 020 $ US | −13 124 997 984 $ US |
| 2007 | −13 880 038 493 $ US | −7 385 441 974 $ US |
| 2006 | −12 871 731 104 $ US | −4 108 550 667 $ US |
| 2005 | −7 804 685 162 $ US | −3 788 292 814 $ US |
| 2004 | −2 594 600 000 $ US | −3 208 669 864 $ US |
| 2003 | −360 568 550 $ US | −1 728 628 059 $ US |
| 2002 | −590 557 973 $ US | −1 139 912 204 $ US |
| 2001 | −2 258 502 233 $ US | −1 183 660 488 $ US |
| 2000 | −2 189 374 438 $ US | −2 170 940 439 $ US |
| 1999 | −1 015 745 741 $ US | −1 531 205 001 $ US |
| 1998 | −648 129 008 $ US | −1 668 096 217 $ US |
| 1997 | −2 927 099 543 $ US | −1 292 630 083 $ US |
| 1996 | −2 864 555 918 $ US | −1 477 676 771 $ US |
| 1995 | −1 644 944 061 $ US | −2 485 677 026 $ US |
| 1994 | −1 433 344 463 $ US | −1 935 637 021 $ US |
| 1993 | −3 157 885 591 $ US | −1 755 914 442 $ US |
| 1992 | −1 541 375 310 $ US | −1 995 360 541 $ US |
| 1991 | −709 414 528 $ US | −1 660 046 700 $ US |
| 1990 | −2 183 424 485 $ US | −1 662 325 914 $ US |
| 1989 | −2 521 859 017 $ US | −1 379 125 300 $ US |
| 1988 | −2 141 612 076 $ US | −37 146 581 $ US |
| 1987 | −1 760 384 503 $ US | −1 021 875 832 $ US |
| 1986 | −2 492 684 439 $ US | −1 268 123 845 $ US |
| 1985 | −3 749 340 369 $ US | −1 242 570 804 $ US |
| 1984 | −3 293 781 538 $ US | −1 348 202 879 $ US |
| 1983 | −2 962 440 945 $ US | −1 154 613 565 $ US |
| 1982 | −3 361 895 735 $ US | −2 146 213 313 $ US |
| 1981 | −2 668 888 889 $ US | −2 151 238 058 $ US |
| 1980 | −2 534 646 465 $ US | −1 883 905 741 $ US |
| 1979 | −2 121 212 121 $ US | −2 045 402 902 $ US |
| 1978 | −1 613 232 323 $ US | −1 813 126 114 $ US |
| 1977 | −1 287 878 788 $ US | −2 256 944 059 $ US |
| 1976 | −1 007 373 737 $ US | −1 803 221 859 $ US |
| 1975 | −1 012 323 232 $ US | −976 930 956 $ US |
| 1974 | −327 474 747 $ US | −48 812 671 $ US |
| 1973 | 34 332 734 $ US | −79 232 106 $ US |
| 1972 | −138 453 590 $ US | −32 929 056 $ US |
| 1971 | −294 204 116 $ US | −120 793 060 $ US |
| 1970 | −274 044 519 $ US | −155 973 038 $ US |
| 1969 | −315 833 683 $ US | −16 599 183 $ US |
| 1968 | −326 963 461 $ US | −51 378 424 $ US |
| 1967 | −496 640 067 $ US | −69 163 263 $ US |
| 1966 | −353 002 940 $ US | −11 856 559 $ US |
| 1965 | −588 828 223 $ US | 37 545 771 $ US |
| 1964 | −399 832 003 $ US | 9 880 387 $ US |
| 1963 | −353 632 927 $ US | −57 306 684 $ US |
| 1962 | −331 583 368 $ US | −73 115 430 $ US |
| 1961 | −321 293 574 $ US | −61 258 870 $ US |
| 1960 | −226 585 468 $ US | 17 784 859 $ US |
En 2025, la balance commerciale du Pakistan affichait un déficit de 29,4 milliards de dollars et celle du Maroc un déficit de 16,7 milliards de dollars ; le déficit du Pakistan était 1,8 fois plus grand. En 1960, la balance commerciale du Pakistan affichait un déficit de 227 millions de dollars et celle du Maroc un excédent de 17,8 millions de dollars.
De 1960 à 2025, la balance commerciale du Pakistan a été excédentaire pendant une des 66 années, et celle du Maroc pendant 3. Les balances commerciales du Pakistan et du Maroc ont été déficitaires en même temps pendant 62 de ces années, la dernière fois en 2025.
Pakistan vs Maroc : chiffres de la balance commerciale
|
Pakistan
|
Maroc
|
|
|---|---|---|
| Biens et services, $ US | −29,4 Md $US (2025) | −16,7 Md $US (2025) |
| % du PIB | −7,2 % (2025) | −9,2 % (2025) |
| Années d'excédent depuis 2000 | 0 sur 26 | 0 sur 26 |
| Solde des biens entre les deux, chiffres propres | −701 M $US (2025) | +726 M $US (2025) |
| Premier excédent en biens avec | États-Unis (+3,17 Md $US, 2025) | France (+1,63 Md $US, 2025) |
| Premier déficit en biens avec | Chine (−18,2 Md $US, 2025) | Chine (−11,8 Md $US, 2025) |
Comparer la balance commerciale de 2 pays au choix
Sources :
- Banque mondiale | Économie et croissance (1960–2025, mis à jour en octobre 2026)
- TradeMap (2001–2025, mis à jour en octobre 2026)
Creative Commons Attribution (CC BY) : vous pouvez copier, partager, adapter et réutiliser ce contenu, y compris à des fins commerciales, à condition de citer statistics.wiki et d’indiquer les modifications apportées. Les sources citées ci-dessus peuvent avoir leurs propres conditions de licence.