
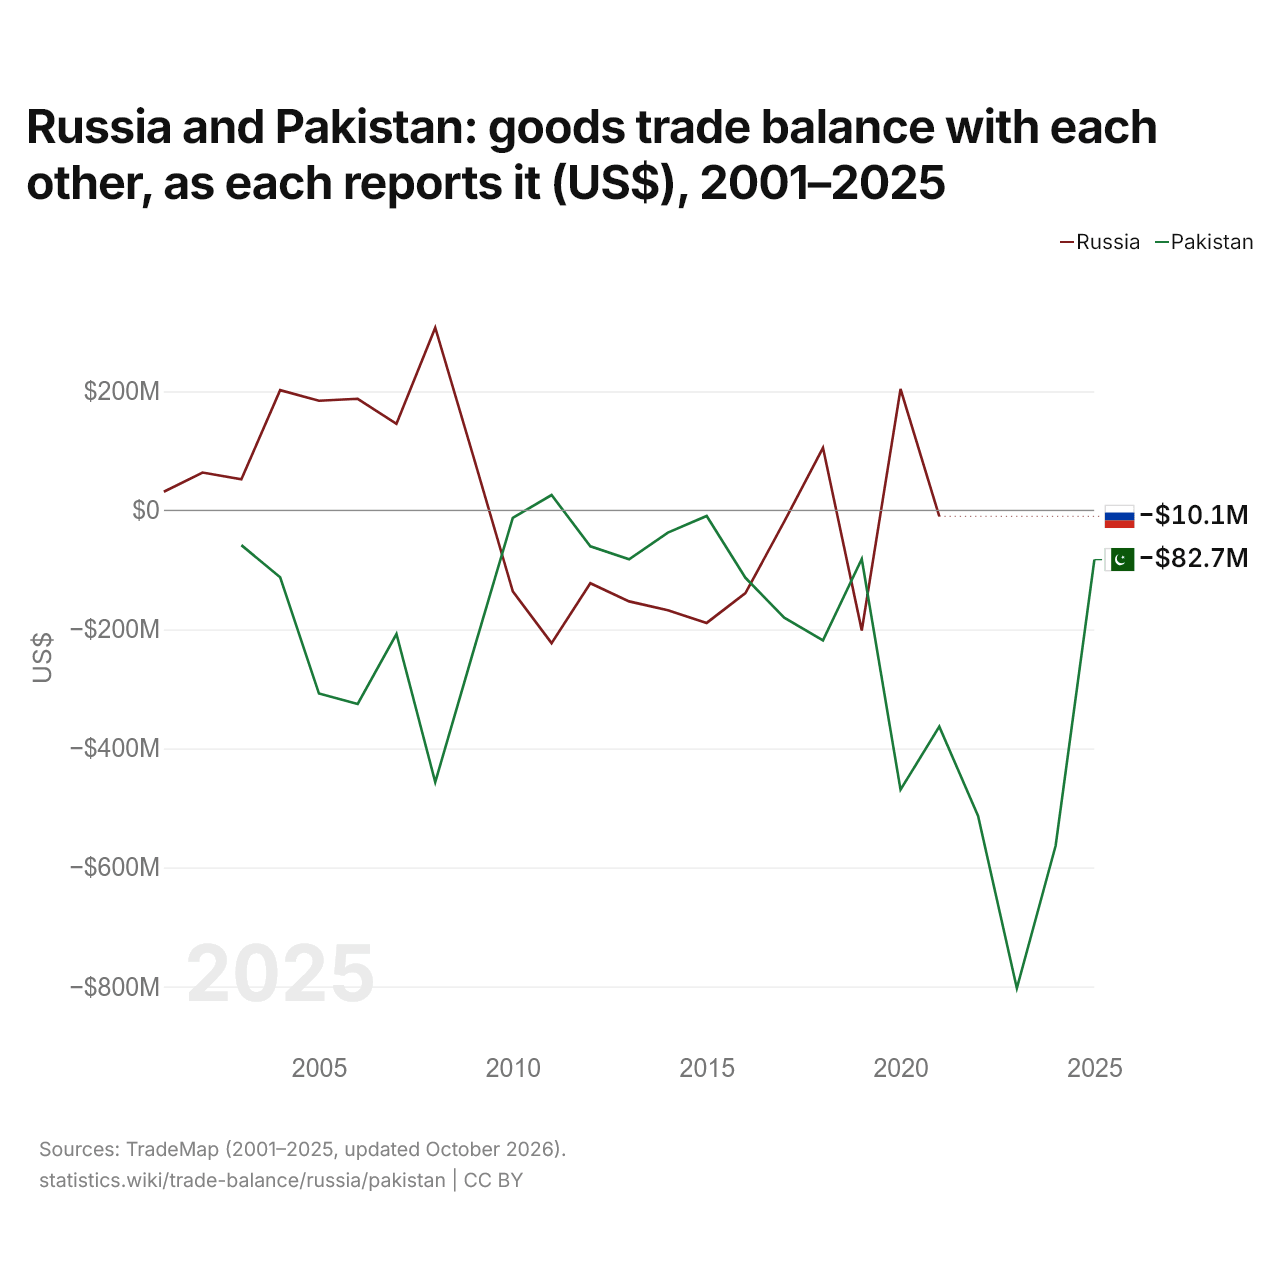
La Russie et le Pakistan : solde de leur commerce de biens bilatéral, selon chacun ($ US), 2001–2025
| Année | $ US | |
|---|---|---|
| Russie | Pakistan | |
| 2025 | - | −82 718 000 $ US |
| 2024 | - | −563 451 000 $ US |
| 2023 | - | −802 963 000 $ US |
| 2022 | - | −513 281 000 $ US |
| 2021 | −10 086 000 $ US | −363 343 000 $ US |
| 2020 | 203 974 000 $ US | −469 371 000 $ US |
| 2019 | −201 637 000 $ US | −81 603 000 $ US |
| 2018 | 105 284 000 $ US | −218 401 000 $ US |
| 2017 | −19 000 000 $ US | −180 262 000 $ US |
| 2016 | −139 046 000 $ US | −113 237 000 $ US |
| 2015 | −189 071 000 $ US | −9 316 000 $ US |
| 2014 | −167 781 000 $ US | −37 293 000 $ US |
| 2013 | −152 937 000 $ US | −82 248 000 $ US |
| 2012 | −122 249 000 $ US | −60 321 000 $ US |
| 2011 | −222 994 000 $ US | 25 915 000 $ US |
| 2010 | −135 904 000 $ US | −12 545 000 $ US |
| 2009 | 87 000 000 $ US | −232 860 000 $ US |
| 2008 | 306 981 000 $ US | −456 549 000 $ US |
| 2007 | 145 468 000 $ US | −207 650 000 $ US |
| 2006 | 187 570 000 $ US | −325 202 000 $ US |
| 2005 | 184 265 000 $ US | −307 629 000 $ US |
| 2004 | 202 125 000 $ US | −112 395 000 $ US |
| 2003 | 52 157 000 $ US | −58 309 000 $ US |
| 2002 | 63 587 000 $ US | - |
| 2001 | 31 294 000 $ US | - |
Selon la Russie, son commerce de biens avec le Pakistan affichait un déficit de 10,1 millions de dollars ; selon le Pakistan, son commerce de biens avec la Russie affichait un déficit de 363 millions de dollars. En 2003, les chiffres étaient un excédent de 52,2 millions de dollars pour la Russie et un déficit de 58,3 millions de dollars pour le Pakistan.
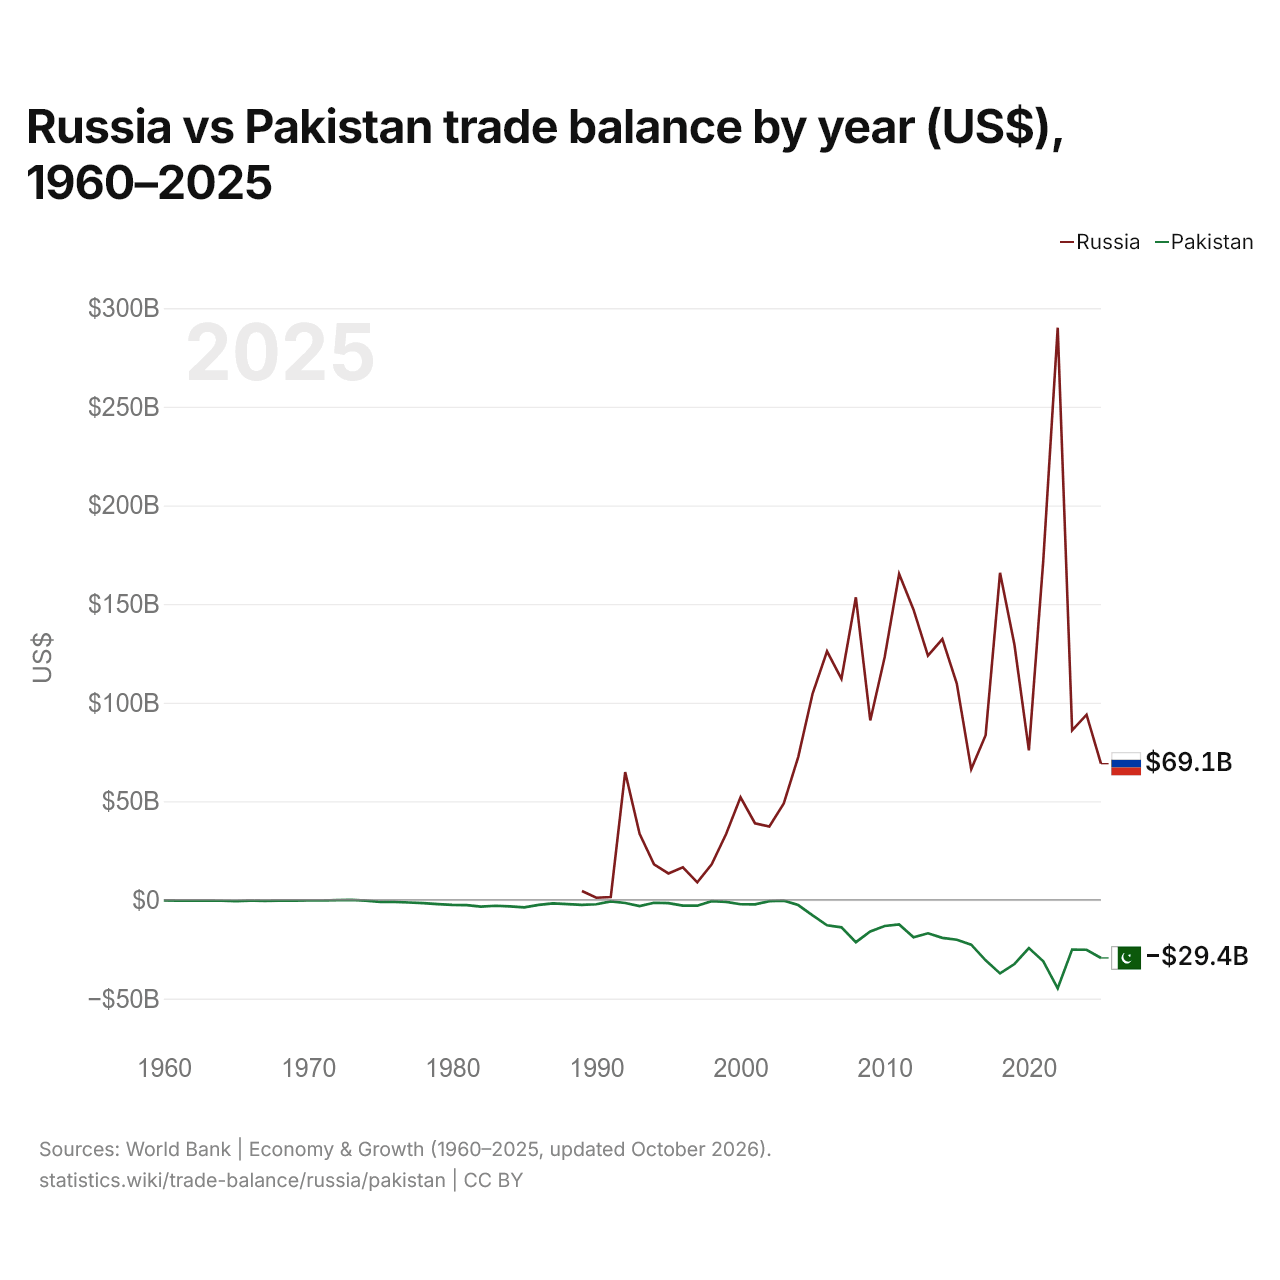
Russie vs Pakistan : balance commerciale par année ($ US), 1960–2025
| Année | $ US | |
|---|---|---|
 Russie |
 Pakistan |
|
| 2025 | 69 055 585 640 $ US | −29 420 304 991 $ US |
| 2024 | 93 893 816 547 $ US | −25 257 703 998 $ US |
| 2023 | 85 951 472 633 $ US | −25 183 381 482 $ US |
| 2022 | 290 068 143 739 $ US | −44 800 038 644 $ US |
| 2021 | 172 284 578 090 $ US | −31 112 850 067 $ US |
| 2020 | 75 810 373 408 $ US | −24 392 041 495 $ US |
| 2019 | 129 321 947 359 $ US | −32 488 393 369 $ US |
| 2018 | 165 825 907 084 $ US | −37 259 759 399 $ US |
| 2017 | 83 515 016 703 $ US | −30 626 231 103 $ US |
| 2016 | 66 276 014 682 $ US | −22 669 632 006 $ US |
| 2015 | 109 725 268 369 $ US | −20 214 678 694 $ US |
| 2014 | 132 220 872 122 $ US | −19 214 125 936 $ US |
| 2013 | 123 874 176 654 $ US | −16 903 963 808 $ US |
| 2012 | 147 144 126 698 $ US | −18 935 710 905 $ US |
| 2011 | 165 214 881 959 $ US | −12 445 976 549 $ US |
| 2010 | 123 146 419 502 $ US | −13 208 171 673 $ US |
| 2009 | 90 978 810 006 $ US | −16 007 846 667 $ US |
| 2008 | 153 406 799 012 $ US | −21 428 199 020 $ US |
| 2007 | 112 060 410 827 $ US | −13 880 038 493 $ US |
| 2006 | 125 994 089 653 $ US | −12 871 731 104 $ US |
| 2005 | 104 615 816 709 $ US | −7 804 685 162 $ US |
| 2004 | 72 422 769 872 $ US | −2 594 600 000 $ US |
| 2003 | 48 937 794 101 $ US | −360 568 550 $ US |
| 2002 | 37 240 829 346 $ US | −590 557 973 $ US |
| 2001 | 38 865 272 540 $ US | −2 258 502 233 $ US |
| 2000 | 52 012 086 740 $ US | −2 189 374 438 $ US |
| 1999 | 33 395 613 323 $ US | −1 015 745 741 $ US |
| 1998 | 18 073 158 166 $ US | −648 129 008 $ US |
| 1997 | 8 919 619 706 $ US | −2 927 099 543 $ US |
| 1996 | 16 544 404 558 $ US | −2 864 555 918 $ US |
| 1995 | 13 428 951 157 $ US | −1 644 944 061 $ US |
| 1994 | 18 027 556 763 $ US | −1 433 344 463 $ US |
| 1993 | 33 548 198 884 $ US | −3 157 885 591 $ US |
| 1992 | 64 753 026 634 $ US | −1 541 375 310 $ US |
| 1991 | 1 481 481 481 $ US | −709 414 528 $ US |
| 1990 | 1 123 595 506 $ US | −2 183 424 485 $ US |
| 1989 | 4 509 283 820 $ US | −2 521 859 017 $ US |
| 1988 | - | −2 141 612 076 $ US |
| 1987 | - | −1 760 384 503 $ US |
| 1986 | - | −2 492 684 439 $ US |
| 1985 | - | −3 749 340 369 $ US |
| 1984 | - | −3 293 781 538 $ US |
| 1983 | - | −2 962 440 945 $ US |
| 1982 | - | −3 361 895 735 $ US |
| 1981 | - | −2 668 888 889 $ US |
| 1980 | - | −2 534 646 465 $ US |
| 1979 | - | −2 121 212 121 $ US |
| 1978 | - | −1 613 232 323 $ US |
| 1977 | - | −1 287 878 788 $ US |
| 1976 | - | −1 007 373 737 $ US |
| 1975 | - | −1 012 323 232 $ US |
| 1974 | - | −327 474 747 $ US |
| 1973 | - | 34 332 734 $ US |
| 1972 | - | −138 453 590 $ US |
| 1971 | - | −294 204 116 $ US |
| 1970 | - | −274 044 519 $ US |
| 1969 | - | −315 833 683 $ US |
| 1968 | - | −326 963 461 $ US |
| 1967 | - | −496 640 067 $ US |
| 1966 | - | −353 002 940 $ US |
| 1965 | - | −588 828 223 $ US |
| 1964 | - | −399 832 003 $ US |
| 1963 | - | −353 632 927 $ US |
| 1962 | - | −331 583 368 $ US |
| 1961 | - | −321 293 574 $ US |
| 1960 | - | −226 585 468 $ US |
En 2025, la balance commerciale de la Russie affichait un excédent de 69,1 milliards de dollars et celle du Pakistan un déficit de 29,4 milliards de dollars. En 1989, la balance commerciale de la Russie affichait un excédent de 4,51 milliards de dollars et celle du Pakistan un déficit de 2,52 milliards de dollars.
De 1989 à 2025, la balance commerciale de la Russie a été excédentaire chacune des 37 années, et celle du Pakistan pendant aucune. Les balances commerciales de la Russie et du Pakistan n'ont jamais été déficitaires la même année.
Russie vs Pakistan : chiffres de la balance commerciale
|
Russie
|
Pakistan
|
|
|---|---|---|
| Biens et services, $ US | +69,1 Md $US (2025) | −29,4 Md $US (2025) |
| % du PIB | +2,7 % (2025) | −7,2 % (2025) |
| Années d'excédent depuis 2000 | 26 sur 26 | 0 sur 26 |
| Solde des biens entre les deux, chiffres propres | −10,1 M $US (2021) | −82,7 M $US (2025) |
| Premier excédent en biens avec | Pays-Bas (+37,9 Md $US, 2021) | États-Unis (+3,17 Md $US, 2025) |
| Premier déficit en biens avec | Chine (−4,01 Md $US, 2021) | Chine (−18,2 Md $US, 2025) |
Comparer la balance commerciale de 2 pays au choix
Sources :
- Banque mondiale | Économie et croissance (1960–2025, mis à jour en octobre 2026)
- TradeMap (2001–2025, mis à jour en octobre 2026)
Creative Commons Attribution (CC BY) : vous pouvez copier, partager, adapter et réutiliser ce contenu, y compris à des fins commerciales, à condition de citer statistics.wiki et d’indiquer les modifications apportées. Les sources citées ci-dessus peuvent avoir leurs propres conditions de licence.