
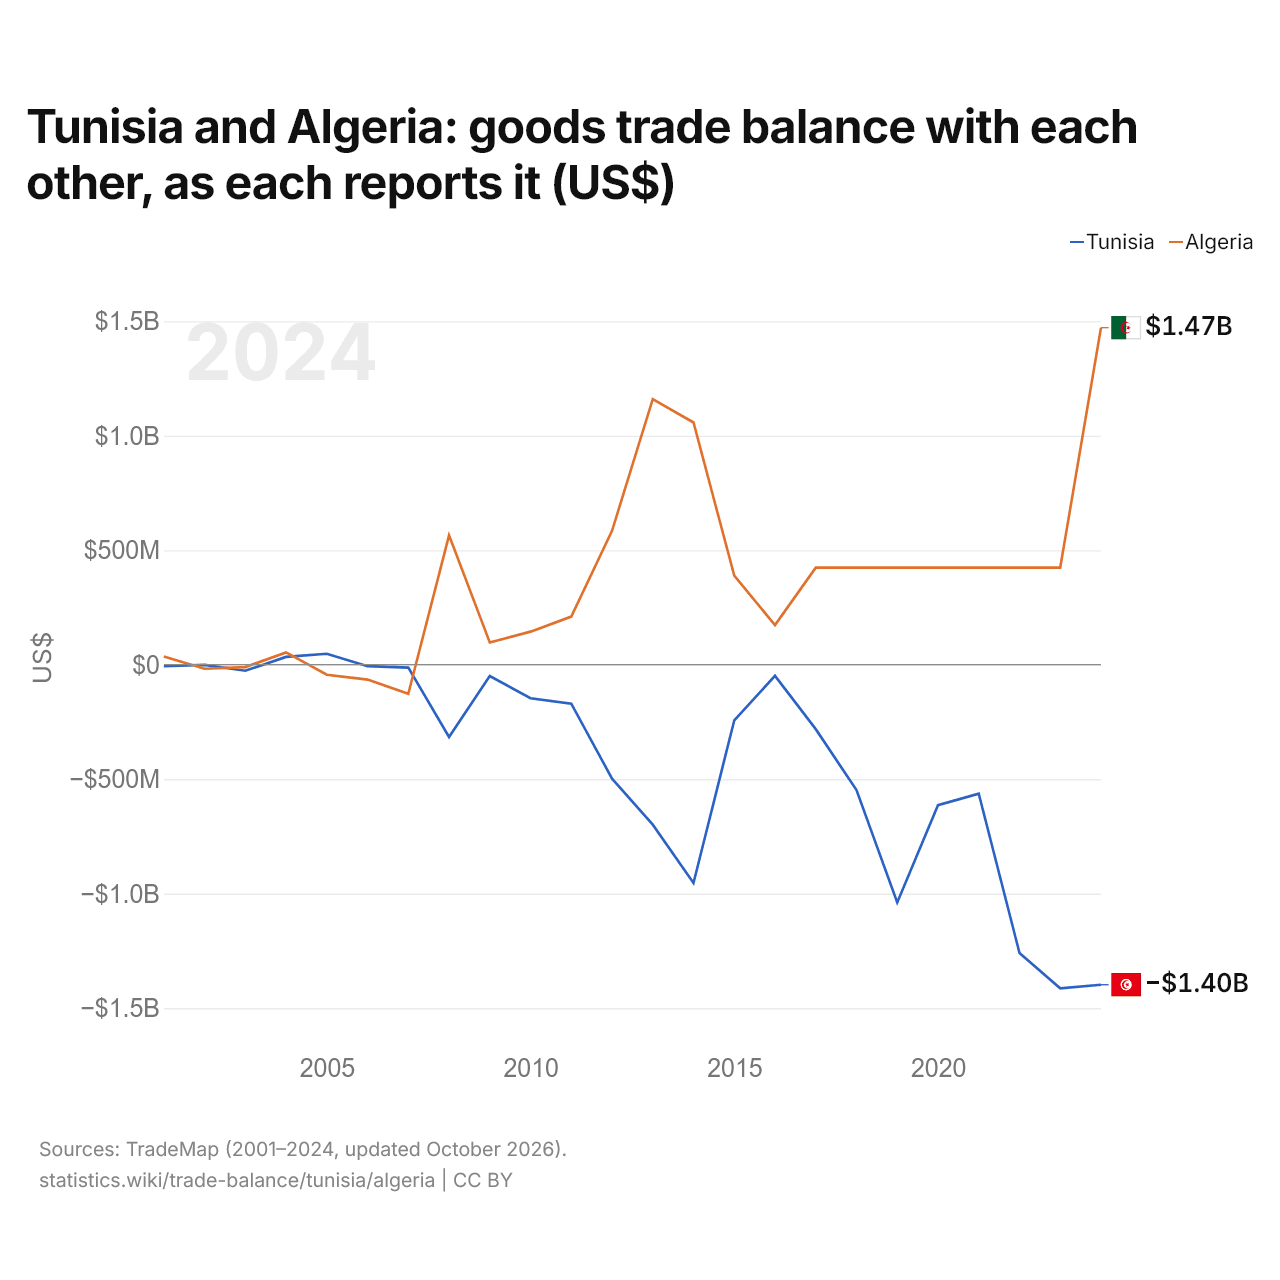
La Tunisie et l'Algérie : solde de leur commerce de biens bilatéral, selon chacun ($ US)
| Année | $ US | |
|---|---|---|
| Tunisie | Algérie | |
| 2024 | −1 398 156 000 $ US | 1 471 578 000 $ US |
| 2023 | −1 413 688 000 $ US | 423 835 000 $ US |
| 2022 | −1 259 316 000 $ US | 423 835 000 $ US |
| 2021 | −563 934 000 $ US | 423 835 000 $ US |
| 2020 | −613 627 000 $ US | 423 835 000 $ US |
| 2019 | −1 039 274 000 $ US | 423 835 000 $ US |
| 2018 | −548 047 000 $ US | 423 835 000 $ US |
| 2017 | −281 731 000 $ US | 423 835 000 $ US |
| 2016 | −48 955 000 $ US | 172 492 000 $ US |
| 2015 | −243 162 000 $ US | 388 417 000 $ US |
| 2014 | −953 470 000 $ US | 1 057 579 000 $ US |
| 2013 | −698 797 000 $ US | 1 159 831 000 $ US |
| 2012 | −497 816 000 $ US | 584 381 000 $ US |
| 2011 | −170 684 000 $ US | 209 891 000 $ US |
| 2010 | −146 748 000 $ US | 144 077 000 $ US |
| 2009 | −49 912 000 $ US | 96 548 000 $ US |
| 2008 | −316 259 000 $ US | 564 791 000 $ US |
| 2007 | −12 847 000 $ US | −127 199 000 $ US |
| 2006 | −6 777 000 $ US | −65 337 000 $ US |
| 2005 | 47 563 000 $ US | −44 229 000 $ US |
| 2004 | 33 810 000 $ US | 53 214 000 $ US |
| 2003 | −26 647 000 $ US | −10 816 000 $ US |
| 2002 | −1 107 000 $ US | −18 108 000 $ US |
| 2001 | −7 049 000 $ US | 35 602 000 $ US |
Selon la Tunisie, son commerce de biens avec l'Algérie affiche un déficit de 1,4 milliard de dollars ; selon l'Algérie, son commerce de biens avec la Tunisie affiche un excédent de 1,47 milliard de dollars. En 2001, les chiffres étaient un déficit de 7,05 millions de dollars pour la Tunisie et un excédent de 35,6 millions de dollars pour l'Algérie.
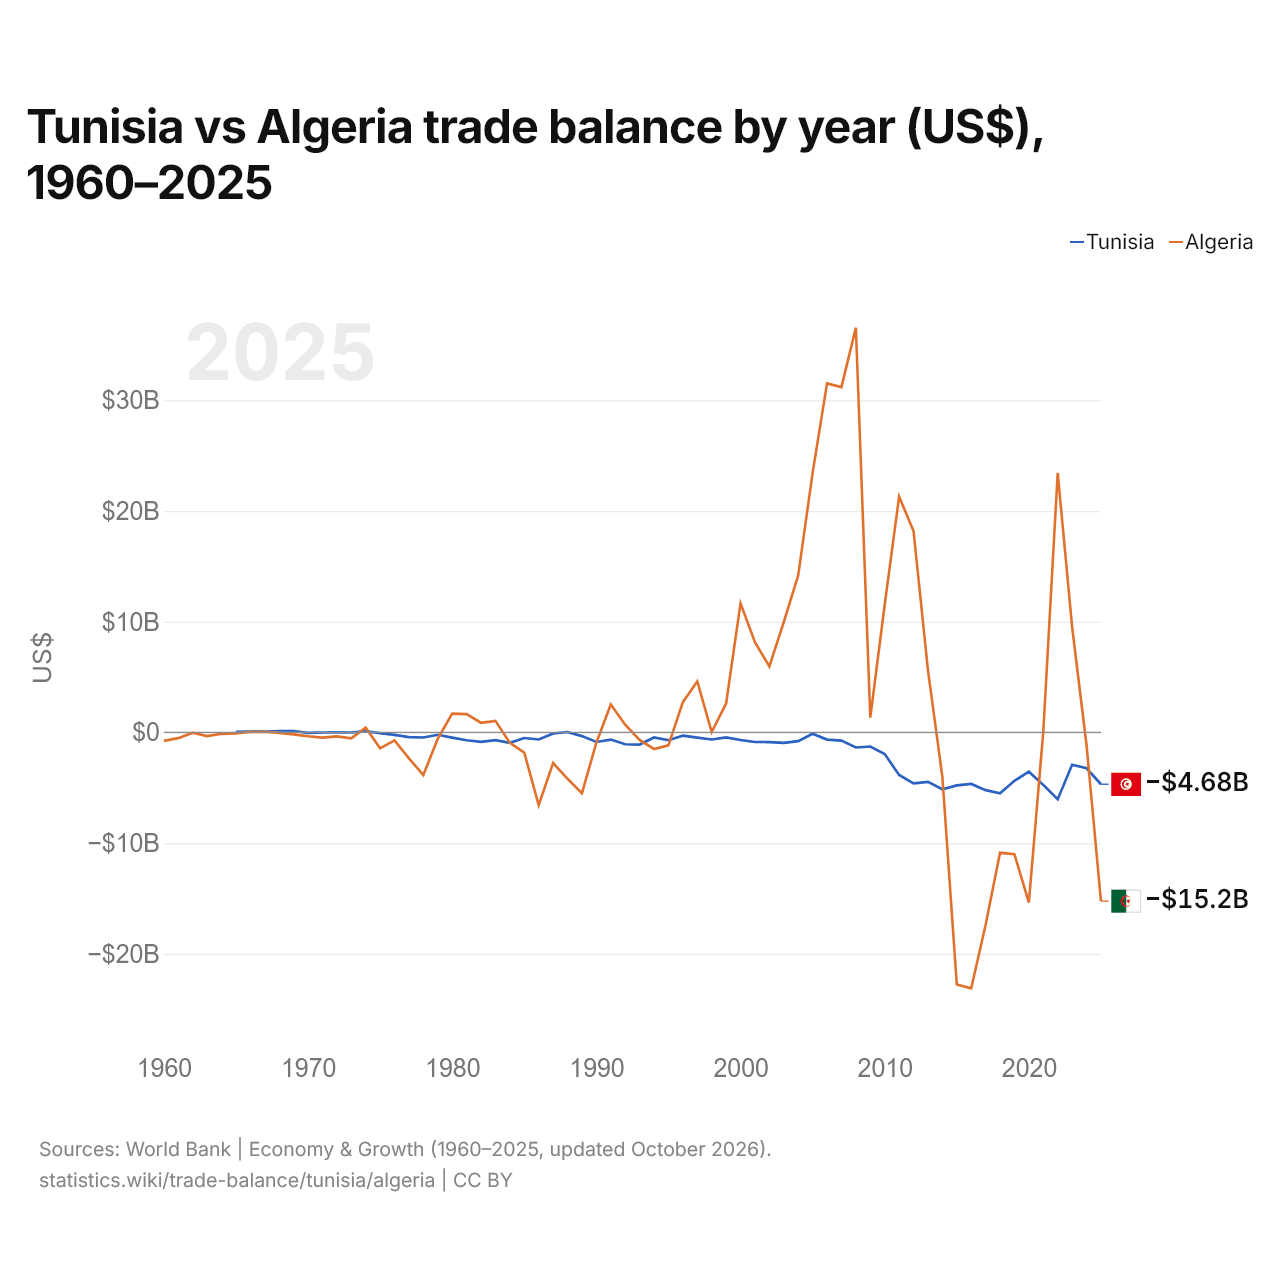
Tunisie vs Algérie : balance commerciale par année ($ US), 1960–2025
| Année | $ US | |
|---|---|---|
 Tunisie |
 Algérie |
|
| 2025 | −4 682 306 614 $ US | −15 239 617 821 $ US |
| 2024 | −3 236 480 072 $ US | −1 157 584 835 $ US |
| 2023 | −2 916 456 198 $ US | 9 521 076 816 $ US |
| 2022 | −6 040 340 250 $ US | 23 444 752 182 $ US |
| 2021 | −4 741 691 349 $ US | 96 235 574 $ US |
| 2020 | −3 547 948 021 $ US | −15 365 137 785 $ US |
| 2019 | −4 371 577 064 $ US | −11 009 709 489 $ US |
| 2018 | −5 506 699 052 $ US | −10 875 510 422 $ US |
| 2017 | −5 214 627 442 $ US | −17 380 666 509 $ US |
| 2016 | −4 658 727 310 $ US | −23 115 278 741 $ US |
| 2015 | −4 783 432 103 $ US | −22 777 389 612 $ US |
| 2014 | −5 133 844 817 $ US | −4 025 154 588 $ US |
| 2013 | −4 467 155 549 $ US | 5 622 451 757 $ US |
| 2012 | −4 601 047 256 $ US | 18 189 545 505 $ US |
| 2011 | −3 848 456 900 $ US | 21 300 645 647 $ US |
| 2010 | −1 955 235 015 $ US | 11 529 793 187 $ US |
| 2009 | −1 276 406 658 $ US | 1 333 701 926 $ US |
| 2008 | −1 362 829 934 $ US | 36 556 358 659 $ US |
| 2007 | −740 542 456 $ US | 31 196 364 969 $ US |
| 2006 | −647 621 194 $ US | 31 525 542 339 $ US |
| 2005 | −124 784 864 $ US | 23 445 463 437 $ US |
| 2004 | −788 700 142 $ US | 14 180 370 410 $ US |
| 2003 | −939 805 566 $ US | 9 970 802 368 $ US |
| 2002 | −873 019 055 $ US | 5 957 664 162 $ US |
| 2001 | −864 661 680 $ US | 8 147 248 966 $ US |
| 2000 | −682 652 371 $ US | 11 659 995 021 $ US |
| 1999 | −446 711 206 $ US | 2 612 547 339 $ US |
| 1998 | −640 980 043 $ US | 30 000 490 $ US |
| 1997 | −471 467 789 $ US | 4 609 976 585 $ US |
| 1996 | −294 121 273 $ US | 2 730 002 864 $ US |
| 1995 | −704 240 245 $ US | −1 170 007 106 $ US |
| 1994 | −459 589 898 $ US | −1 498 790 716 $ US |
| 1993 | −1 098 589 080 $ US | −676 792 326 $ US |
| 1992 | −1 073 908 368 $ US | 696 095 512 $ US |
| 1991 | −647 826 087 $ US | 2 522 617 373 $ US |
| 1990 | −866 136 364 $ US | −926 597 364 $ US |
| 1989 | −334 976 262 $ US | −5 493 813 611 $ US |
| 1988 | 36 371 945 $ US | −4 192 895 866 $ US |
| 1987 | −95 937 789 $ US | −2 763 033 271 $ US |
| 1986 | −642 042 041 $ US | −6 571 229 226 $ US |
| 1985 | −507 132 449 $ US | −1 829 825 550 $ US |
| 1984 | −938 168 178 $ US | −943 135 164 $ US |
| 1983 | −697 735 747 $ US | 1 044 102 802 $ US |
| 1982 | −856 460 359 $ US | 871 043 284 $ US |
| 1981 | −713 643 470 $ US | 1 645 114 472 $ US |
| 1980 | −469 004 693 $ US | 1 693 833 066 $ US |
| 1979 | −214 780 225 $ US | −570 943 669 $ US |
| 1978 | −463 991 965 $ US | −3 857 888 449 $ US |
| 1977 | −430 769 231 $ US | −2 339 177 208 $ US |
| 1976 | −222 261 093 $ US | −720 491 495 $ US |
| 1975 | −81 040 702 $ US | −1 443 254 204 $ US |
| 1974 | 112 025 438 $ US | 430 545 118 $ US |
| 1973 | −9 724 950 $ US | −529 969 047 $ US |
| 1972 | 13 624 464 $ US | −357 101 806 $ US |
| 1971 | −5 545 813 $ US | −468 180 171 $ US |
| 1970 | −39 619 048 $ US | −344 334 543 $ US |
| 1969 | 122 095 238 $ US | −182 294 787 $ US |
| 1968 | 122 476 190 $ US | −40 509 939 $ US |
| 1967 | 72 571 429 $ US | 60 764 909 $ US |
| 1966 | 78 666 667 $ US | 40 509 939 $ US |
| 1965 | 46 095 238 $ US | −101 274 848 $ US |
| 1964 | - | −126 721 207 $ US |
| 1963 | - | −328 164 535 $ US |
| 1962 | - | −20 510 283 $ US |
| 1961 | - | −517 608 091 $ US |
| 1960 | - | −765 348 446 $ US |
En 2025, la balance commerciale de la Tunisie affichait un déficit de 4,68 milliards de dollars et celle de l'Algérie un déficit de 15,2 milliards de dollars ; le déficit de l'Algérie était 3,3 fois plus grand. En 1965, la balance commerciale de la Tunisie affichait un excédent de 46,1 millions de dollars et celle de l'Algérie un déficit de 101 millions de dollars.
De 1965 à 2025, la balance commerciale de la Tunisie a été excédentaire pendant 8 des 61 années, et celle de l'Algérie pendant 30. Les balances commerciales de la Tunisie et de l'Algérie ont été déficitaires en même temps pendant 26 de ces années, la dernière fois en 2025.
Tunisie vs Algérie : chiffres de la balance commerciale
|
Tunisie
|
Algérie
|
|
|---|---|---|
| Biens et services, $ US | −4,68 Md $US (2025) | −15,2 Md $US (2025) |
| % du PIB | −8,1 % (2025) | −5,3 % (2025) |
| Années d'excédent depuis 2000 | 0 sur 26 | 17 sur 26 |
| Solde des biens entre les deux, chiffres propres | −1,40 Md $US (2024) | +1,47 Md $US (2024) |
| Premier excédent en biens avec | France (+1,66 Md $US, 2024) | Italie (+9,26 Md $US, 2024) |
| Premier déficit en biens avec | Chine (−2,91 Md $US, 2024) | Chine (−8,59 Md $US, 2024) |
Comparer la balance commerciale de 2 pays au choix
Sources :
- Banque mondiale | Économie et croissance (1960–2025, mis à jour en octobre 2026)
- TradeMap (2001–2024, mis à jour en octobre 2026)
Creative Commons Attribution (CC BY) : vous pouvez copier, partager, adapter et réutiliser ce contenu, y compris à des fins commerciales, à condition de citer statistics.wiki et d’indiquer les modifications apportées. Les sources citées ci-dessus peuvent avoir leurs propres conditions de licence.