
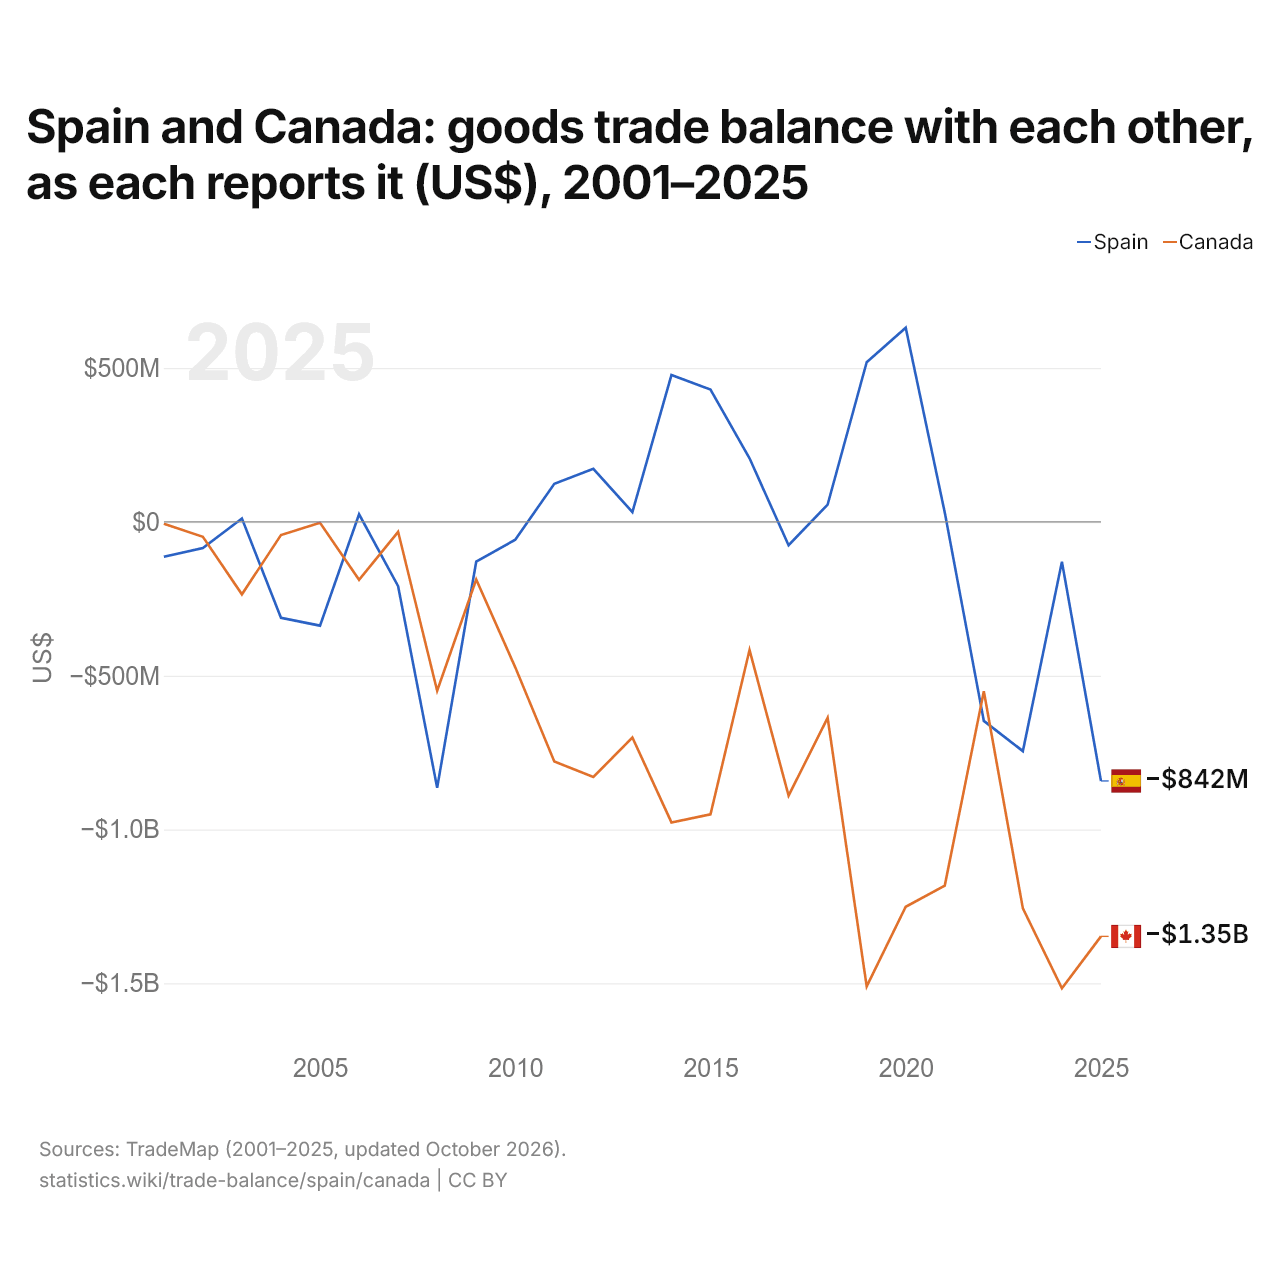
L'Espagne et le Canada : solde de leur commerce de biens bilatéral, selon chacun ($ US), 2001–2025
| Année | $ US | |
|---|---|---|
| Espagne | Canada | |
| 2025 | −842 323 000 $ US | −1 347 568 000 $ US |
| 2024 | −129 882 000 $ US | −1 516 302 000 $ US |
| 2023 | −745 233 000 $ US | −1 256 490 000 $ US |
| 2022 | −647 152 000 $ US | −551 017 000 $ US |
| 2021 | 29 960 000 $ US | −1 182 417 000 $ US |
| 2020 | 631 009 000 $ US | −1 251 077 000 $ US |
| 2019 | 518 687 000 $ US | −1 510 324 000 $ US |
| 2018 | 55 926 000 $ US | −637 145 000 $ US |
| 2017 | −76 269 000 $ US | −890 229 000 $ US |
| 2016 | 206 612 000 $ US | −416 731 000 $ US |
| 2015 | 430 179 000 $ US | −950 772 000 $ US |
| 2014 | 477 151 000 $ US | −977 186 000 $ US |
| 2013 | 31 579 000 $ US | −700 882 000 $ US |
| 2012 | 172 249 000 $ US | −829 692 000 $ US |
| 2011 | 123 734 000 $ US | −779 164 000 $ US |
| 2010 | −58 388 000 $ US | −472 988 000 $ US |
| 2009 | −129 574 000 $ US | −187 442 000 $ US |
| 2008 | −864 397 000 $ US | −549 335 000 $ US |
| 2007 | −209 291 000 $ US | −32 355 000 $ US |
| 2006 | 24 681 000 $ US | −188 645 000 $ US |
| 2005 | −337 380 000 $ US | −2 902 000 $ US |
| 2004 | −311 941 000 $ US | −43 017 000 $ US |
| 2003 | 10 795 000 $ US | −235 667 000 $ US |
| 2002 | −85 406 000 $ US | −48 817 000 $ US |
| 2001 | −113 440 000 $ US | −6 063 000 $ US |
En 2025, selon l'Espagne, son commerce de biens avec le Canada affichait un déficit de 842 millions de dollars ; selon le Canada, son commerce de biens avec l'Espagne affichait un déficit de 1,35 milliard de dollars. En 2001, les chiffres étaient un déficit de 113 millions de dollars pour l'Espagne et un déficit de 6,06 millions de dollars pour le Canada.
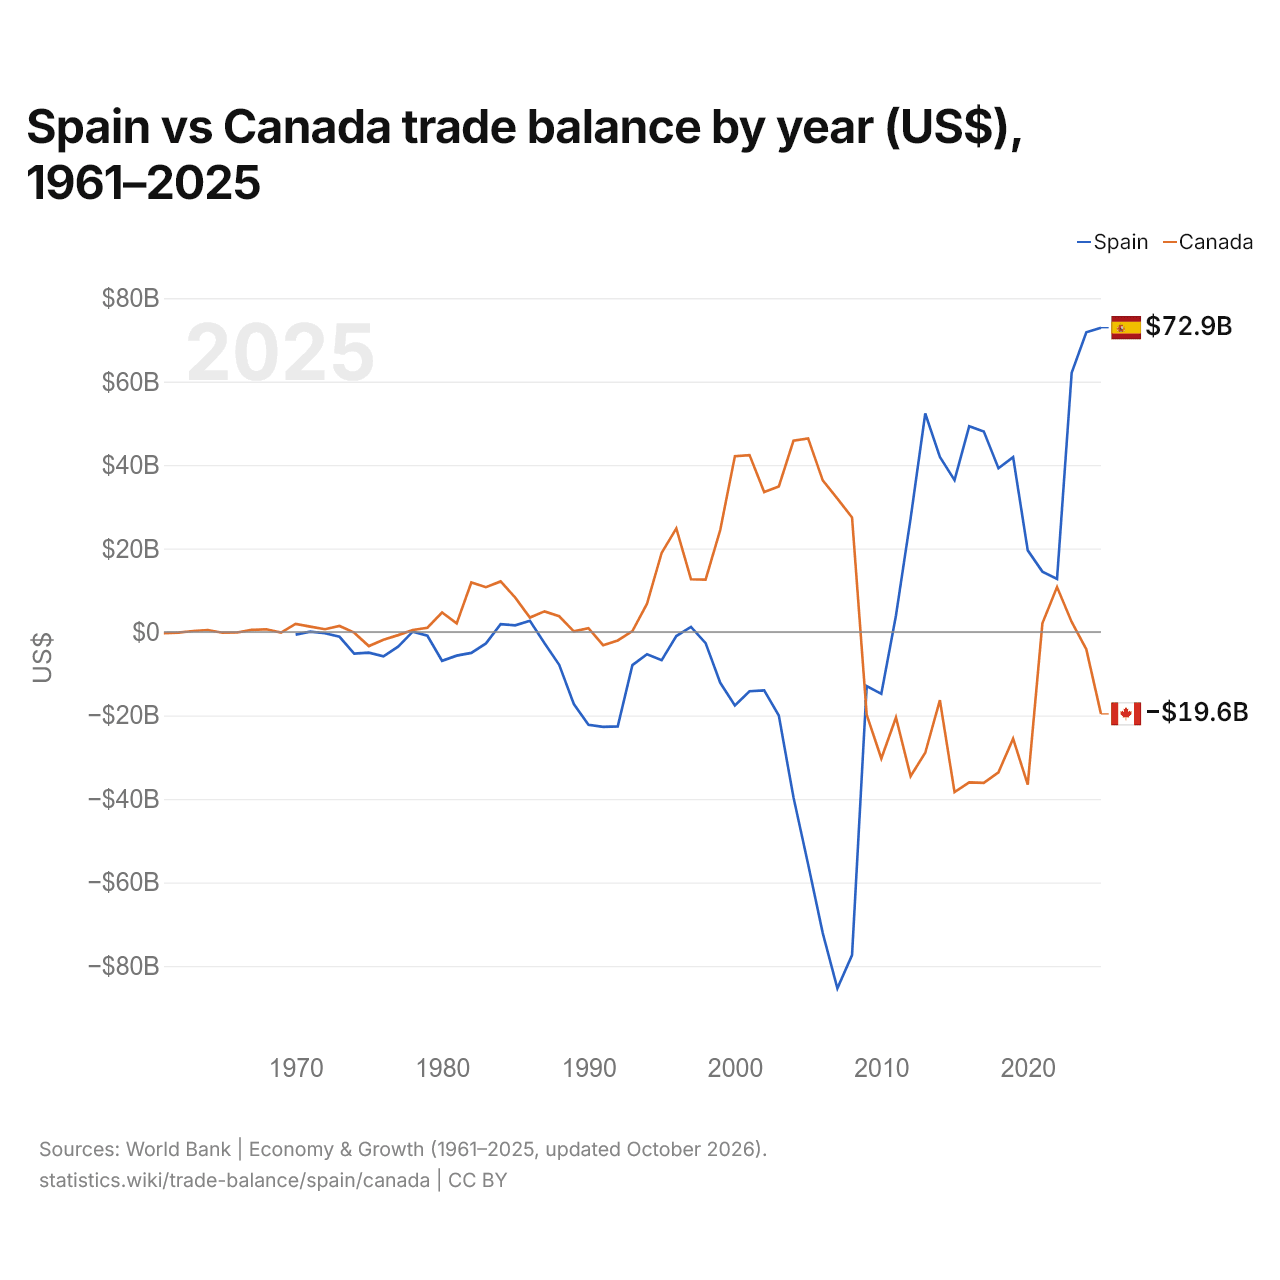
Espagne vs Canada : balance commerciale par année ($ US), 1961–2025
| Année | $ US | |
|---|---|---|
 Espagne |
 Canada |
|
| 2025 | 72 905 382 033 $ US | −19 620 119 427 $ US |
| 2024 | 71 813 779 341 $ US | −4 160 338 387 $ US |
| 2023 | 62 117 801 378 $ US | 2 389 050 564 $ US |
| 2022 | 12 715 562 305 $ US | 10 766 354 419 $ US |
| 2021 | 14 460 183 031 $ US | 2 089 519 311 $ US |
| 2020 | 19 552 112 993 $ US | −36 581 964 914 $ US |
| 2019 | 41 892 975 106 $ US | −25 564 644 017 $ US |
| 2018 | 39 230 127 861 $ US | −33 628 018 589 $ US |
| 2017 | 48 023 876 493 $ US | −36 155 870 206 $ US |
| 2016 | 49 290 395 615 $ US | −36 038 362 646 $ US |
| 2015 | 36 369 832 555 $ US | −38 367 633 198 $ US |
| 2014 | 41 951 397 767 $ US | −16 351 253 124 $ US |
| 2013 | 52 337 147 571 $ US | −28 939 829 822 $ US |
| 2012 | 27 224 671 957 $ US | −34 546 946 169 $ US |
| 2011 | 3 942 017 276 $ US | −20 478 981 976 $ US |
| 2010 | −14 818 860 900 $ US | −30 298 625 514 $ US |
| 2009 | −12 958 923 482 $ US | −19 832 035 692 $ US |
| 2008 | −77 429 392 408 $ US | 27 432 052 484 $ US |
| 2007 | −85 367 077 063 $ US | 31 956 987 245 $ US |
| 2006 | −72 139 174 807 $ US | 36 316 114 245 $ US |
| 2005 | −55 631 984 710 $ US | 46 388 017 825 $ US |
| 2004 | −39 615 800 979 $ US | 45 822 444 274 $ US |
| 2003 | −20 017 014 300 $ US | 34 853 329 527 $ US |
| 2002 | −13 991 654 416 $ US | 33 546 804 308 $ US |
| 2001 | −14 189 458 605 $ US | 42 385 717 975 $ US |
| 2000 | −17 606 826 022 $ US | 42 102 888 694 $ US |
| 1999 | −12 163 706 600 $ US | 24 472 639 160 $ US |
| 1998 | −2 663 993 763 $ US | 12 535 220 762 $ US |
| 1997 | 1 209 090 909 $ US | 12 636 862 632 $ US |
| 1996 | −973 335 085 $ US | 24 825 815 915 $ US |
| 1995 | −6 745 396 317 $ US | 18 993 004 955 $ US |
| 1994 | −5 306 615 327 $ US | 6 794 815 466 $ US |
| 1993 | −7 943 935 155 $ US | 199 209 364 $ US |
| 1992 | −22 619 393 792 $ US | −2 019 525 110 $ US |
| 1991 | −22 740 254 604 $ US | −3 165 750 196 $ US |
| 1990 | −22 235 288 932 $ US | 918 752 143 $ US |
| 1989 | −17 259 685 172 $ US | 147 804 054 $ US |
| 1988 | −7 858 501 643 $ US | 3 769 399 529 $ US |
| 1987 | −2 712 726 048 $ US | 4 939 668 175 $ US |
| 1986 | 2 681 646 667 $ US | 3 449 442 245 $ US |
| 1985 | 1 600 854 207 $ US | 8 246 063 713 $ US |
| 1984 | 1 872 076 175 $ US | 12 115 666 744 $ US |
| 1983 | −2 730 429 234 $ US | 10 738 396 624 $ US |
| 1982 | −5 009 245 797 $ US | 11 860 257 761 $ US |
| 1981 | −5 669 717 066 $ US | 2 048 544 499 $ US |
| 1980 | −6 898 052 913 $ US | 4 663 017 448 $ US |
| 1979 | −885 949 430 $ US | 1 021 854 192 $ US |
| 1978 | 78 546 007 $ US | 476 900 149 $ US |
| 1977 | −3 503 969 332 $ US | −752 233 192 $ US |
| 1976 | −5 842 516 787 $ US | −1 865 111 562 $ US |
| 1975 | −4 959 394 203 $ US | −3 376 917 027 $ US |
| 1974 | −5 167 078 166 $ US | −156 441 718 $ US |
| 1973 | −1 140 005 711 $ US | 1 435 856 414 $ US |
| 1972 | −288 646 130 $ US | 656 631 983 $ US |
| 1971 | 68 340 120 $ US | 1 299 267 182 $ US |
| 1970 | −634 228 667 $ US | 1 937 027 467 $ US |
| 1969 | - | −156 950 159 $ US |
| 1968 | - | 661 732 320 $ US |
| 1967 | - | 496 890 701 $ US |
| 1966 | - | −112 316 059 $ US |
| 1965 | - | −169 761 486 $ US |
| 1964 | - | 479 321 480 $ US |
| 1963 | - | 240 146 569 $ US |
| 1962 | - | −155 319 174 $ US |
| 1961 | - | −264 543 212 $ US |
En 2025, la balance commerciale de l'Espagne affichait un excédent de 72,9 milliards de dollars et celle du Canada un déficit de 19,6 milliards de dollars. En 1970, la balance commerciale de l'Espagne affichait un déficit de 634 millions de dollars et celle du Canada un excédent de 1,94 milliard de dollars.
De 1970 à 2025, la balance commerciale de l'Espagne a été excédentaire pendant 21 des 56 années, et celle du Canada pendant 36. Les balances commerciales de l'Espagne et du Canada ont été déficitaires en même temps pendant 8 de ces années, la dernière fois en 2010.
Espagne vs Canada : chiffres de la balance commerciale
|
Espagne
|
Canada
|
|
|---|---|---|
| Biens et services, $ US | +72,9 Md $US (2025) | −19,6 Md $US (2025) |
| % du PIB | +3,8 % (2025) | −0,8 % (2025) |
| Années d'excédent depuis 2000 | 15 sur 26 | 12 sur 26 |
| Solde des biens entre les deux, chiffres propres | −842 M $US (2025) | −1,35 Md $US (2025) |
| Premier excédent en biens avec | Portugal (+20,1 Md $US, 2025) | États-Unis (+145 Md $US, 2025) |
| Premier déficit en biens avec | Chine (−47,1 Md $US, 2025) | Chine (−40,4 Md $US, 2025) |
Comparer la balance commerciale de 2 pays au choix
Sources :
- Banque mondiale | Économie et croissance (1961–2025, mis à jour en octobre 2026)
- TradeMap (2001–2025, mis à jour en octobre 2026)
Creative Commons Attribution (CC BY) : vous pouvez copier, partager, adapter et réutiliser ce contenu, y compris à des fins commerciales, à condition de citer statistics.wiki et d’indiquer les modifications apportées. Les sources citées ci-dessus peuvent avoir leurs propres conditions de licence.