
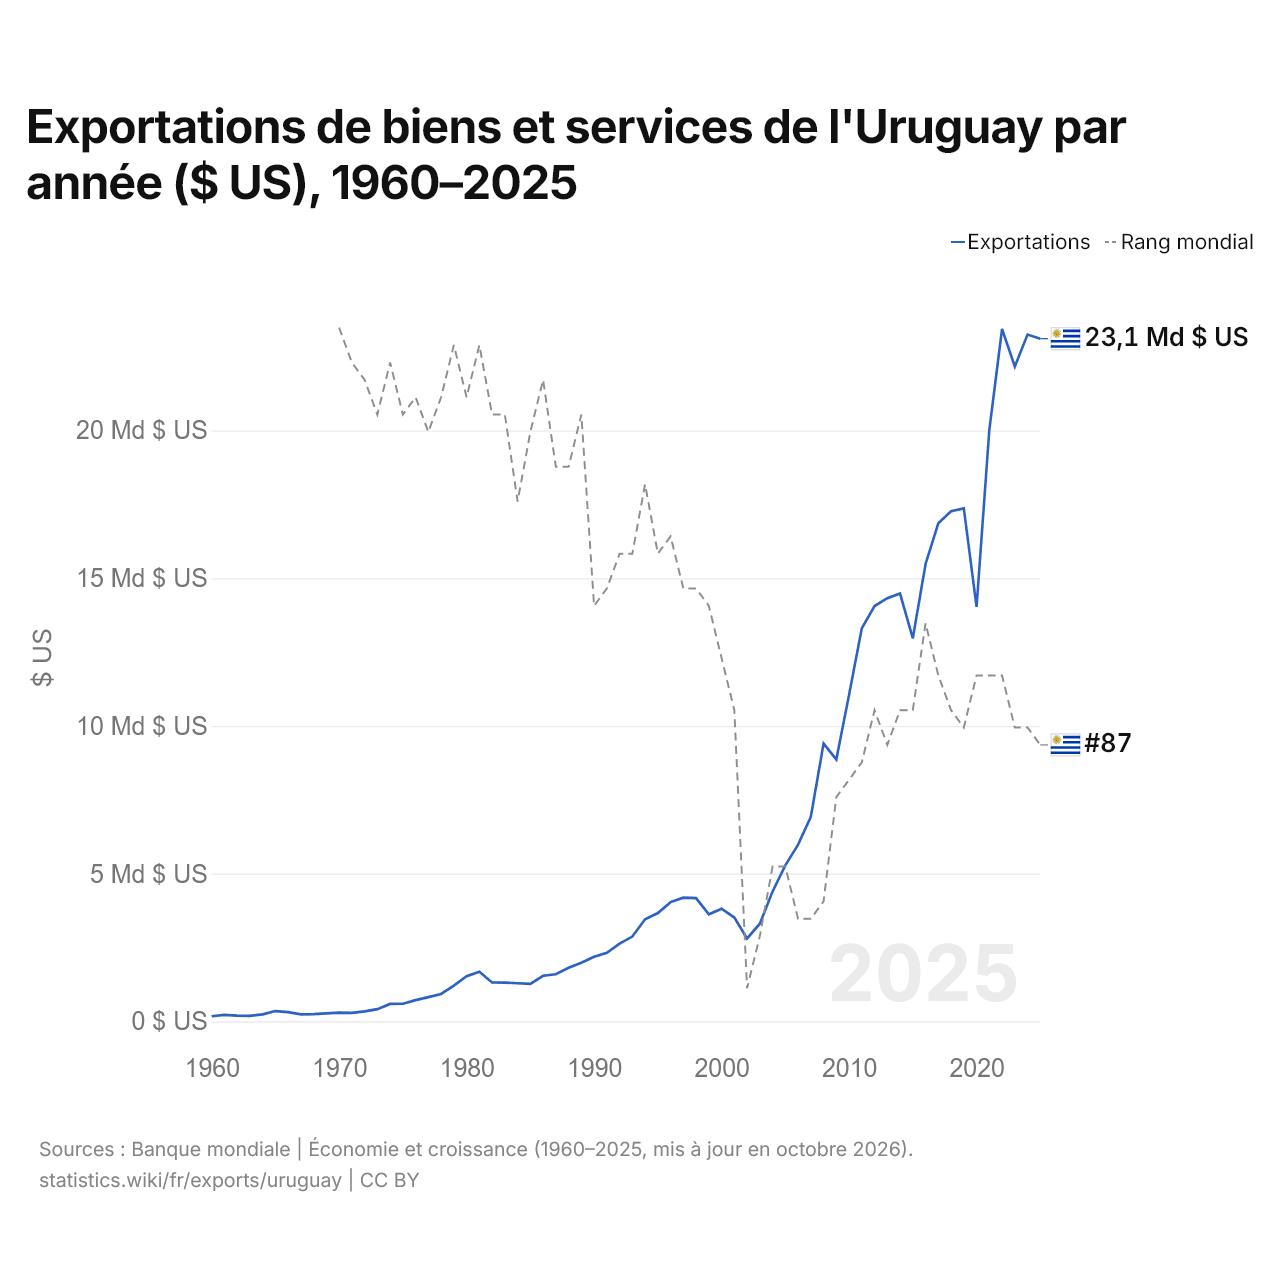
Exportations de biens et services de l'Uruguay par année ($ US), 1960–2025
| Année | $ US | Rang mondial |
|---|---|---|
| Exportations | Rang mondial | |
| 2025 | 23 104 847 903 $ US | #87 |
| 2024 | 23 243 778 154 $ US | #86 |
| 2023 | 22 163 590 552 $ US | #86 |
| 2022 | 23 432 009 306 $ US | #83 |
| 2021 | 20 010 242 322 $ US | #83 |
| 2020 | 14 026 258 642 $ US | #83 |
| 2019 | 17 363 375 088 $ US | #86 |
| 2018 | 17 265 078 783 $ US | #85 |
| 2017 | 16 856 823 032 $ US | #83 |
| 2016 | 15 480 542 128 $ US | #80 |
| 2015 | 12 965 298 329 $ US | #85 |
| 2014 | 14 477 839 205 $ US | #85 |
| 2013 | 14 324 258 530 $ US | #87 |
| 2012 | 14 056 802 469 $ US | #85 |
| 2011 | 13 301 545 753 $ US | #88 |
| 2010 | 11 050 981 364 $ US | #89 |
| 2009 | 8 863 697 957 $ US | #90 |
| 2008 | 9 399 061 015 $ US | #96 |
| 2007 | 6 922 888 127 $ US | #97 |
| 2006 | 5 981 157 818 $ US | #97 |
| 2005 | 5 279 006 692 $ US | #94 |
| 2004 | 4 394 994 712 $ US | #94 |
| 2003 | 3 304 410 121 $ US | #98 |
| 2002 | 2 805 891 109 $ US | #101 |
| 2001 | 3 511 965 703 $ US | #85 |
| 2000 | 3 811 052 356 $ US | #82 |
| 1999 | 3 621 012 840 $ US | #79 |
| 1998 | 4 168 339 942 $ US | #78 |
| 1997 | 4 184 600 575 $ US | #78 |
| 1996 | 4 035 386 466 $ US | #75 |
| 1995 | 3 665 940 936 $ US | #76 |
| 1994 | 3 454 168 853 $ US | #72 |
| 1993 | 2 869 311 094 $ US | #76 |
| 1992 | 2 633 269 109 $ US | #76 |
| 1991 | 2 318 969 025 $ US | #78 |
| 1990 | 2 188 206 936 $ US | #79 |
| 1989 | 1 982 636 217 $ US | #68 |
| 1988 | 1 811 733 104 $ US | #71 |
| 1987 | 1 594 966 345 $ US | #71 |
| 1986 | 1 541 476 815 $ US | #66 |
| 1985 | 1 266 123 611 $ US | #69 |
| 1984 | 1 289 223 521 $ US | #73 |
| 1983 | 1 310 717 316 $ US | #68 |
| 1982 | 1 314 939 846 $ US | #68 |
| 1981 | 1 679 796 170 $ US | #64 |
| 1980 | 1 527 803 803 $ US | #67 |
| 1979 | 1 208 815 650 $ US | #64 |
| 1978 | 925 434 422 $ US | #67 |
| 1977 | 818 672 884 $ US | #69 |
| 1976 | 717 274 792 $ US | #67 |
| 1975 | 593 738 353 $ US | #68 |
| 1974 | 588 256 717 $ US | #65 |
| 1973 | 412 996 157 $ US | #68 |
| 1972 | 337 963 959 $ US | #66 |
| 1971 | 288 709 677 $ US | #65 |
| 1970 | 296 774 194 $ US | #63 |
| 1969 | 268 548 387 $ US | - |
| 1968 | 241 962 440 $ US | - |
| 1967 | 233 416 696 $ US | - |
| 1966 | 309 880 934 $ US | - |
| 1965 | 347 846 052 $ US | - |
| 1964 | 235 904 695 $ US | - |
| 1963 | 185 026 102 $ US | - |
| 1962 | 193 918 026 $ US | - |
| 1961 | 219 799 543 $ US | - |
| 1960 | 171 350 240 $ US | - |
En 2025, les exportations de biens et services de l'Uruguay s'élevaient à 23,1 milliards de dollars, contre 171 millions de dollars en 1960. Le maximum a été de 23,4 milliards de dollars, en 2022. Elles se classaient au 87e rang mondial, en baisse par rapport au 86e rang en 2024. Leur meilleur rang a été le 63e, occupé pour la dernière fois en 1970.
En 2025, les exportations de biens et services de l'Uruguay étaient les 11es plus élevées de 27 pays situés en Amérique latine. Les importations de biens et services de l'Uruguay s'élevaient à 19,3 milliards de dollars en 2025, au 94e rang mondial. En 2025, les exportations de l'Uruguay dépassaient ses importations de 3,78 milliards de dollars, soit un excédent commercial.
Exportations de biens de l'Uruguay par catégorie, 2025
Exportations de biens, 2025: 11,3 Md $US
En 2025, la première catégorie des exportations de biens de l'Uruguay était « animaux, viande, poisson, produits laitiers, cuirs et peaux », avec 40,5 %, suivie de « cultures, plantes et fleurs (céréales, fruits, légumes, café, oléagineux) », avec 25,2 %.
Destinations des exportations de biens de l'Uruguay : les 10 premières, 2025
| Rang | Pays | Exportations de biens | Part | |
|---|---|---|---|---|
| 1 |
 Chine |
1,80 Md $US | 16 % | |
| 2 |
 Brésil |
1,65 Md $US | 14,6 % | |
| 3 |
 États-Unis |
1,26 Md $US | 11,1 % | |
| 4 |
 Argentine |
483 M $US | 4,28 % | vs Argentine |
| 5 |
 Pays-Bas |
365 M $US | 3,23 % | |
| 6 |
 Algérie |
345 M $US | 3,06 % | |
| 7 |
 Turquie |
344 M $US | 3,04 % | |
| 8 |
 Mexique |
271 M $US | 2,4 % | |
| 9 |
 Israël |
190 M $US | 1,68 % | |
| 10 |
 Italie |
166 M $US | 1,47 % | |
| Autres partenaires et non précisés | 4,42 Md $US | 39,2 % |
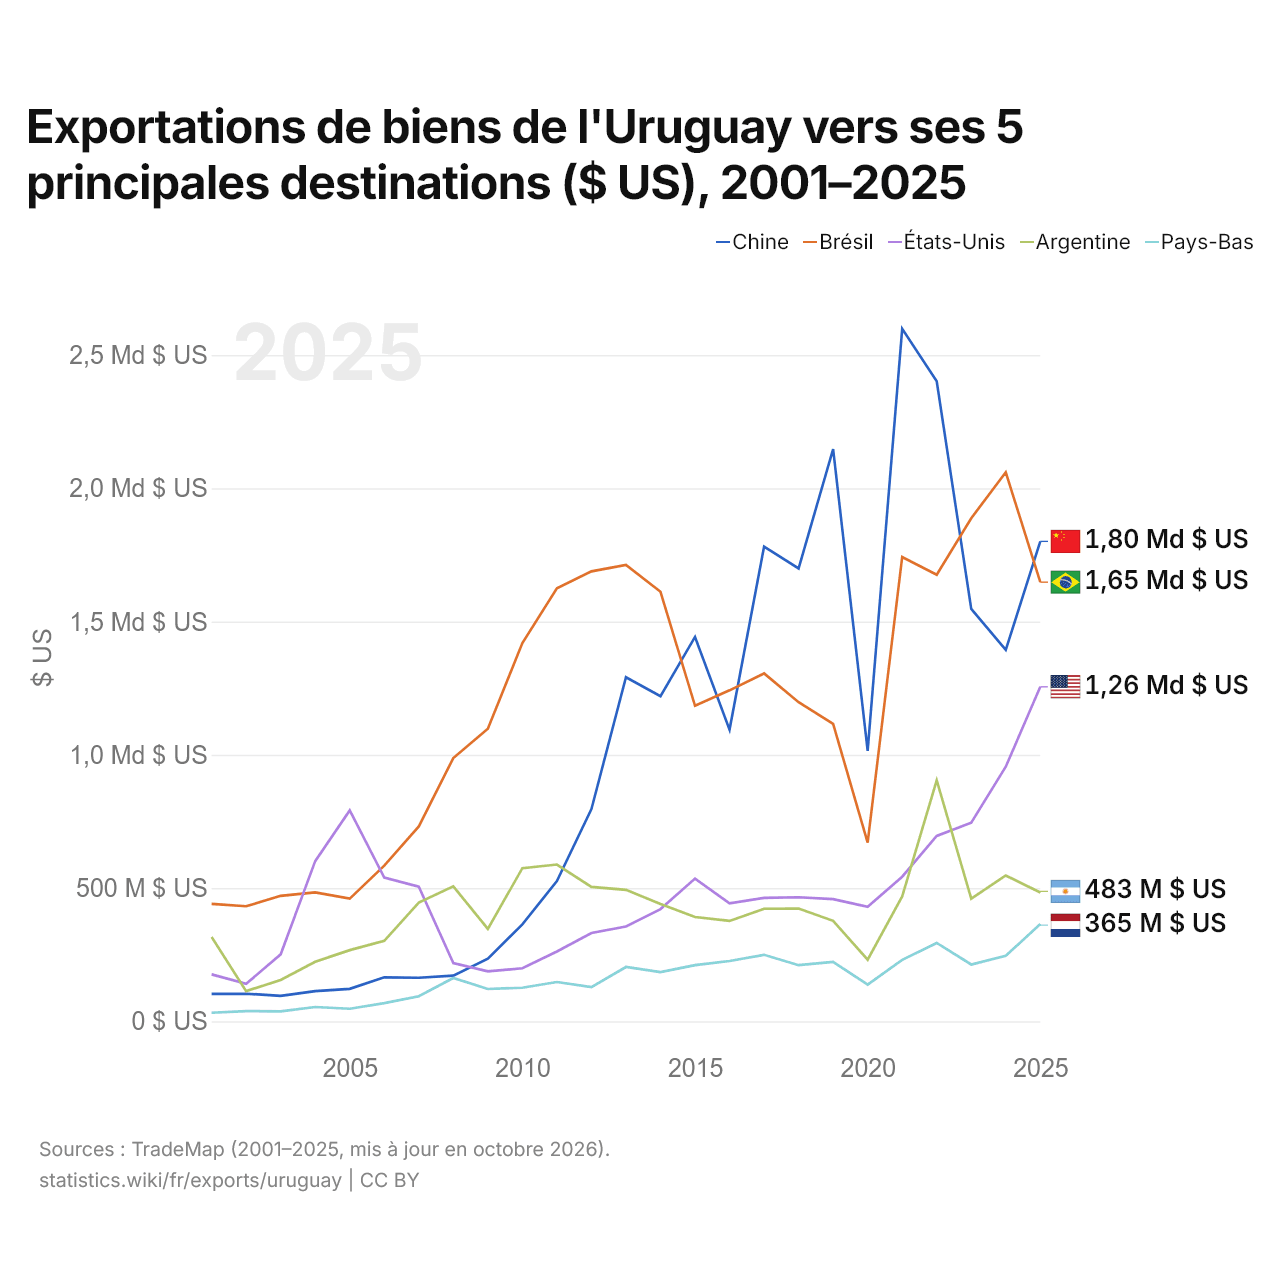
Exportations de biens de l'Uruguay vers ses 5 principales destinations ($ US), 2001–2025
| Année | $ US | ||||
|---|---|---|---|---|---|
| Chine | Brésil | États-Unis | Argentine | Pays-Bas | |
| 2025 | 1 800 873 000 $ US | 1 647 793 000 $ US | 1 255 139 000 $ US | 483 361 000 $ US | 364 849 000 $ US |
| 2024 | 1 393 789 000 $ US | 2 060 210 000 $ US | 955 489 000 $ US | 547 243 000 $ US | 245 890 000 $ US |
| 2023 | 1 547 593 000 $ US | 1 887 793 000 $ US | 745 166 000 $ US | 460 616 000 $ US | 213 342 000 $ US |
| 2022 | 2 401 884 000 $ US | 1 675 846 000 $ US | 695 677 000 $ US | 904 304 000 $ US | 294 012 000 $ US |
| 2021 | 2 598 261 000 $ US | 1 742 459 000 $ US | 542 587 000 $ US | 468 532 000 $ US | 230 440 000 $ US |
| 2020 | 1 014 640 000 $ US | 670 314 000 $ US | 429 451 000 $ US | 231 087 000 $ US | 137 728 000 $ US |
| 2019 | 2 147 303 000 $ US | 1 116 246 000 $ US | 458 631 000 $ US | 377 013 000 $ US | 223 081 000 $ US |
| 2018 | 1 699 517 000 $ US | 1 197 184 000 $ US | 465 642 000 $ US | 423 233 000 $ US | 210 696 000 $ US |
| 2017 | 1 780 992 000 $ US | 1 305 469 000 $ US | 463 197 000 $ US | 422 414 000 $ US | 249 707 000 $ US |
| 2016 | 1 094 593 000 $ US | 1 241 946 000 $ US | 442 803 000 $ US | 376 731 000 $ US | 226 279 000 $ US |
| 2015 | 1 442 428 000 $ US | 1 183 934 000 $ US | 535 623 000 $ US | 391 594 000 $ US | 210 685 000 $ US |
| 2014 | 1 219 765 000 $ US | 1 611 948 000 $ US | 421 161 000 $ US | 440 270 000 $ US | 184 555 000 $ US |
| 2013 | 1 291 008 000 $ US | 1 712 347 000 $ US | 355 587 000 $ US | 493 243 000 $ US | 203 987 000 $ US |
| 2012 | 796 244 000 $ US | 1 688 294 000 $ US | 331 427 000 $ US | 504 313 000 $ US | 128 423 000 $ US |
| 2011 | 526 146 000 $ US | 1 625 138 000 $ US | 262 049 000 $ US | 588 309 000 $ US | 147 669 000 $ US |
| 2010 | 363 841 000 $ US | 1 419 266 000 $ US | 199 115 000 $ US | 574 618 000 $ US | 126 031 000 $ US |
| 2009 | 235 080 000 $ US | 1 098 141 000 $ US | 187 517 000 $ US | 346 643 000 $ US | 121 209 000 $ US |
| 2008 | 171 532 000 $ US | 987 980 000 $ US | 218 870 000 $ US | 506 527 000 $ US | 162 420 000 $ US |
| 2007 | 163 430 000 $ US | 731 551 000 $ US | 505 232 000 $ US | 445 720 000 $ US | 94 130 000 $ US |
| 2006 | 165 170 000 $ US | 584 261 000 $ US | 539 433 000 $ US | 301 975 000 $ US | 68 106 000 $ US |
| 2005 | 121 800 000 $ US | 460 428 000 $ US | 791 571 000 $ US | 267 102 000 $ US | 47 255 000 $ US |
| 2004 | 113 132 000 $ US | 483 833 000 $ US | 601 188 000 $ US | 223 383 000 $ US | 53 712 000 $ US |
| 2003 | 95 696 000 $ US | 471 026 000 $ US | 251 314 000 $ US | 155 223 000 $ US | 37 295 000 $ US |
| 2002 | 103 620 000 $ US | 431 790 000 $ US | 140 846 000 $ US | 113 343 000 $ US | 38 606 000 $ US |
| 2001 | 102 856 000 $ US | 440 695 000 $ US | 176 315 000 $ US | 316 366 000 $ US | 32 215 000 $ US |
En 2025, les exportations de biens s'élevaient à 1,8 milliard de dollars vers la Chine, 1,65 milliard de dollars vers le Brésil, 1,26 milliard de dollars vers les États-Unis, 483 millions de dollars vers l'Argentine et 365 millions de dollars vers les Pays-Bas. Le changement le plus récent dans leur ordre remonte à 2025, quand les exportations de l'Uruguay vers la Chine ont dépassé celles vers le Brésil.
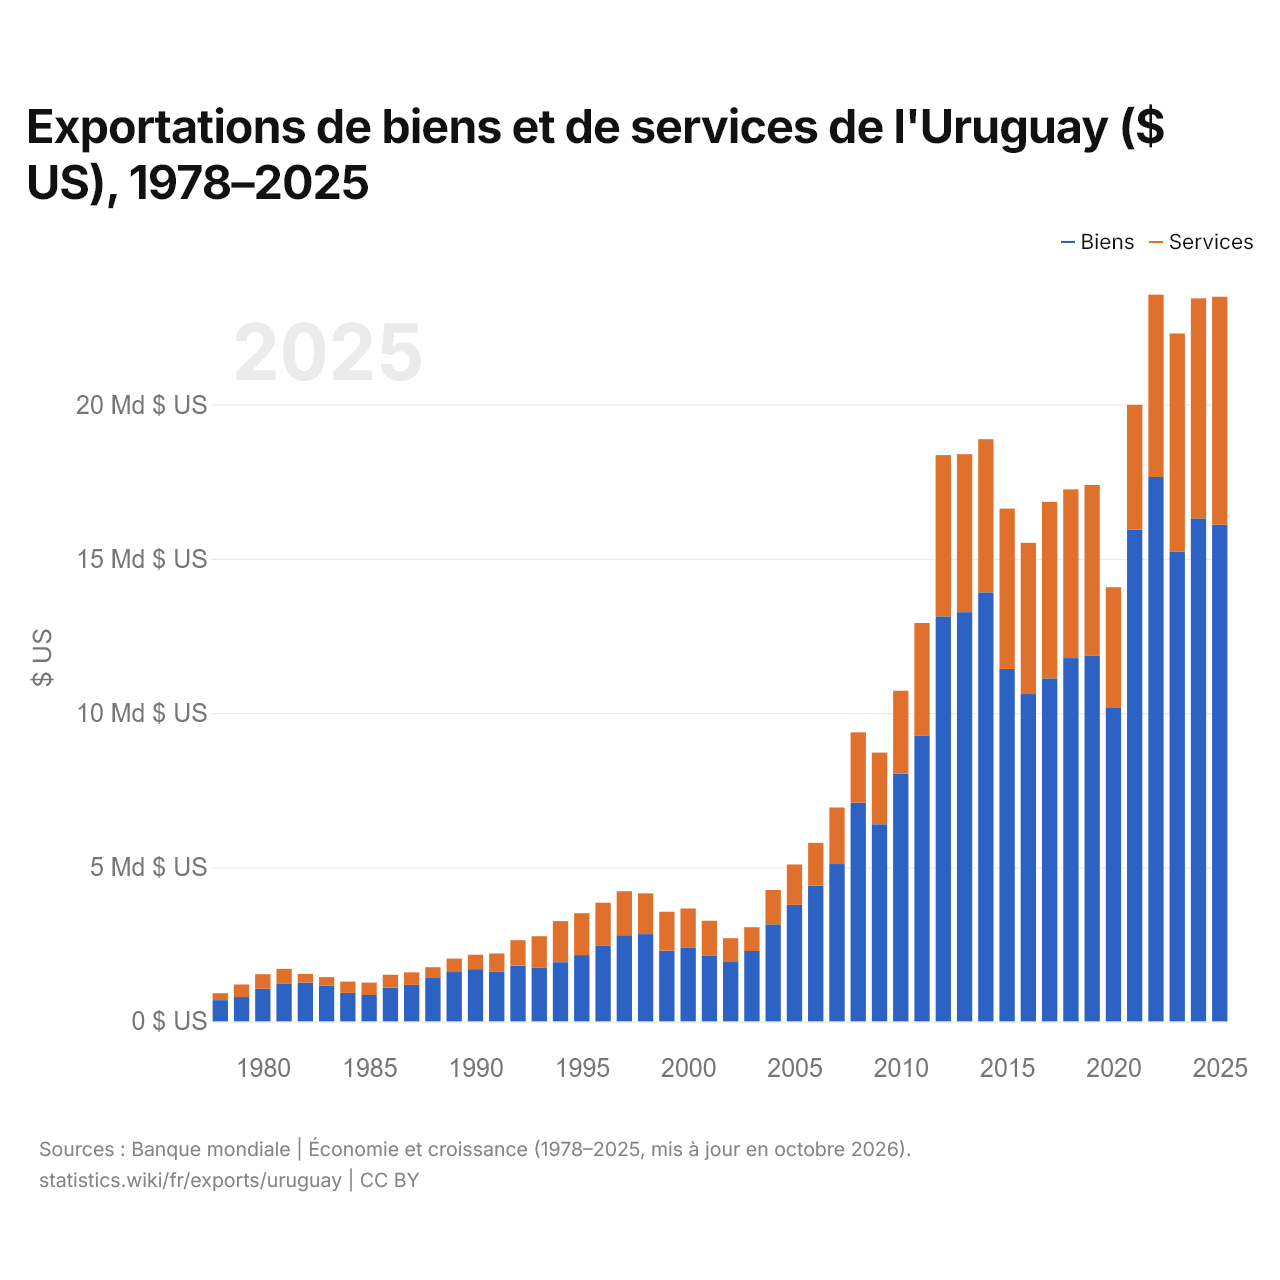
Exportations de biens et de services de l'Uruguay ($ US), 1978–2025
| Année | $ US | |
|---|---|---|
| Biens | Services | |
| 2025 | 16 108 481 632 $ US | 7 384 416 995 $ US |
| 2024 | 16 305 734 925 $ US | 7 137 609 169 $ US |
| 2023 | 15 221 687 501 $ US | 7 082 525 012 $ US |
| 2022 | 17 650 763 027 $ US | 5 910 878 433 $ US |
| 2021 | 15 940 943 473 $ US | 4 050 075 681 $ US |
| 2020 | 10 160 644 493 $ US | 3 914 922 956 $ US |
| 2019 | 11 865 420 833 $ US | 5 523 815 668 $ US |
| 2018 | 11 778 040 259 $ US | 5 472 633 574 $ US |
| 2017 | 11 121 674 852 $ US | 5 723 301 985 $ US |
| 2016 | 10 612 424 004 $ US | 4 900 841 399 $ US |
| 2015 | 11 430 419 594 $ US | 5 193 803 056 $ US |
| 2014 | 13 908 478 835 $ US | 4 965 054 569 $ US |
| 2013 | 13 267 740 901 $ US | 5 118 965 136 $ US |
| 2012 | 13 133 856 773 $ US | 5 224 123 239 $ US |
| 2011 | 9 273 742 321 $ US | 3 641 911 656 $ US |
| 2010 | 8 030 689 479 $ US | 2 688 158 503 $ US |
| 2009 | 6 391 830 118 $ US | 2 319 657 497 $ US |
| 2008 | 7 095 469 859 $ US | 2 276 742 232 $ US |
| 2007 | 5 099 904 953 $ US | 1 833 451 569 $ US |
| 2006 | 4 399 810 189 $ US | 1 387 427 516 $ US |
| 2005 | 3 774 078 194 $ US | 1 311 282 775 $ US |
| 2004 | 3 145 007 299 $ US | 1 111 557 762 $ US |
| 2003 | 2 281 191 268 $ US | 771 342 172 $ US |
| 2002 | 1 922 066 128 $ US | 771 329 924 $ US |
| 2001 | 2 139 495 150 $ US | 1 122 544 022 $ US |
| 2000 | 2 383 784 780 $ US | 1 275 823 031 $ US |
| 1999 | 2 290 600 000 $ US | 1 261 600 000 $ US |
| 1998 | 2 829 300 000 $ US | 1 319 100 000 $ US |
| 1997 | 2 793 100 000 $ US | 1 424 100 000 $ US |
| 1996 | 2 448 500 000 $ US | 1 398 700 000 $ US |
| 1995 | 2 147 600 000 $ US | 1 359 200 000 $ US |
| 1994 | 1 917 600 000 $ US | 1 330 700 000 $ US |
| 1993 | 1 731 600 000 $ US | 1 028 360 000 $ US |
| 1992 | 1 801 400 000 $ US | 830 340 000 $ US |
| 1991 | 1 604 700 000 $ US | 596 220 000 $ US |
| 1990 | 1 692 900 000 $ US | 465 590 000 $ US |
| 1989 | 1 599 000 000 $ US | 433 290 000 $ US |
| 1988 | 1 404 500 000 $ US | 348 270 000 $ US |
| 1987 | 1 182 300 000 $ US | 406 930 000 $ US |
| 1986 | 1 087 800 000 $ US | 422 100 000 $ US |
| 1985 | 853 600 000 $ US | 403 500 000 $ US |
| 1984 | 924 600 000 $ US | 364 800 000 $ US |
| 1983 | 1 156 400 000 $ US | 278 200 000 $ US |
| 1982 | 1 256 400 000 $ US | 280 900 000 $ US |
| 1981 | 1 229 700 000 $ US | 471 000 000 $ US |
| 1980 | 1 058 500 000 $ US | 467 500 000 $ US |
| 1979 | 788 100 000 $ US | 406 100 000 $ US |
| 1978 | 686 100 000 $ US | 226 800 000 $ US |
En 2025, les exportations de biens de l'Uruguay s'élevaient à 16,1 milliards de dollars et celles de services à 7,38 milliards de dollars ; les services représentaient 31,4 % du total, contre 24,8 % en 1978.
L'Uruguay dans le classement mondial des exportations, 2025







Exportations de biens et services de l'Uruguay, % du PIB, 1960–2025
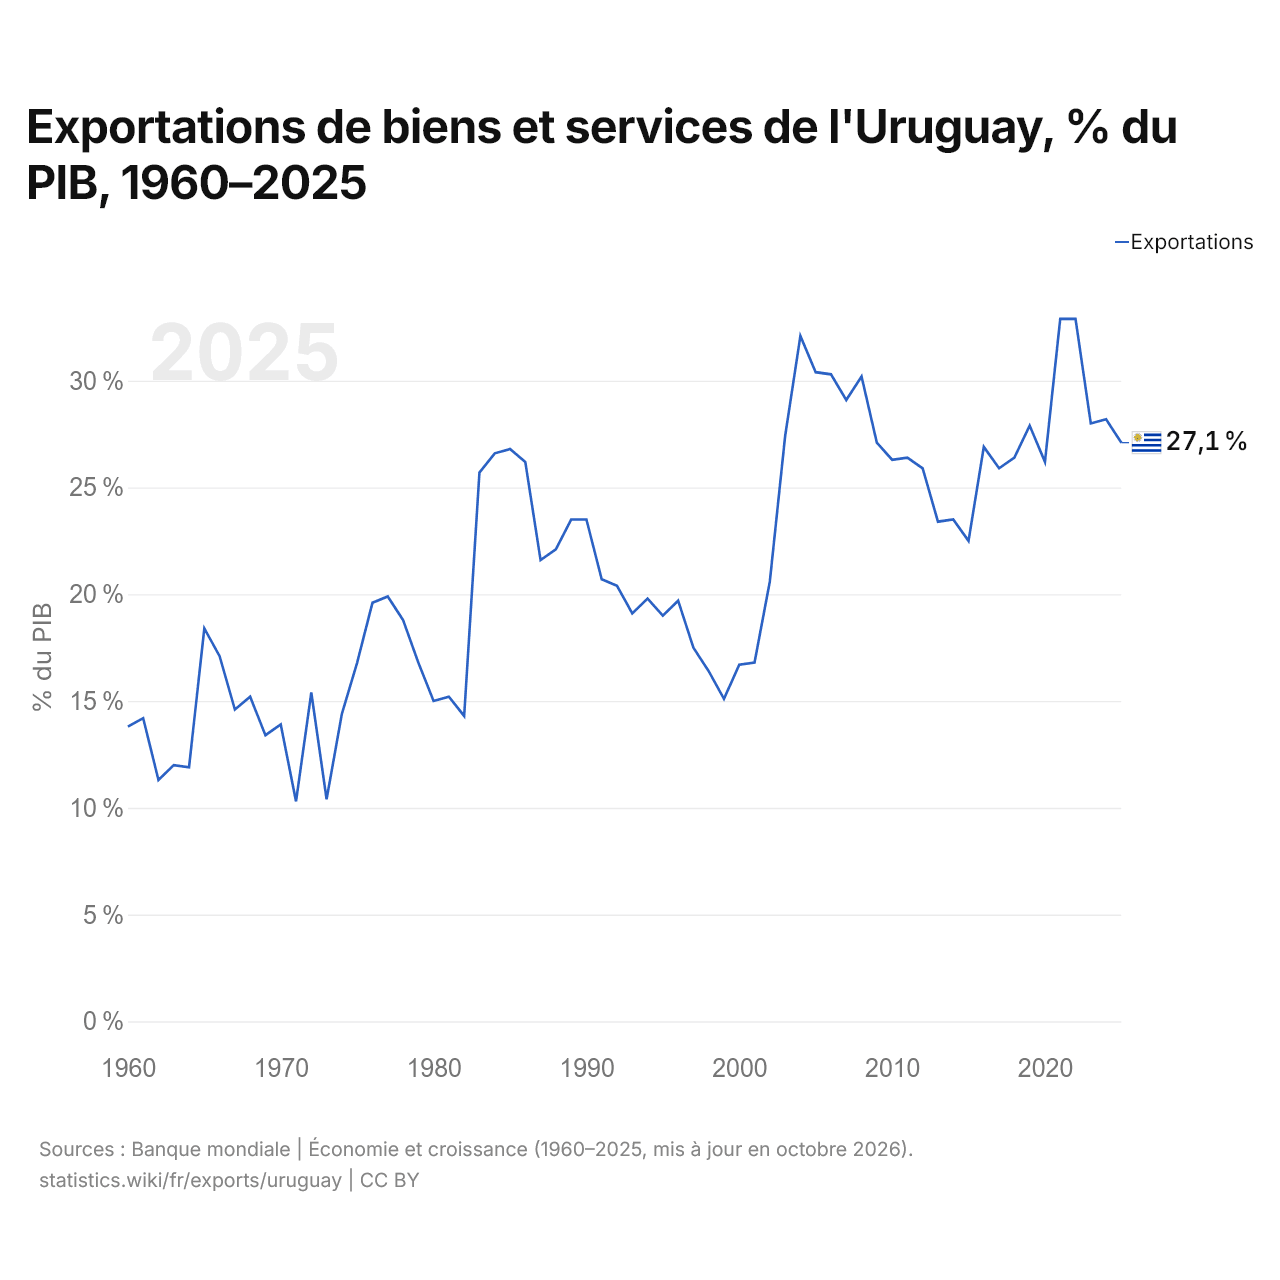
En 2025, les exportations de biens et services de l'Uruguay équivalaient à 27,1 % de son PIB, contre 13,8 % en 1960. La part la plus élevée a été de 32,9 %, en 2021.
Comparer les exportations de l'Uruguay avec celles d'autres pays
Sources :
- Banque mondiale | Économie et croissance (1960–2025, mis à jour en octobre 2026)
- TradeMap (2001–2025, mis à jour en octobre 2026)
Creative Commons Attribution (CC BY) : vous pouvez copier, partager, adapter et réutiliser ce contenu, y compris à des fins commerciales, à condition de citer statistics.wiki et d’indiquer les modifications apportées. Les sources citées ci-dessus peuvent avoir leurs propres conditions de licence.