
Importations de biens et services de l'Uruguay par année ($ US), 1960–2025
| Année | $ US | Rang mondial |
|---|---|---|
| Importations | Rang mondial | |
| 2025 | 19 327 594 037 $ US | #94 |
| 2024 | 19 118 102 906 $ US | #92 |
| 2023 | 19 284 205 661 $ US | #90 |
| 2022 | 19 456 784 754 $ US | #91 |
| 2021 | 15 409 774 978 $ US | #93 |
| 2020 | 11 538 603 069 $ US | #92 |
| 2019 | 13 589 037 133 $ US | #93 |
| 2018 | 13 963 973 875 $ US | #93 |
| 2017 | 13 291 654 462 $ US | #92 |
| 2016 | 12 380 703 255 $ US | #91 |
| 2015 | 13 180 179 646 $ US | #91 |
| 2014 | 15 709 177 870 $ US | #89 |
| 2013 | 16 171 486 174 $ US | #87 |
| 2012 | 15 804 109 317 $ US | #87 |
| 2011 | 13 504 292 327 $ US | #88 |
| 2010 | 10 636 951 485 $ US | #91 |
| 2009 | 8 600 719 067 $ US | #93 |
| 2008 | 10 893 438 975 $ US | #92 |
| 2007 | 7 167 879 856 $ US | #99 |
| 2006 | 6 252 911 447 $ US | #98 |
| 2005 | 4 943 843 929 $ US | #98 |
| 2004 | 4 018 907 625 $ US | #99 |
| 2003 | 2 930 315 875 $ US | #103 |
| 2002 | 2 640 670 228 $ US | #102 |
| 2001 | 4 076 272 834 $ US | #88 |
| 2000 | 4 568 223 557 $ US | #81 |
| 1999 | 4 386 374 776 $ US | #80 |
| 1998 | 4 879 194 086 $ US | #77 |
| 1997 | 4 853 524 480 $ US | #76 |
| 1996 | 4 074 053 358 $ US | #79 |
| 1995 | 3 686 020 003 $ US | #82 |
| 1994 | 3 561 674 786 $ US | #76 |
| 1993 | 2 934 260 606 $ US | #77 |
| 1992 | 2 527 397 075 $ US | #80 |
| 1991 | 2 001 561 708 $ US | #85 |
| 1990 | 1 682 744 698 $ US | #94 |
| 1989 | 1 493 668 481 $ US | #86 |
| 1988 | 1 456 747 009 $ US | #84 |
| 1987 | 1 414 997 206 $ US | #81 |
| 1986 | 1 191 819 539 $ US | #79 |
| 1985 | 998 457 828 $ US | #81 |
| 1984 | 1 036 760 496 $ US | #81 |
| 1983 | 1 204 334 440 $ US | #78 |
| 1982 | 1 587 083 734 $ US | #72 |
| 1981 | 2 102 640 519 $ US | #65 |
| 1980 | 2 096 775 971 $ US | #63 |
| 1979 | 1 520 042 526 $ US | #63 |
| 1978 | 1 038 743 774 $ US | #70 |
| 1977 | 932 324 247 $ US | #70 |
| 1976 | 736 320 969 $ US | #72 |
| 1975 | 717 495 341 $ US | #70 |
| 1974 | 690 867 044 $ US | #65 |
| 1973 | 376 829 827 $ US | #72 |
| 1972 | 326 095 659 $ US | #67 |
| 1971 | 320 967 742 $ US | #68 |
| 1970 | 325 000 000 $ US | #66 |
| 1969 | 243 145 161 $ US | - |
| 1968 | 194 518 825 $ US | - |
| 1967 | 210 551 387 $ US | - |
| 1966 | 207 824 339 $ US | - |
| 1965 | 216 973 280 $ US | - |
| 1964 | 224 109 460 $ US | - |
| 1963 | 185 026 102 $ US | - |
| 1962 | 246 804 760 $ US | - |
| 1961 | 228 591 525 $ US | - |
| 1960 | 231 322 824 $ US | - |
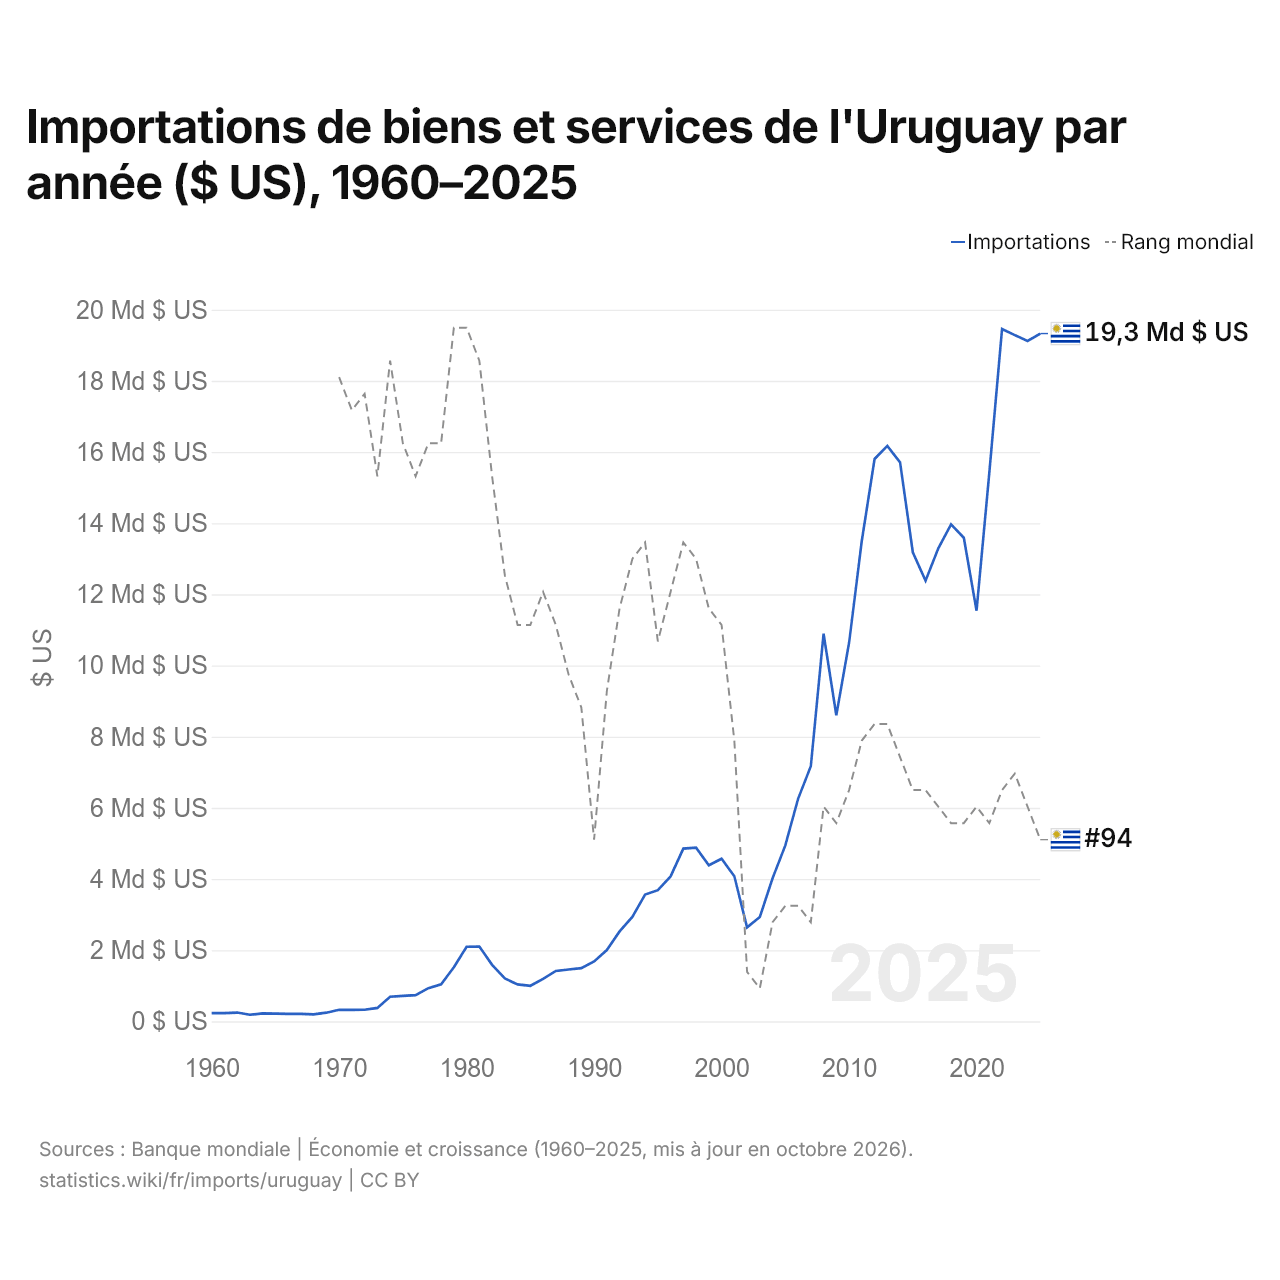
En 2025, les importations de biens et services de l'Uruguay s'élevaient à 19,3 milliards de dollars, contre 231 millions de dollars en 1960. Le maximum a été de 19,5 milliards de dollars, en 2022. Elles se classaient au 94e rang mondial, en baisse par rapport au 92e rang en 2024. Leur meilleur rang a été le 63e, occupé pour la dernière fois en 1980.
En 2025, les importations de biens et services de l'Uruguay étaient les 15es plus élevées de 26 pays situés en Amérique latine. En 2025, les exportations de l'Uruguay dépassaient ses importations de 3,78 milliards de dollars, soit un excédent commercial. Le commerce de l'Uruguay, exportations et importations réunies, équivalait à 49,7 % de son PIB en 2025, au 136e rang mondial.
Importations de biens de l'Uruguay par catégorie, 2025
Importations de biens, 2025: 12,9 Md $US
En 2025, la première catégorie des importations de biens de l'Uruguay était « machines, électronique et véhicules », avec 33,8 %, suivie de « pétrole, gaz, minerais et autres matières premières », avec 18,4 %.
Origines des importations de biens de l'Uruguay : les 10 premières, 2025
| Rang | Pays | Importations de biens | Part | |
|---|---|---|---|---|
| 1 |
 Chine |
2,99 Md $US | 23,1 % | |
| 2 |
 Brésil |
2,76 Md $US | 21,3 % | |
| 3 |
 Argentine |
1,65 Md $US | 12,7 % | vs Argentine |
| 4 |
 États-Unis |
1,14 Md $US | 8,81 % | |
| 5 |
 Nigeria |
401 M $US | 3,1 % | |
| 6 |
 Allemagne |
353 M $US | 2,73 % | |
| 7 |
 Italie |
264 M $US | 2,04 % | |
| 8 |
 Espagne |
248 M $US | 1,91 % | |
| 9 |
 Mexique |
207 M $US | 1,6 % | |
| 10 |
 France |
196 M $US | 1,51 % | vs France |
| Autres partenaires et non précisés | 2,74 Md $US | 21,2 % |
Importations de biens de l'Uruguay depuis ses 5 principales origines ($ US), 2001–2025
| Année | $ US | ||||
|---|---|---|---|---|---|
| Chine | Brésil | Argentine | États-Unis | Nigeria | |
| 2025 | 2 993 473 000 $ US | 2 758 836 000 $ US | 1 646 743 000 $ US | 1 141 103 000 $ US | 400 895 000 $ US |
| 2024 | 2 770 859 000 $ US | 2 657 068 000 $ US | 1 609 267 000 $ US | 806 797 000 $ US | 445 900 000 $ US |
| 2023 | 2 384 161 000 $ US | 2 730 922 000 $ US | 1 497 204 000 $ US | 1 102 486 000 $ US | 534 366 000 $ US |
| 2022 | 2 348 839 000 $ US | 2 582 285 000 $ US | 1 487 630 000 $ US | 2 049 942 000 $ US | 381 167 000 $ US |
| 2021 | 1 997 322 000 $ US | 2 059 988 000 $ US | 1 310 018 000 $ US | 929 694 000 $ US | 409 665 000 $ US |
| 2020 | 1 231 222 000 $ US | 1 566 471 000 $ US | 1 027 706 000 $ US | 969 216 000 $ US | 128 485 000 $ US |
| 2019 | 1 309 557 000 $ US | 1 651 560 000 $ US | 1 026 853 000 $ US | 877 557 000 $ US | 251 135 000 $ US |
| 2018 | 1 375 510 000 $ US | 1 653 993 000 $ US | 1 174 797 000 $ US | 804 087 000 $ US | 351 053 000 $ US |
| 2017 | 1 379 973 000 $ US | 1 649 164 000 $ US | 1 135 366 000 $ US | 951 327 000 $ US | 185 097 000 $ US |
| 2016 | 1 142 211 000 $ US | 1 470 610 000 $ US | 1 122 531 000 $ US | 629 176 000 $ US | 99 745 000 $ US |
| 2015 | 1 336 612 000 $ US | 1 696 996 000 $ US | 1 316 772 000 $ US | 795 866 000 $ US | 335 898 000 $ US |
| 2014 | 1 989 445 000 $ US | 1 833 471 000 $ US | 1 385 426 000 $ US | 1 011 168 000 $ US | 488 734 000 $ US |
| 2013 | 1 965 195 000 $ US | 1 835 654 000 $ US | 1 656 207 000 $ US | 1 012 355 000 $ US | 583 075 000 $ US |
| 2012 | 1 662 458 000 $ US | 2 096 832 000 $ US | 1 741 407 000 $ US | 1 046 785 000 $ US | 342 548 000 $ US |
| 2011 | 1 438 752 000 $ US | 2 082 400 000 $ US | 2 003 815 000 $ US | 1 108 867 000 $ US | 129 813 000 $ US |
| 2010 | 1 123 778 000 $ US | 1 578 114 000 $ US | 1 468 890 000 $ US | 863 116 000 $ US | 160 557 000 $ US |
| 2009 | 819 105 000 $ US | 1 459 760 000 $ US | 1 628 290 000 $ US | 568 303 000 $ US | 1 102 000 $ US |
| 2008 | 908 283 000 $ US | 1 617 998 000 $ US | 2 249 961 000 $ US | 539 613 000 $ US | 120 000 $ US |
| 2007 | 540 158 000 $ US | 1 314 537 000 $ US | 1 254 848 000 $ US | 415 861 000 $ US | - |
| 2006 | 350 875 000 $ US | 1 084 273 000 $ US | 1 103 330 000 $ US | 327 838 000 $ US | - |
| 2005 | 242 285 000 $ US | 824 684 000 $ US | 785 716 000 $ US | 260 847 000 $ US | 227 915 000 $ US |
| 2004 | 172 719 000 $ US | 676 525 000 $ US | 691 461 000 $ US | 223 902 000 $ US | 152 881 000 $ US |
| 2003 | 86 024 000 $ US | 459 767 000 $ US | 571 684 000 $ US | 167 490 000 $ US | 27 274 000 $ US |
| 2002 | 75 294 000 $ US | 389 602 000 $ US | 540 624 000 $ US | 165 243 000 $ US | 5 000 $ US |
| 2001 | 121 512 000 $ US | 625 884 000 $ US | 705 788 000 $ US | 273 540 000 $ US | 36 842 000 $ US |
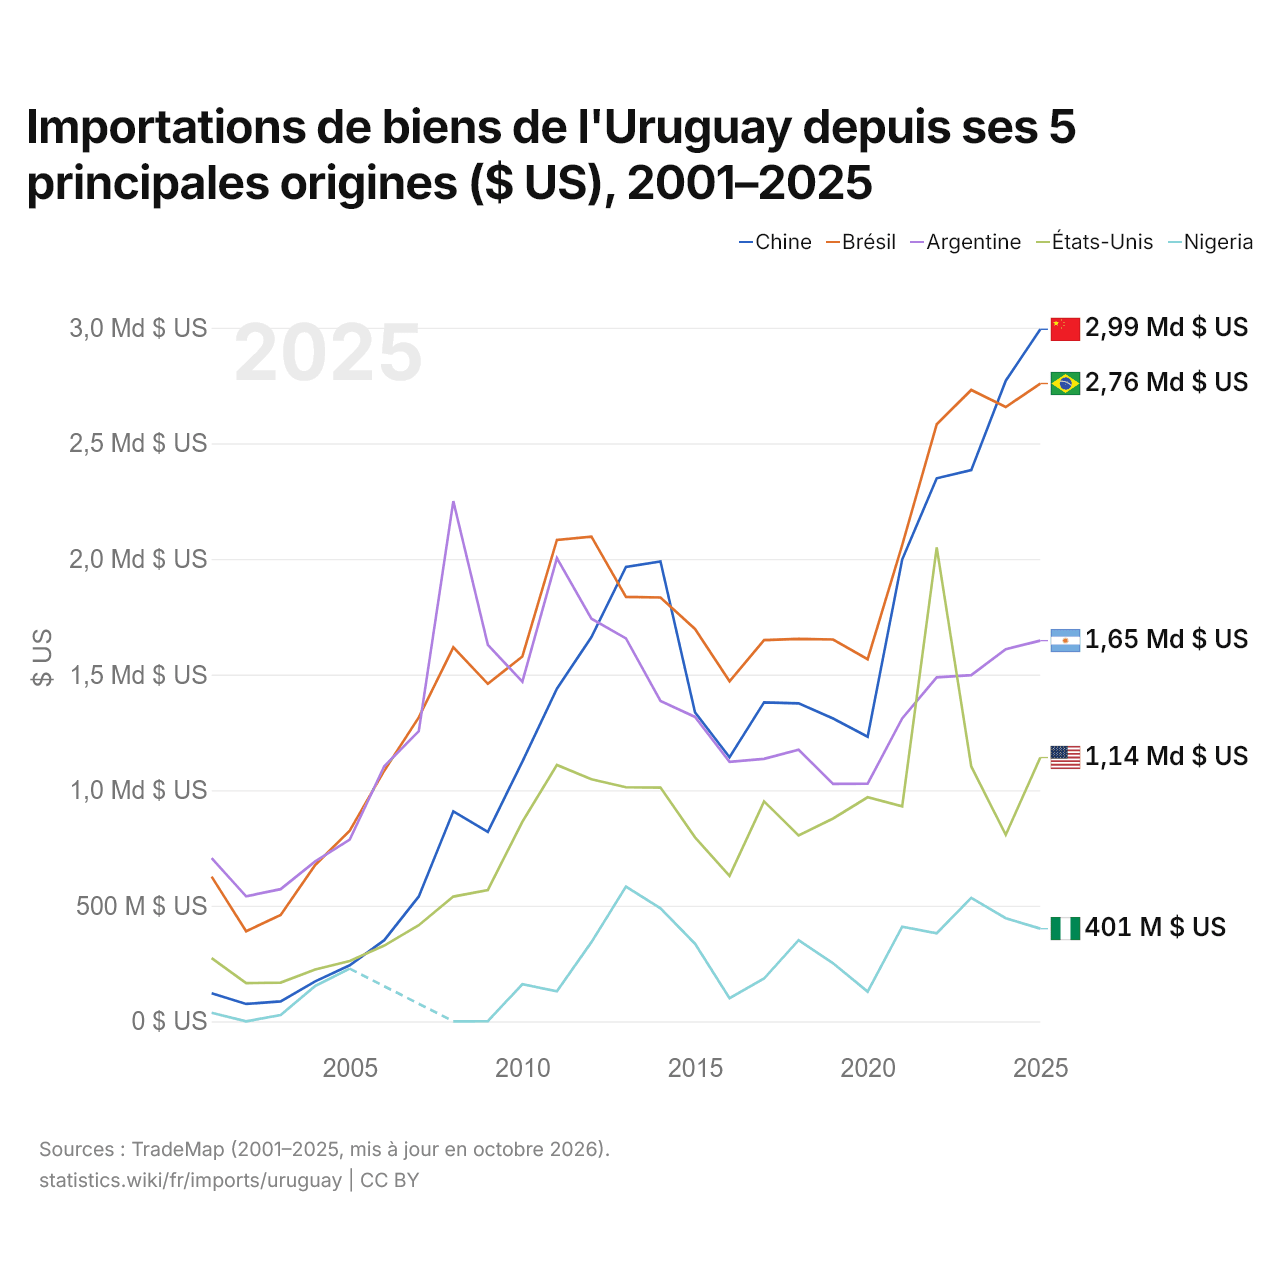
En 2025, les importations de biens s'élevaient à 2,99 milliards de dollars en provenance de la Chine, 2,76 milliards de dollars en provenance du Brésil, 1,65 milliard de dollars en provenance de l'Argentine, 1,14 milliard de dollars en provenance des États-Unis et 401 millions de dollars en provenance du Nigeria. Le premier rang des cinq fournisseurs de l'Uruguay est occupé par la Chine depuis 2024.
Importations de biens et de services de l'Uruguay ($ US), 1978–2025
| Année | $ US | |
|---|---|---|
| Biens | Services | |
| 2025 | 13 556 063 623 $ US | 5 951 425 305 $ US |
| 2024 | 13 009 768 149 $ US | 6 221 164 185 $ US |
| 2023 | 12 868 826 582 $ US | 6 581 503 899 $ US |
| 2022 | 13 414 366 679 $ US | 6 239 041 444 $ US |
| 2021 | 11 211 159 982 $ US | 4 236 568 910 $ US |
| 2020 | 7 903 627 989 $ US | 3 694 815 882 $ US |
| 2019 | 8 752 676 956 $ US | 4 857 564 188 $ US |
| 2018 | 9 393 513 320 $ US | 4 579 729 439 $ US |
| 2017 | 9 165 094 618 $ US | 4 201 937 599 $ US |
| 2016 | 8 562 427 320 $ US | 3 885 848 847 $ US |
| 2015 | 10 101 325 718 $ US | 4 290 046 380 $ US |
| 2014 | 12 039 964 962 $ US | 5 005 231 443 $ US |
| 2013 | 12 389 355 177 $ US | 4 993 845 067 $ US |
| 2012 | 12 785 975 588 $ US | 3 880 227 016 $ US |
| 2011 | 10 704 280 844 $ US | 2 050 253 449 $ US |
| 2010 | 8 557 692 819 $ US | 1 530 924 895 $ US |
| 2009 | 6 895 687 745 $ US | 1 294 881 720 $ US |
| 2008 | 8 809 677 483 $ US | 1 523 335 519 $ US |
| 2007 | 5 645 390 773 $ US | 1 130 009 286 $ US |
| 2006 | 4 898 461 245 $ US | 978 679 307 $ US |
| 2005 | 3 753 258 700 $ US | 939 478 289 $ US |
| 2004 | 2 992 224 251 $ US | 786 075 682 $ US |
| 2003 | 2 097 762 570 $ US | 636 296 775 $ US |
| 2002 | 1 873 809 469 $ US | 618 050 620 $ US |
| 2001 | 2 914 816 963 $ US | 806 707 499 $ US |
| 2000 | 3 311 107 520 $ US | 881 586 151 $ US |
| 1999 | 3 187 200 000 $ US | 802 300 000 $ US |
| 1998 | 3 601 400 000 $ US | 883 600 000 $ US |
| 1997 | 3 497 500 000 $ US | 888 600 000 $ US |
| 1996 | 3 135 400 000 $ US | 839 000 000 $ US |
| 1995 | 2 710 600 000 $ US | 857 700 000 $ US |
| 1994 | 2 623 600 000 $ US | 861 600 000 $ US |
| 1993 | 2 118 300 000 $ US | 746 450 000 $ US |
| 1992 | 1 923 200 000 $ US | 558 820 000 $ US |
| 1991 | 1 543 700 000 $ US | 422 490 000 $ US |
| 1990 | 1 266 900 000 $ US | 392 500 000 $ US |
| 1989 | 1 136 200 000 $ US | 421 720 000 $ US |
| 1988 | 1 112 200 000 $ US | 315 430 000 $ US |
| 1987 | 1 079 900 000 $ US | 356 260 000 $ US |
| 1986 | 814 500 000 $ US | 387 140 000 $ US |
| 1985 | 675 400 000 $ US | 339 600 000 $ US |
| 1984 | 732 200 000 $ US | 334 700 000 $ US |
| 1983 | 739 700 000 $ US | 472 500 000 $ US |
| 1982 | 1 038 400 000 $ US | 547 100 000 $ US |
| 1981 | 1 592 100 000 $ US | 505 900 000 $ US |
| 1980 | 1 668 200 000 $ US | 475 500 000 $ US |
| 1979 | 1 166 200 000 $ US | 337 300 000 $ US |
| 1978 | 709 800 000 $ US | 260 400 000 $ US |
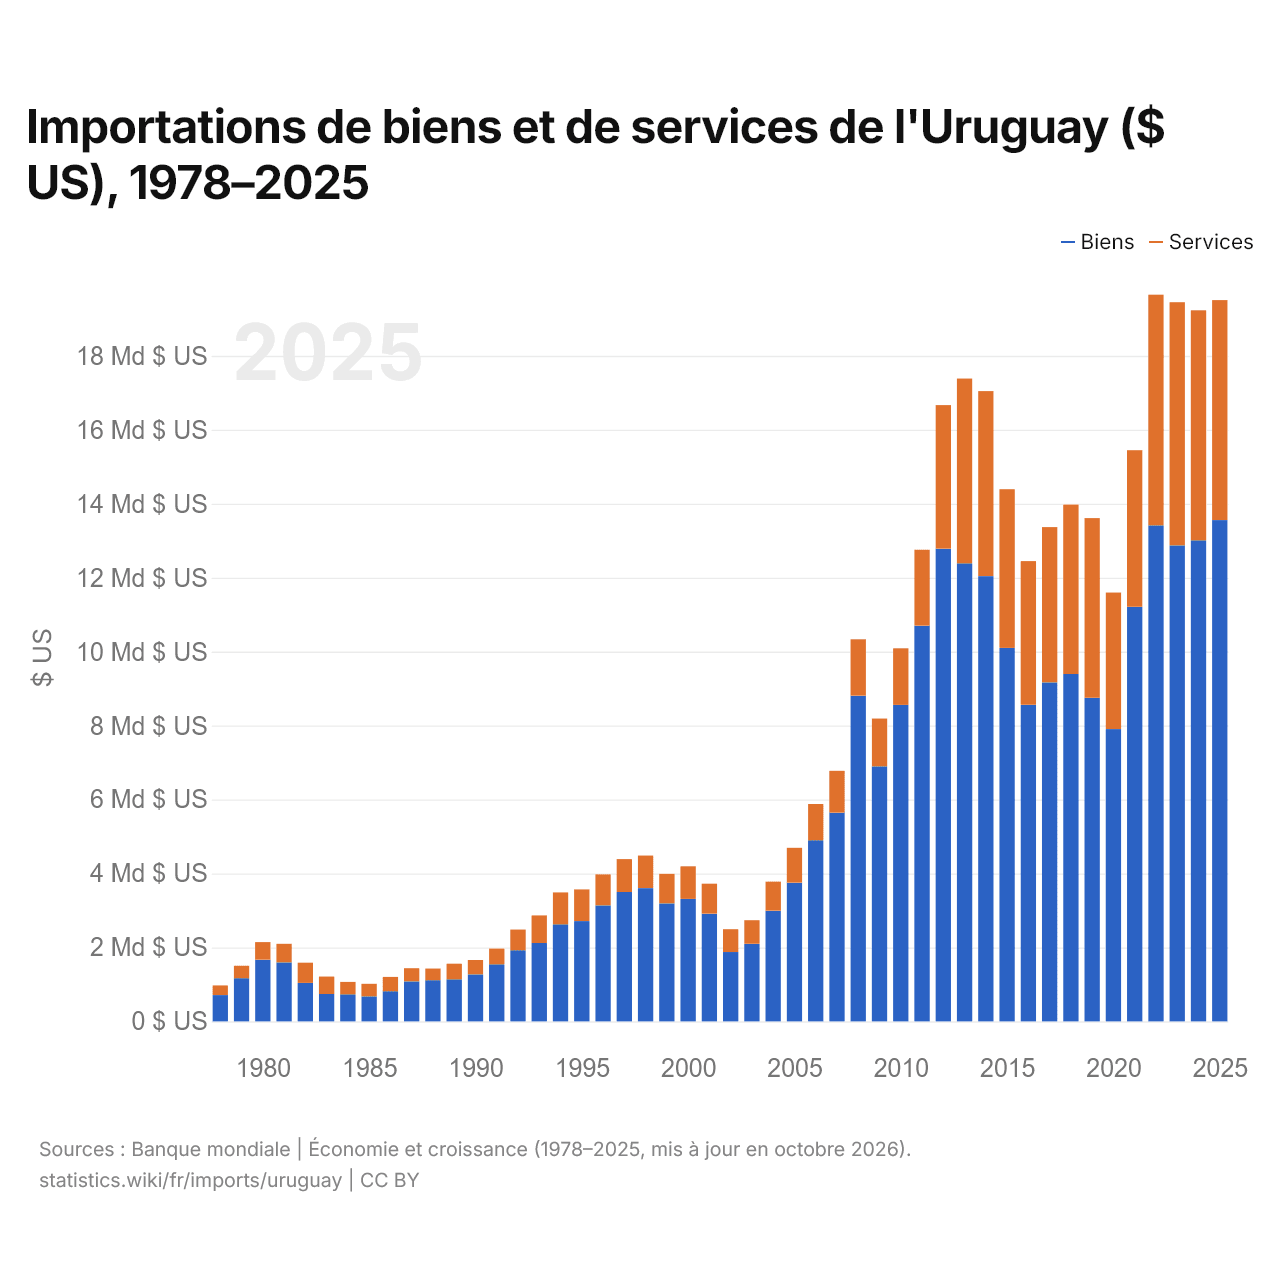
En 2025, les importations de biens de l'Uruguay s'élevaient à 13,6 milliards de dollars et celles de services à 5,95 milliards de dollars ; les services représentaient 30,5 % du total, contre 26,8 % en 1978.
L'Uruguay dans le classement mondial des importations, 2025







Importations de biens et services de l'Uruguay, % du PIB, 1960–2025
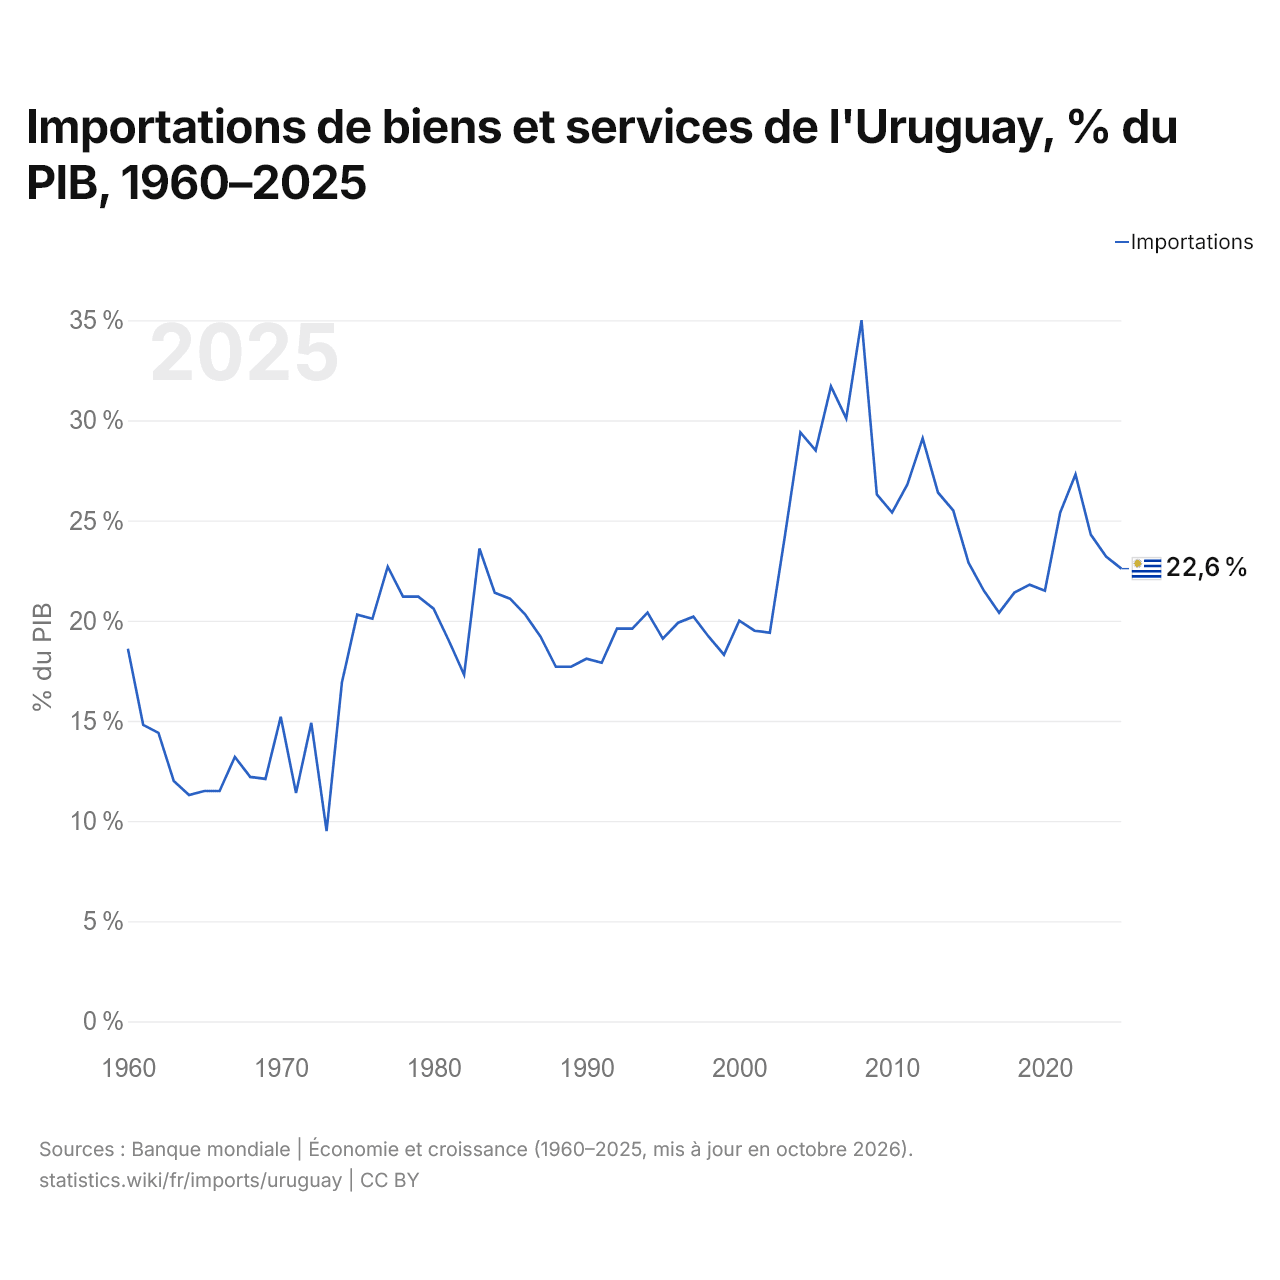
En 2025, les importations de biens et services de l'Uruguay équivalaient à 22,6 % de son PIB, contre 18,6 % en 1960. La part la plus élevée a été de 35,0 %, en 2008.
Comparer les importations de l'Uruguay avec celles d'autres pays
Sources :
- Banque mondiale | Économie et croissance (1960–2025, mis à jour en octobre 2026)
- TradeMap (2001–2025, mis à jour en octobre 2026)
Creative Commons Attribution (CC BY) : vous pouvez copier, partager, adapter et réutiliser ce contenu, y compris à des fins commerciales, à condition de citer statistics.wiki et d’indiquer les modifications apportées. Les sources citées ci-dessus peuvent avoir leurs propres conditions de licence.