
Importations de biens et services du Paraguay par année ($ US), 1962–2025
| Année | $ US | Rang mondial |
|---|---|---|
| Importations | Rang mondial | |
| 2025 | 19 366 371 817 $ US | #93 |
| 2024 | 17 618 547 633 $ US | #96 |
| 2023 | 17 394 262 697 $ US | #94 |
| 2022 | 16 516 240 118 $ US | #96 |
| 2021 | 13 685 252 890 $ US | #95 |
| 2020 | 10 448 804 214 $ US | #96 |
| 2019 | 13 325 018 619 $ US | #94 |
| 2018 | 14 165 793 924 $ US | #92 |
| 2017 | 12 834 286 732 $ US | #94 |
| 2016 | 11 049 252 332 $ US | #96 |
| 2015 | 11 652 991 233 $ US | #96 |
| 2014 | 13 574 782 459 $ US | #96 |
| 2013 | 13 343 028 125 $ US | #95 |
| 2012 | 12 233 898 499 $ US | #96 |
| 2011 | 12 912 863 193 $ US | #89 |
| 2010 | 10 663 826 786 $ US | #90 |
| 2009 | 7 320 133 400 $ US | #98 |
| 2008 | 9 437 298 164 $ US | #97 |
| 2007 | 6 361 555 843 $ US | #102 |
| 2006 | 5 162 332 824 $ US | #100 |
| 2005 | 4 018 871 465 $ US | #103 |
| 2004 | 3 312 407 417 $ US | #106 |
| 2003 | 2 613 734 808 $ US | #108 |
| 2002 | 2 300 391 879 $ US | #106 |
| 2001 | 2 715 523 960 $ US | #99 |
| 2000 | 3 127 286 332 $ US | #94 |
| 1999 | 3 071 972 020 $ US | #94 |
| 1998 | 4 349 322 683 $ US | #82 |
| 1997 | 4 729 946 872 $ US | #77 |
| 1996 | 4 923 048 705 $ US | #72 |
| 1995 | 5 100 987 429 $ US | #70 |
| 1994 | 4 900 392 491 $ US | #66 |
| 1993 | 3 891 800 193 $ US | #72 |
| 1992 | 2 838 888 199 $ US | #77 |
| 1991 | 2 674 820 829 $ US | #76 |
| 1990 | 2 271 653 935 $ US | #81 |
| 1989 | 1 478 470 884 $ US | #87 |
| 1988 | 1 561 507 834 $ US | #80 |
| 1987 | 1 433 992 382 $ US | #80 |
| 1986 | 1 223 304 161 $ US | #78 |
| 1985 | 890 425 802 $ US | #83 |
| 1984 | 1 024 424 371 $ US | #82 |
| 1983 | 901 287 917 $ US | #84 |
| 1982 | 1 070 794 118 $ US | #82 |
| 1981 | 1 011 111 111 $ US | #84 |
| 1980 | 891 841 270 $ US | #86 |
| 1979 | 736 523 810 $ US | #80 |
| 1978 | 566 103 175 $ US | #80 |
| 1977 | 469 507 937 $ US | #83 |
| 1976 | 306 468 254 $ US | #86 |
| 1975 | 269 849 206 $ US | #86 |
| 1974 | 228 810 749 $ US | #82 |
| 1973 | 142 063 492 $ US | #86 |
| 1972 | 106 428 571 $ US | #87 |
| 1971 | 105 952 381 $ US | #82 |
| 1970 | 95 857 143 $ US | #83 |
| 1969 | 101 253 968 $ US | - |
| 1968 | 86 817 460 $ US | - |
| 1967 | 76 992 063 $ US | - |
| 1966 | 75 206 349 $ US | - |
| 1965 | 69 873 016 $ US | - |
| 1964 | 58 539 683 $ US | - |
| 1963 | 49 809 524 $ US | - |
| 1962 | 52 936 508 $ US | - |
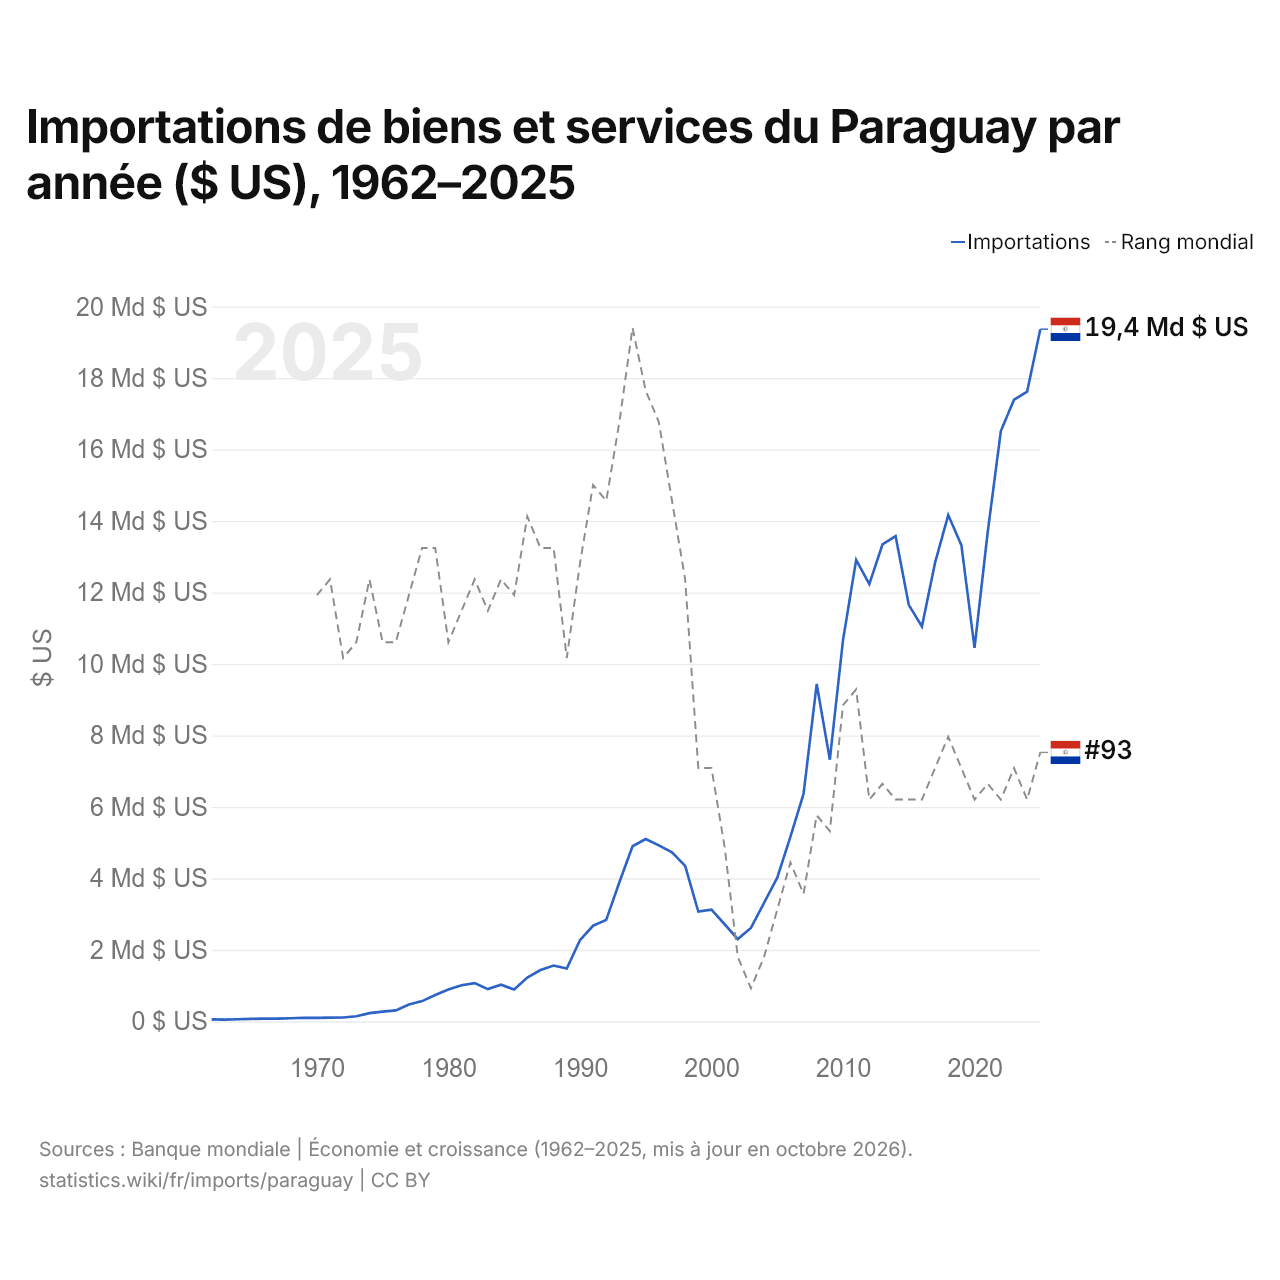
En 2025, les importations de biens et services du Paraguay s'élevaient à 19,4 milliards de dollars, contre 52,9 millions de dollars en 1962. Le minimum a été de 49,8 millions de dollars, en 1963. Elles se classaient au 93e rang mondial, en hausse par rapport au 96e rang en 2024. Leur meilleur rang a été le 66e, occupé pour la dernière fois en 1994.
En 2025, les importations de biens et services du Paraguay étaient les 14es plus élevées de 26 pays situés en Amérique latine. En 2025, les importations du Paraguay dépassaient ses exportations de 1,05 milliard de dollars, soit un déficit commercial. Le commerce du Paraguay, exportations et importations réunies, équivalait à 76,5 % de son PIB en 2025, au 97e rang mondial.
Importations de biens du Paraguay par catégorie, 2025
Importations de biens, 2025: 19,1 Md $US
En 2025, la première catégorie des importations de biens du Paraguay était « machines, électronique et véhicules », avec 42,9 %, suivie de « pétrole, gaz, minerais et autres matières premières », avec 17,6 %.
Origines des importations de biens du Paraguay : les 10 premières, 2025
| Rang | Pays | Importations de biens | Part | |
|---|---|---|---|---|
| 1 |
 Brésil |
4,39 Md $US | 22,9 % | |
| 2 |
 Chine |
3,81 Md $US | 19,9 % | |
| 3 |
 Argentine |
3,01 Md $US | 15,7 % | |
| 4 |
 États-Unis |
2,40 Md $US | 12,6 % | |
| 5 |
 Chili |
549 M $US | 2,87 % | |
| 6 |
 Uruguay |
535 M $US | 2,8 % | vs Uruguay |
| 7 |
 Allemagne |
417 M $US | 2,18 % | vs Allemagne |
| 8 |
 Singapour |
321 M $US | 1,68 % | |
| 9 |
 EAU |
305 M $US | 1,6 % | |
| 10 |
 Inde |
247 M $US | 1,29 % | |
| Autres partenaires et non précisés | 3,14 Md $US | 16,4 % |
Importations de biens du Paraguay depuis ses 5 principales origines ($ US), 2001–2025
| Année | $ US | ||||
|---|---|---|---|---|---|
| Brésil | Chine | Argentine | États-Unis | Chili | |
| 2025 | 4 389 891 000 $ US | 3 813 702 000 $ US | 3 007 943 000 $ US | 2 404 348 000 $ US | 548 747 000 $ US |
| 2024 | 4 092 673 000 $ US | 3 179 698 000 $ US | 3 237 345 000 $ US | 2 261 850 000 $ US | 508 021 000 $ US |
| 2023 | 3 957 459 000 $ US | 2 428 692 000 $ US | 2 863 367 000 $ US | 2 888 965 000 $ US | 413 317 000 $ US |
| 2022 | 3 678 379 000 $ US | 4 691 863 000 $ US | 1 326 036 000 $ US | 1 471 769 000 $ US | 127 073 000 $ US |
| 2021 | 3 314 878 000 $ US | 2 308 364 000 $ US | 2 518 949 000 $ US | 1 968 581 000 $ US | 355 659 000 $ US |
| 2020 | 2 453 481 000 $ US | 1 679 987 000 $ US | 1 841 906 000 $ US | 1 577 227 000 $ US | 342 429 000 $ US |
| 2019 | 2 673 723 000 $ US | 2 011 923 000 $ US | 2 304 197 000 $ US | 2 438 768 000 $ US | 427 649 000 $ US |
| 2018 | 3 112 290 000 $ US | 2 149 495 000 $ US | 2 659 020 000 $ US | 1 885 531 000 $ US | 503 681 000 $ US |
| 2017 | 2 774 353 000 $ US | 2 075 776 000 $ US | 2 170 173 000 $ US | 1 900 620 000 $ US | 495 197 000 $ US |
| 2016 | 2 423 179 000 $ US | 1 461 886 000 $ US | 1 855 927 000 $ US | 1 430 130 000 $ US | 367 700 000 $ US |
| 2015 | 2 625 470 000 $ US | 1 700 809 000 $ US | 2 085 810 000 $ US | 1 154 709 000 $ US | 395 368 000 $ US |
| 2014 | 3 277 235 000 $ US | 3 078 316 000 $ US | 1 259 410 000 $ US | 1 156 885 000 $ US | 157 303 000 $ US |
| 2013 | 3 075 322 000 $ US | 3 434 089 000 $ US | 1 330 928 000 $ US | 945 484 000 $ US | 148 607 000 $ US |
| 2012 | 2 672 356 000 $ US | 3 183 813 000 $ US | 1 369 939 000 $ US | 1 054 597 000 $ US | 148 352 000 $ US |
| 2011 | 3 045 292 000 $ US | 3 662 437 000 $ US | 1 377 057 000 $ US | 737 495 000 $ US | 153 160 000 $ US |
| 2010 | 2 416 871 000 $ US | 3 433 298 000 $ US | 1 196 678 000 $ US | 518 899 000 $ US | 123 262 000 $ US |
| 2009 | 1 611 803 000 $ US | 2 053 486 000 $ US | 855 190 000 $ US | 341 331 000 $ US | 100 156 000 $ US |
| 2008 | 2 426 740 000 $ US | 2 473 801 000 $ US | 1 056 185 000 $ US | 432 439 000 $ US | 105 713 000 $ US |
| 2007 | 1 707 556 000 $ US | 1 625 293 000 $ US | 757 267 000 $ US | 301 276 000 $ US | 75 258 000 $ US |
| 2006 | 1 029 218 000 $ US | 1 269 909 000 $ US | 737 190 000 $ US | 332 065 000 $ US | 61 554 000 $ US |
| 2005 | 894 715 000 $ US | 642 110 000 $ US | 656 911 000 $ US | 182 187 000 $ US | 41 535 000 $ US |
| 2004 | 847 859 000 $ US | 419 940 000 $ US | 653 718 000 $ US | 98 705 000 $ US | 31 876 000 $ US |
| 2003 | 655 762 000 $ US | 266 814 000 $ US | 436 555 000 $ US | 64 074 000 $ US | 21 972 000 $ US |
| 2002 | 512 993 000 $ US | 211 440 000 $ US | 341 845 000 $ US | 83 556 000 $ US | 21 283 000 $ US |
| 2001 | 605 533 000 $ US | 253 286 000 $ US | 523 103 000 $ US | 128 809 000 $ US | 46 515 000 $ US |
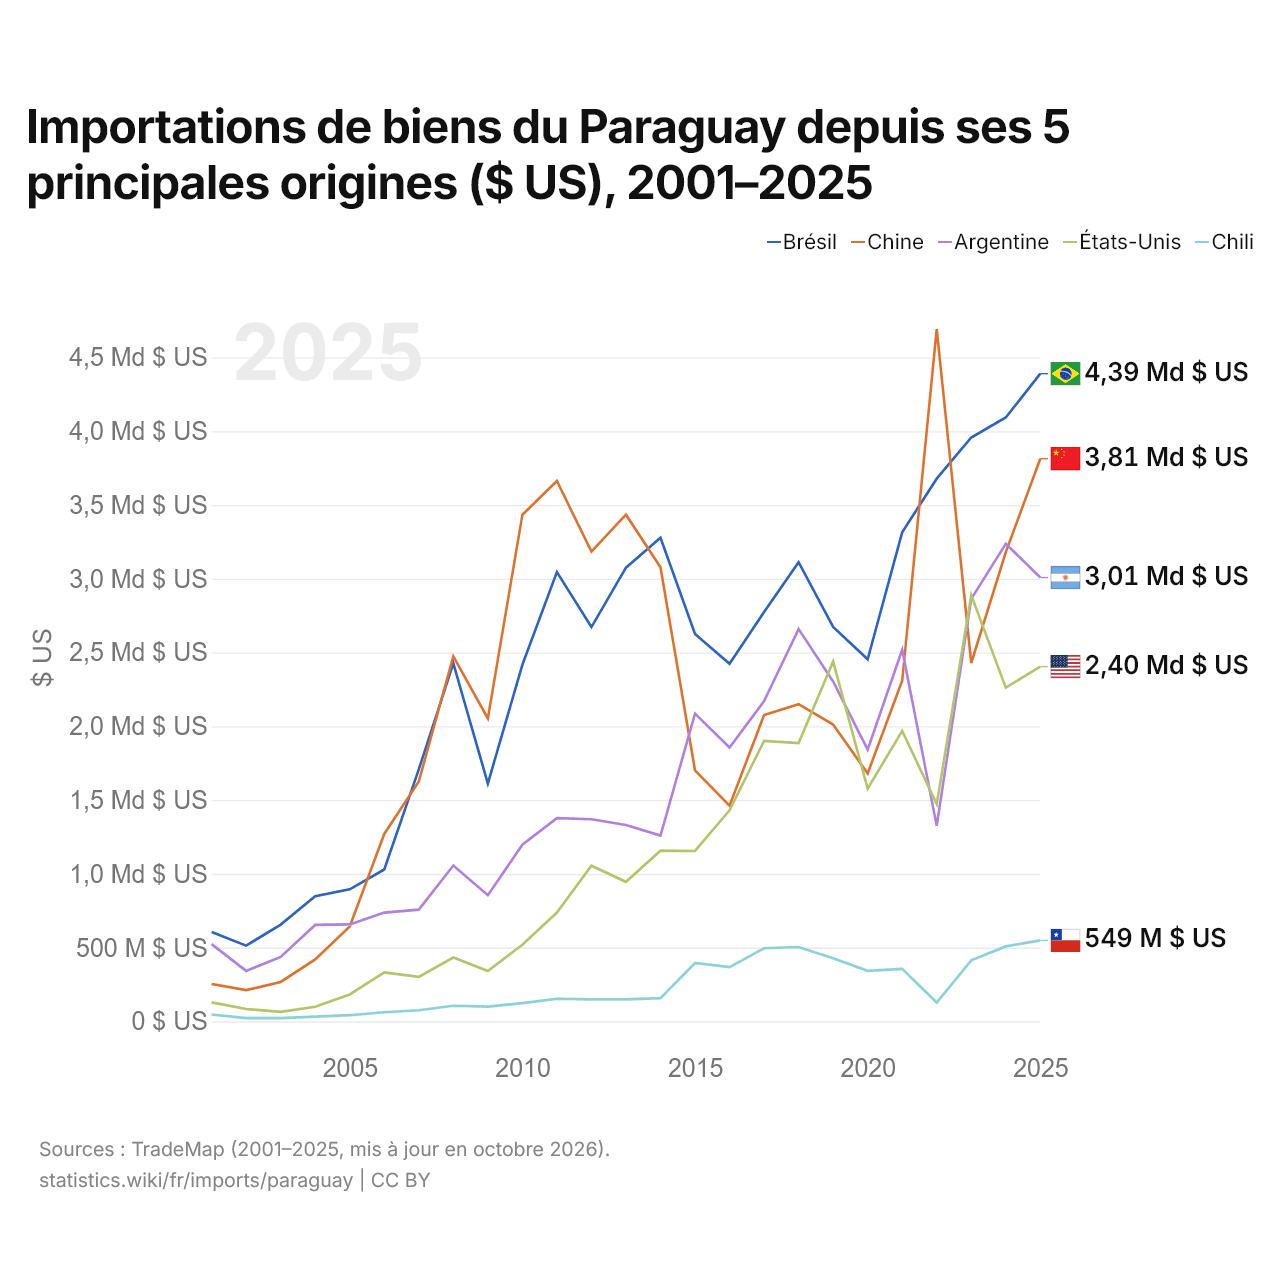
En 2025, les importations de biens s'élevaient à 4,39 milliards de dollars en provenance du Brésil, 3,81 milliards de dollars en provenance de la Chine, 3,01 milliards de dollars en provenance de l'Argentine, 2,4 milliards de dollars en provenance des États-Unis et 549 millions de dollars en provenance du Chili. Le premier rang des cinq fournisseurs du Paraguay est occupé par le Brésil depuis 2023. Le changement le plus récent dans leur ordre remonte à 2025, quand les importations du Paraguay en provenance de la Chine ont dépassé celles en provenance de l'Argentine.
Importations de biens et de services du Paraguay ($ US), 1975–2025
| Année | $ US | |
|---|---|---|
| Biens | Services | |
| 2025 | 17 491 188 481 $ US | 2 746 179 967 $ US |
| 2024 | 15 835 333 922 $ US | 2 541 572 752 $ US |
| 2023 | 15 342 421 172 $ US | 2 505 099 203 $ US |
| 2022 | 14 664 917 226 $ US | 2 423 200 960 $ US |
| 2021 | 12 567 315 359 $ US | 1 735 544 575 $ US |
| 2020 | 9 719 933 490 $ US | 1 252 470 314 $ US |
| 2019 | 11 905 999 899 $ US | 2 041 271 714 $ US |
| 2018 | 12 605 140 660 $ US | 2 032 649 996 $ US |
| 2017 | 11 296 188 596 $ US | 1 893 550 952 $ US |
| 2016 | 9 624 382 258 $ US | 1 673 754 189 $ US |
| 2015 | 10 164 494 164 $ US | 1 677 493 351 $ US |
| 2014 | 11 946 114 678 $ US | 1 654 767 582 $ US |
| 2013 | 11 860 834 552 $ US | 1 535 424 642 $ US |
| 2012 | 11 014 060 723 $ US | 1 343 250 946 $ US |
| 2011 | 11 722 741 996 $ US | 1 283 422 936 $ US |
| 2010 | 9 582 870 162 $ US | 1 123 880 455 $ US |
| 2009 | 6 625 109 251 $ US | 732 839 866 $ US |
| 2008 | 8 675 278 035 $ US | 791 001 079 $ US |
| 2007 | 5 937 460 000 $ US | 464 022 322 $ US |
| 2006 | 4 852 650 000 $ US | 384 543 976 $ US |
| 2005 | 3 682 066 000 $ US | 344 107 802 $ US |
| 2004 | 3 016 850 000 $ US | 301 700 000 $ US |
| 2003 | 2 318 550 000 $ US | 329 346 500 $ US |
| 2002 | 1 974 575 000 $ US | 355 290 000 $ US |
| 2001 | 2 348 800 000 $ US | 390 690 000 $ US |
| 2000 | 2 739 500 000 $ US | 420 760 000 $ US |
| 1999 | 2 623 200 000 $ US | 493 800 000 $ US |
| 1998 | 3 815 500 000 $ US | 575 900 000 $ US |
| 1997 | 4 095 610 000 $ US | 654 600 000 $ US |
| 1996 | 4 291 722 640 $ US | 658 800 000 $ US |
| 1995 | 4 417 737 429 $ US | 710 700 000 $ US |
| 1994 | 3 603 500 000 $ US | 593 400 000 $ US |
| 1993 | 2 779 600 000 $ US | 592 800 000 $ US |
| 1992 | 1 988 000 000 $ US | 464 500 000 $ US |
| 1991 | 1 920 500 000 $ US | 460 300 000 $ US |
| 1990 | 1 734 800 000 $ US | 434 200 000 $ US |
| 1989 | 1 015 900 000 $ US | 303 500 000 $ US |
| 1988 | 1 030 100 000 $ US | 300 800 000 $ US |
| 1987 | 918 700 000 $ US | 256 300 000 $ US |
| 1986 | 864 200 000 $ US | 224 900 000 $ US |
| 1985 | 659 300 000 $ US | 180 300 000 $ US |
| 1984 | 649 100 000 $ US | 211 900 000 $ US |
| 1983 | 551 400 000 $ US | 157 400 000 $ US |
| 1982 | 711 300 000 $ US | 250 300 000 $ US |
| 1981 | 772 400 000 $ US | 203 900 000 $ US |
| 1980 | 675 300 000 $ US | 165 100 000 $ US |
| 1979 | 577 100 000 $ US | 154 200 000 $ US |
| 1978 | 432 000 000 $ US | 95 600 000 $ US |
| 1977 | 360 000 000 $ US | 72 100 000 $ US |
| 1976 | 236 400 000 $ US | 57 800 000 $ US |
| 1975 | 227 300 000 $ US | 55 100 000 $ US |
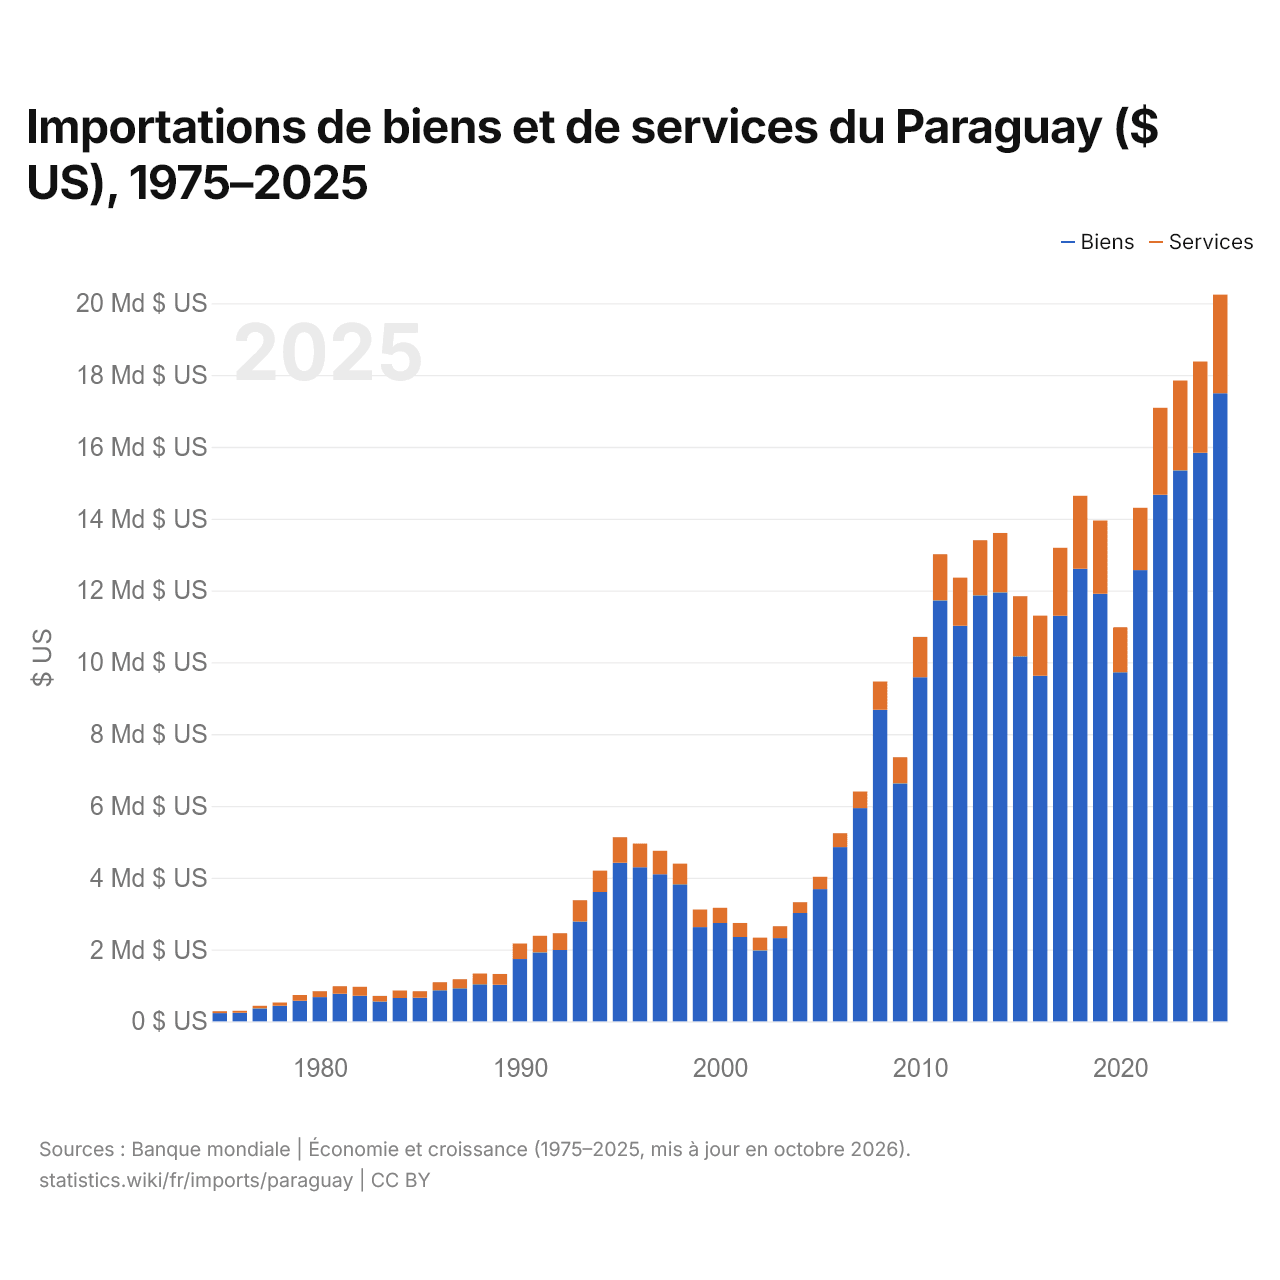
En 2025, les importations de biens du Paraguay s'élevaient à 17,5 milliards de dollars et celles de services à 2,75 milliards de dollars ; les services représentaient 13,6 % du total, contre 19,5 % en 1975.
Le Paraguay dans le classement mondial des importations, 2025






Importations de biens et services du Paraguay, % du PIB, 1962–2025
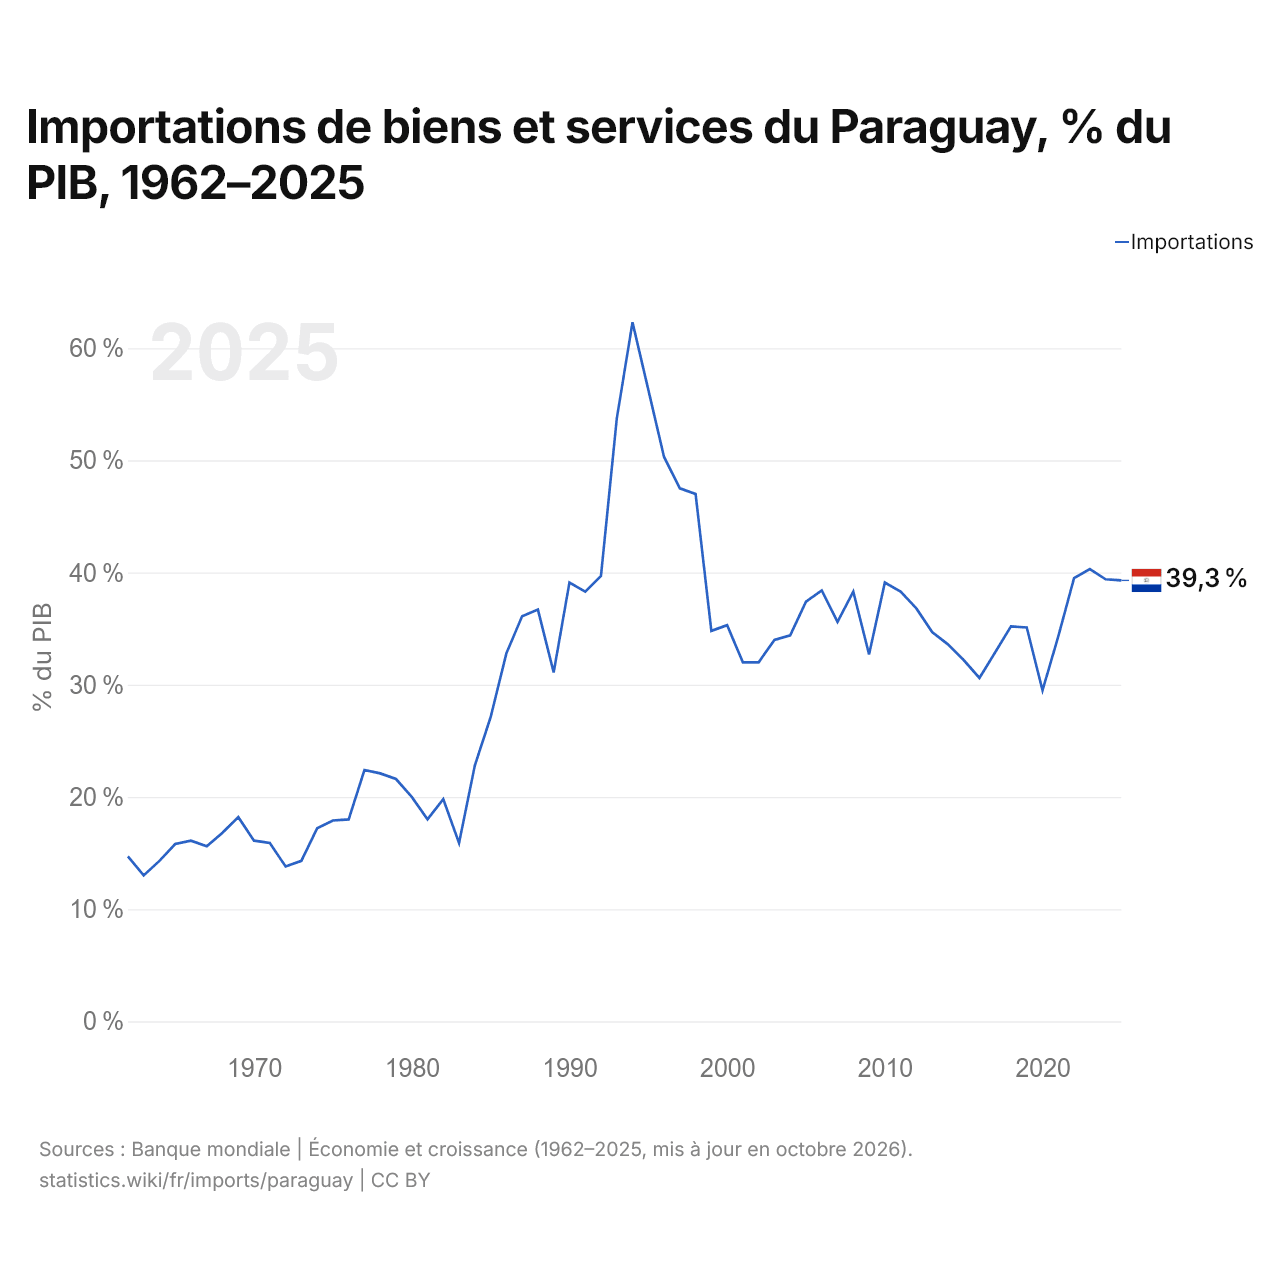
En 2025, les importations de biens et services du Paraguay équivalaient à 39,3 % de son PIB, contre 14,7 % en 1962. La part la plus élevée a été de 62,3 %, en 1994.
Comparer les importations du Paraguay avec celles d'autres pays
Sources :
- Banque mondiale | Économie et croissance (1962–2025, mis à jour en octobre 2026)
- TradeMap (2001–2025, mis à jour en octobre 2026)
Creative Commons Attribution (CC BY) : vous pouvez copier, partager, adapter et réutiliser ce contenu, y compris à des fins commerciales, à condition de citer statistics.wiki et d’indiquer les modifications apportées. Les sources citées ci-dessus peuvent avoir leurs propres conditions de licence.