
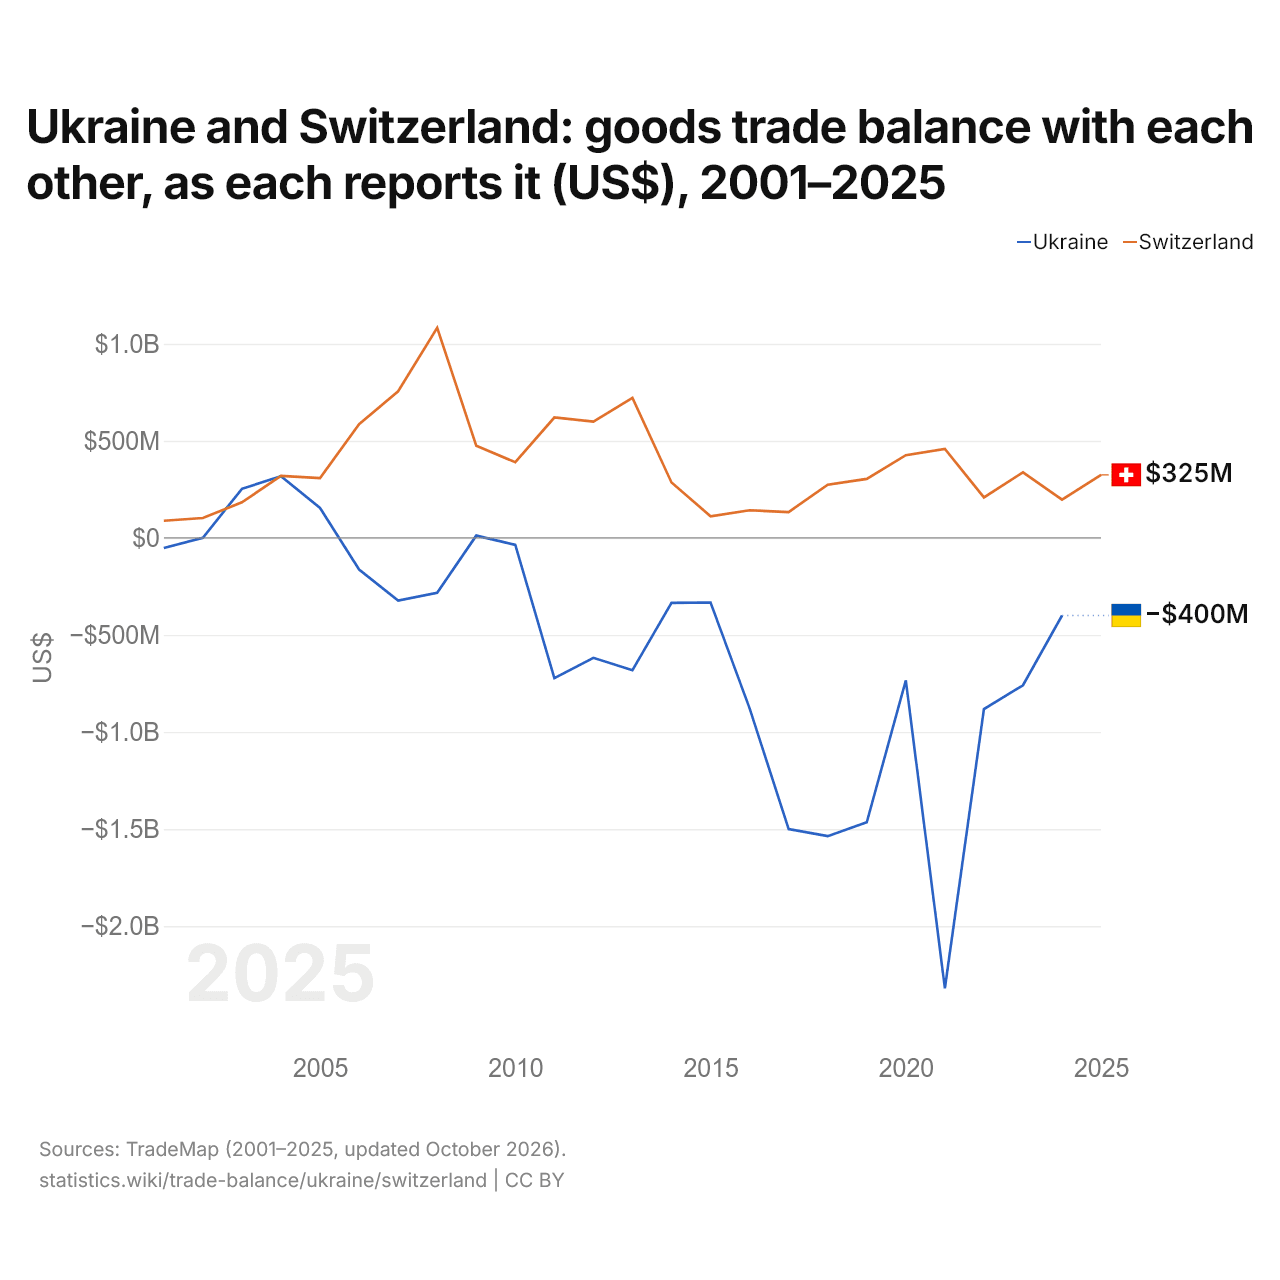
L'Ukraine et la Suisse : solde de leur commerce de biens bilatéral, selon chacun ($ US), 2001–2025
| Année | $ US | |
|---|---|---|
| Ukraine | Suisse | |
| 2025 | - | 324 665 000 $ US |
| 2024 | −399 781 000 $ US | 197 019 000 $ US |
| 2023 | −759 216 000 $ US | 338 168 000 $ US |
| 2022 | −882 316 000 $ US | 208 411 000 $ US |
| 2021 | −2 320 379 000 $ US | 459 004 000 $ US |
| 2020 | −733 768 000 $ US | 426 304 000 $ US |
| 2019 | −1 465 031 000 $ US | 303 865 000 $ US |
| 2018 | −1 536 675 000 $ US | 274 081 000 $ US |
| 2017 | −1 500 064 000 $ US | 133 222 000 $ US |
| 2016 | −878 296 000 $ US | 142 355 000 $ US |
| 2015 | −332 638 000 $ US | 111 543 000 $ US |
| 2014 | −334 994 000 $ US | 285 678 000 $ US |
| 2013 | −681 930 000 $ US | 721 078 000 $ US |
| 2012 | −617 725 000 $ US | 599 180 000 $ US |
| 2011 | −722 581 000 $ US | 620 265 000 $ US |
| 2010 | −35 679 000 $ US | 390 054 000 $ US |
| 2009 | 11 790 000 $ US | 474 971 000 $ US |
| 2008 | −282 624 000 $ US | 1 082 998 000 $ US |
| 2007 | −322 415 000 $ US | 755 630 000 $ US |
| 2006 | −162 978 000 $ US | 585 616 000 $ US |
| 2005 | 154 623 000 $ US | 307 908 000 $ US |
| 2004 | 317 340 000 $ US | 319 723 000 $ US |
| 2003 | 252 772 000 $ US | 183 121 000 $ US |
| 2002 | 733 000 $ US | 102 779 000 $ US |
| 2001 | −51 843 000 $ US | 88 468 000 $ US |
Selon l'Ukraine, son commerce de biens avec la Suisse affichait un déficit de 400 millions de dollars ; selon la Suisse, son commerce de biens avec l'Ukraine affichait un excédent de 197 millions de dollars. En 2001, les chiffres étaient un déficit de 51,8 millions de dollars pour l'Ukraine et un excédent de 88,5 millions de dollars pour la Suisse.
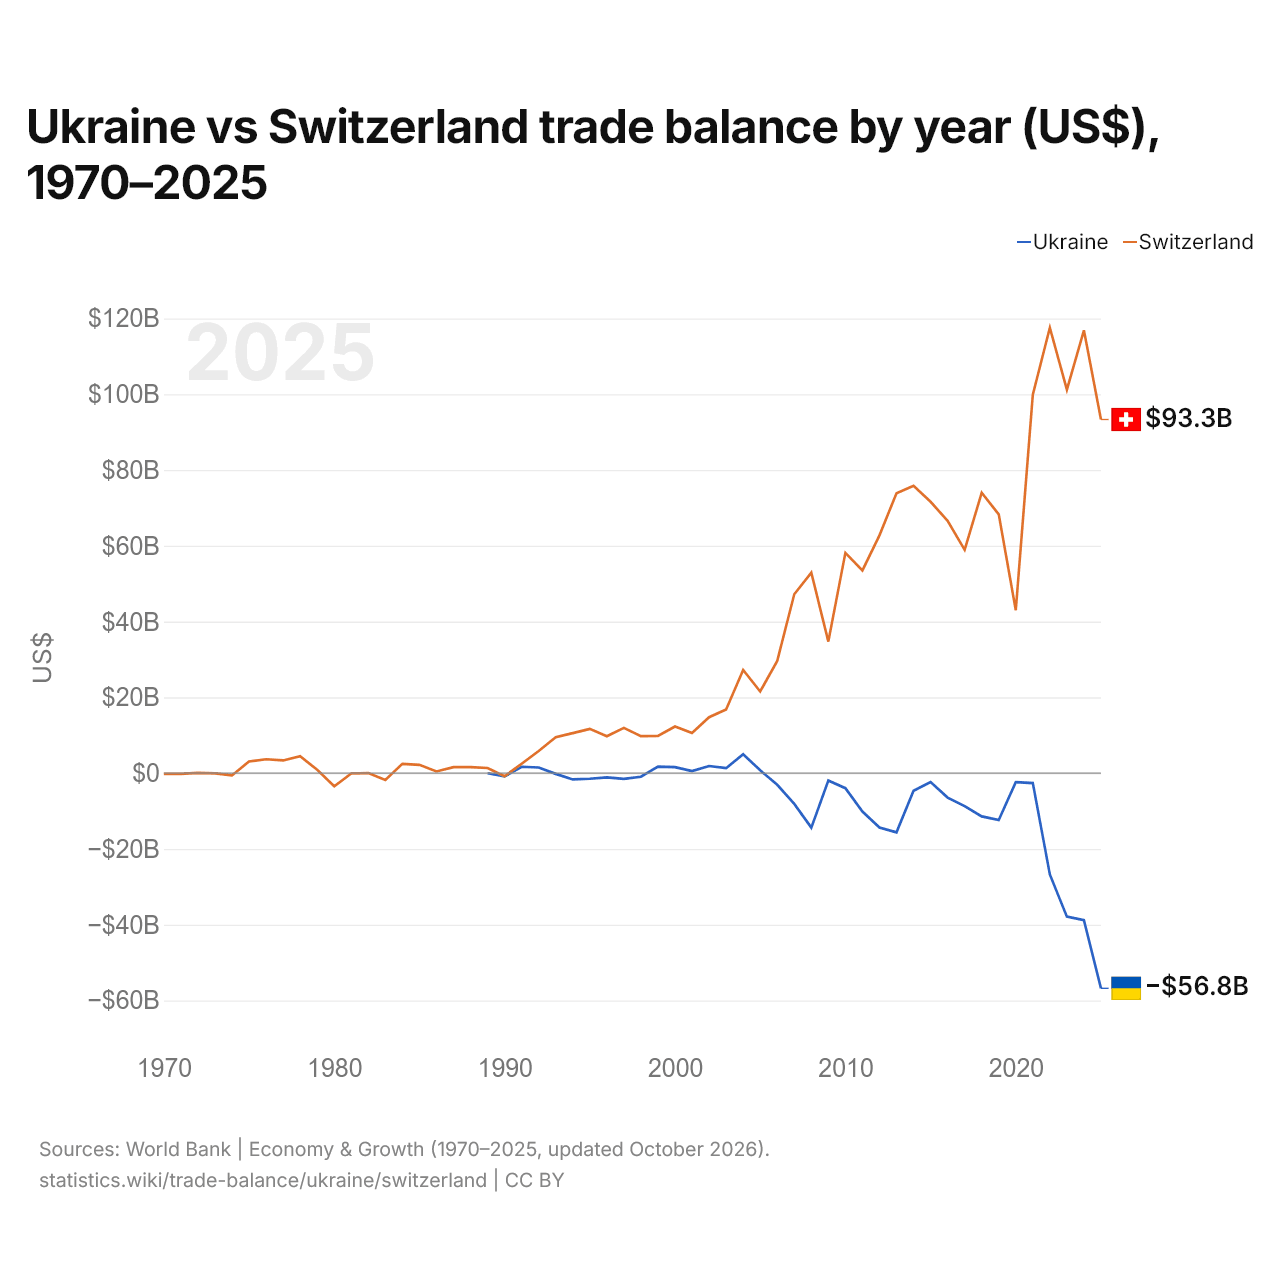
Ukraine vs Suisse : balance commerciale par année ($ US), 1970–2025
| Année | $ US | |
|---|---|---|
 Ukraine |
 Suisse |
|
| 2025 | −56 800 122 814 $ US | 93 327 424 779 $ US |
| 2024 | −38 824 137 717 $ US | 116 875 945 667 $ US |
| 2023 | −37 891 022 997 $ US | 101 202 061 236 $ US |
| 2022 | −26 738 449 230 $ US | 117 559 414 871 $ US |
| 2021 | −2 639 467 168 $ US | 99 877 578 549 $ US |
| 2020 | −2 369 876 403 $ US | 42 986 735 072 $ US |
| 2019 | −12 384 279 577 $ US | 68 295 204 649 $ US |
| 2018 | −11 425 933 031 $ US | 73 995 137 798 $ US |
| 2017 | −8 726 414 190 $ US | 58 909 490 111 $ US |
| 2016 | −6 463 928 654 $ US | 66 597 209 588 $ US |
| 2015 | −2 377 052 775 $ US | 71 602 620 494 $ US |
| 2014 | −4 680 457 309 $ US | 75 842 856 051 $ US |
| 2013 | −15 634 054 798 $ US | 73 866 194 779 $ US |
| 2012 | −14 346 462 765 $ US | 62 754 994 042 $ US |
| 2011 | −10 147 770 404 $ US | 53 497 314 868 $ US |
| 2010 | −3 977 373 467 $ US | 58 133 791 152 $ US |
| 2009 | −1 967 337 677 $ US | 34 705 789 909 $ US |
| 2008 | −14 394 497 592 $ US | 52 921 058 074 $ US |
| 2007 | −8 130 891 089 $ US | 47 201 037 154 $ US |
| 2006 | −3 069 900 990 $ US | 29 597 737 279 $ US |
| 2005 | 724 526 116 $ US | 21 536 056 858 $ US |
| 2004 | 4 982 327 505 $ US | 27 242 195 416 $ US |
| 2003 | 1 298 219 585 $ US | 16 783 998 663 $ US |
| 2002 | 1 864 970 784 $ US | 14 761 475 683 $ US |
| 2001 | 539 267 698 $ US | 10 603 772 813 $ US |
| 2000 | 1 572 910 572 $ US | 12 292 429 536 $ US |
| 1999 | 1 723 000 057 $ US | 9 788 555 452 $ US |
| 1998 | −952 422 820 $ US | 9 746 614 016 $ US |
| 1997 | −1 534 117 222 $ US | 11 941 174 120 $ US |
| 1996 | −1 137 489 348 $ US | 9 727 214 401 $ US |
| 1995 | −1 486 528 419 $ US | 11 678 361 945 $ US |
| 1994 | −1 663 880 073 $ US | 10 539 556 189 $ US |
| 1993 | −205 438 157 $ US | 9 449 052 518 $ US |
| 1992 | 1 472 159 750 $ US | 5 842 552 269 $ US |
| 1991 | 1 681 537 695 $ US | 2 469 264 296 $ US |
| 1990 | −877 295 839 $ US | −826 786 640 $ US |
| 1989 | −53 920 830 $ US | 1 347 452 778 $ US |
| 1988 | - | 1 585 879 861 $ US |
| 1987 | - | 1 565 024 812 $ US |
| 1986 | - | 434 064 150 $ US |
| 1985 | - | 2 176 477 962 $ US |
| 1984 | - | 2 438 939 013 $ US |
| 1983 | - | −1 788 923 824 $ US |
| 1982 | - | 4 030 439 $ US |
| 1981 | - | −99 430 302 $ US |
| 1980 | - | −3 479 950 468 $ US |
| 1979 | - | 879 793 108 $ US |
| 1978 | - | 4 440 991 611 $ US |
| 1977 | - | 3 344 607 447 $ US |
| 1976 | - | 3 651 735 878 $ US |
| 1975 | - | 3 077 404 796 $ US |
| 1974 | - | −618 285 168 $ US |
| 1973 | - | −63 467 202 $ US |
| 1972 | - | 43 511 115 $ US |
| 1971 | - | −193 591 766 $ US |
| 1970 | - | −193 422 365 $ US |
En 2025, la balance commerciale de l'Ukraine affichait un déficit de 56,8 milliards de dollars et celle de la Suisse un excédent de 93,3 milliards de dollars. En 1989, la balance commerciale de l'Ukraine affichait un déficit de 53,9 millions de dollars et celle de la Suisse un excédent de 1,35 milliard de dollars.
De 1989 à 2025, la balance commerciale de l'Ukraine a été excédentaire pendant 9 des 37 années, et celle de la Suisse pendant 36. Les balances commerciales de l'Ukraine et de la Suisse n'ont été déficitaires en même temps qu'une seule de ces années, en 1990.
Ukraine vs Suisse : chiffres de la balance commerciale
|
Ukraine
|
Suisse
|
|
|---|---|---|
| Biens et services, $ US | −56,8 Md $US (2025) | +93,3 Md $US (2025) |
| % du PIB | −26,5 % (2025) | +8,9 % (2025) |
| Années d'excédent depuis 2000 | 6 sur 26 | 26 sur 26 |
| Solde des biens entre les deux, chiffres propres | −400 M $US (2024) | +325 M $US (2025) |
| Premier excédent en biens avec | Espagne (+2,01 Md $US, 2024) | États-Unis (+57,0 Md $US, 2025) |
| Premier déficit en biens avec | Chine (−11,9 Md $US, 2024) | Émirats arabes unis (−35,9 Md $US, 2025) |
Comparer la balance commerciale de 2 pays au choix
Sources :
- Banque mondiale | Économie et croissance (1970–2025, mis à jour en octobre 2026)
- TradeMap (2001–2025, mis à jour en octobre 2026)
Creative Commons Attribution (CC BY) : vous pouvez copier, partager, adapter et réutiliser ce contenu, y compris à des fins commerciales, à condition de citer statistics.wiki et d’indiquer les modifications apportées. Les sources citées ci-dessus peuvent avoir leurs propres conditions de licence.