
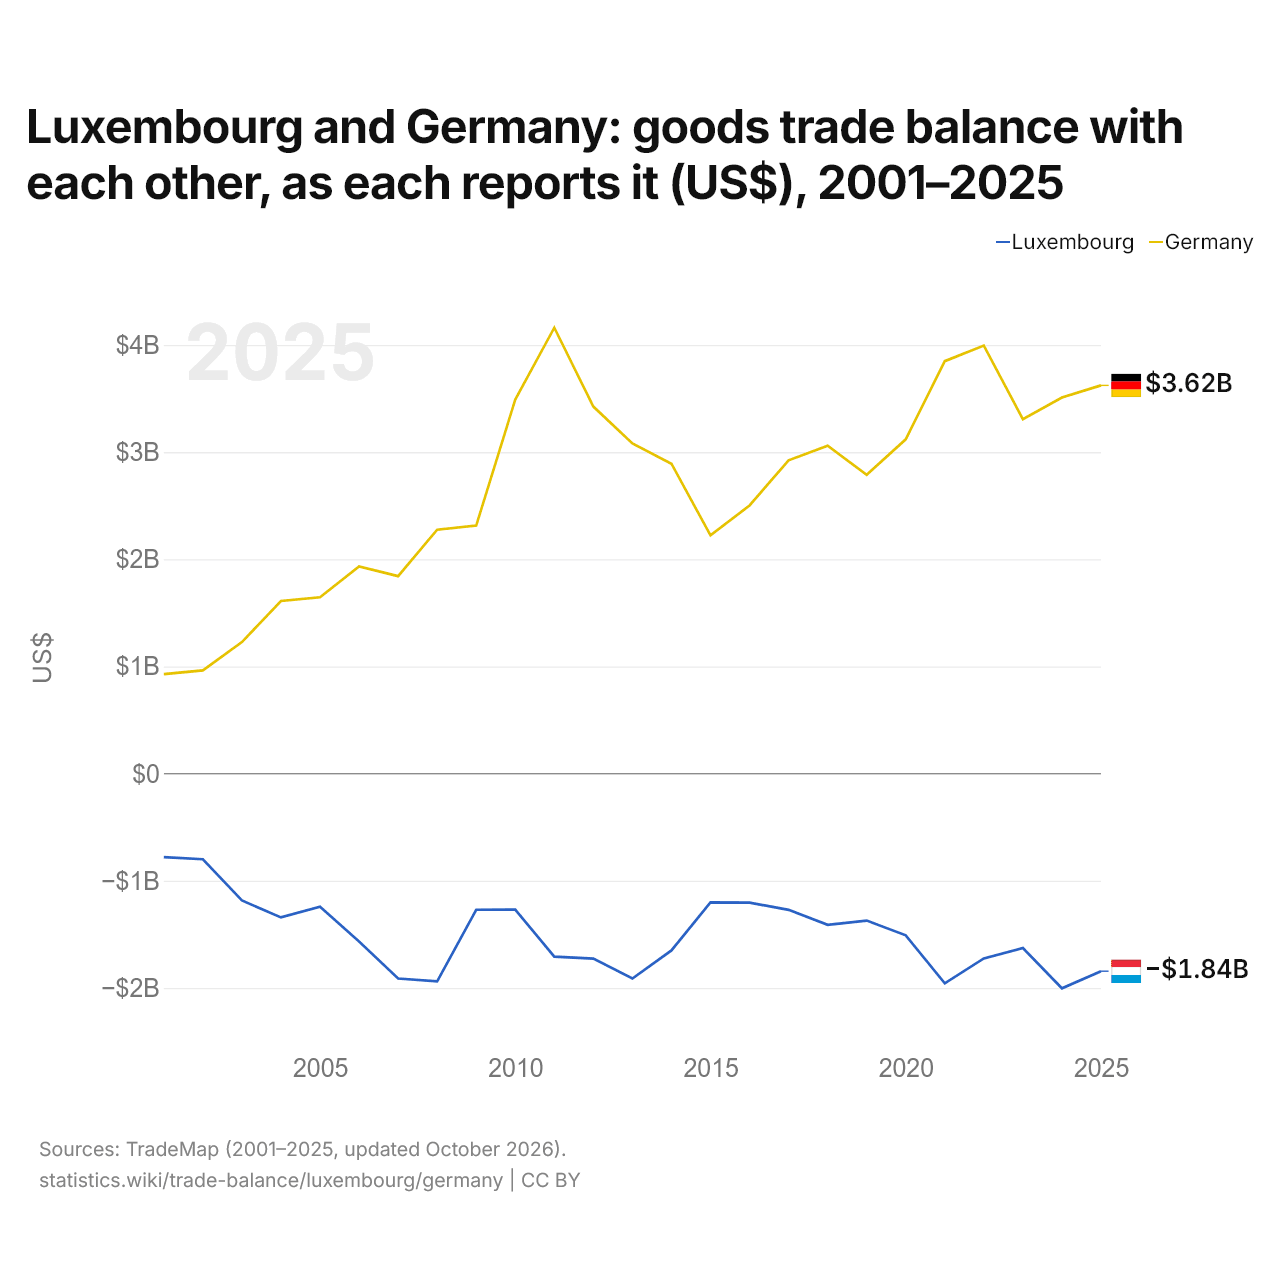
Le Luxembourg et l'Allemagne : solde de leur commerce de biens bilatéral, selon chacun ($ US), 2001–2025
| Année | $ US | |
|---|---|---|
| Luxembourg | Allemagne | |
| 2025 | −1 844 057 000 $ US | 3 622 238 000 $ US |
| 2024 | −2 003 810 000 $ US | 3 508 637 000 $ US |
| 2023 | −1 627 940 000 $ US | 3 306 368 000 $ US |
| 2022 | −1 725 069 000 $ US | 3 993 770 000 $ US |
| 2021 | −1 957 509 000 $ US | 3 848 363 000 $ US |
| 2020 | −1 508 875 000 $ US | 3 118 649 000 $ US |
| 2019 | −1 371 741 000 $ US | 2 787 550 000 $ US |
| 2018 | −1 411 887 000 $ US | 3 059 724 000 $ US |
| 2017 | −1 271 892 000 $ US | 2 922 701 000 $ US |
| 2016 | −1 204 807 000 $ US | 2 501 410 000 $ US |
| 2015 | −1 201 417 000 $ US | 2 222 932 000 $ US |
| 2014 | −1 650 755 000 $ US | 2 891 413 000 $ US |
| 2013 | −1 912 652 000 $ US | 3 079 983 000 $ US |
| 2012 | −1 726 761 000 $ US | 3 424 619 000 $ US |
| 2011 | −1 707 712 000 $ US | 4 160 629 000 $ US |
| 2010 | −1 269 391 000 $ US | 3 489 415 000 $ US |
| 2009 | −1 271 088 000 $ US | 2 314 008 000 $ US |
| 2008 | −1 938 743 000 $ US | 2 275 873 000 $ US |
| 2007 | −1 912 972 000 $ US | 1 842 184 000 $ US |
| 2006 | −1 567 833 000 $ US | 1 933 356 000 $ US |
| 2005 | −1 241 925 000 $ US | 1 644 867 000 $ US |
| 2004 | −1 342 270 000 $ US | 1 610 746 000 $ US |
| 2003 | −1 184 157 000 $ US | 1 226 996 000 $ US |
| 2002 | −799 082 000 $ US | 962 971 000 $ US |
| 2001 | −780 193 000 $ US | 928 318 000 $ US |
En 2025, selon le Luxembourg, son commerce de biens avec l'Allemagne affichait un déficit de 1,84 milliard de dollars ; selon l'Allemagne, son commerce de biens avec le Luxembourg affichait un excédent de 3,62 milliards de dollars. En 2001, les chiffres étaient un déficit de 780 millions de dollars pour le Luxembourg et un excédent de 928 millions de dollars pour l'Allemagne.
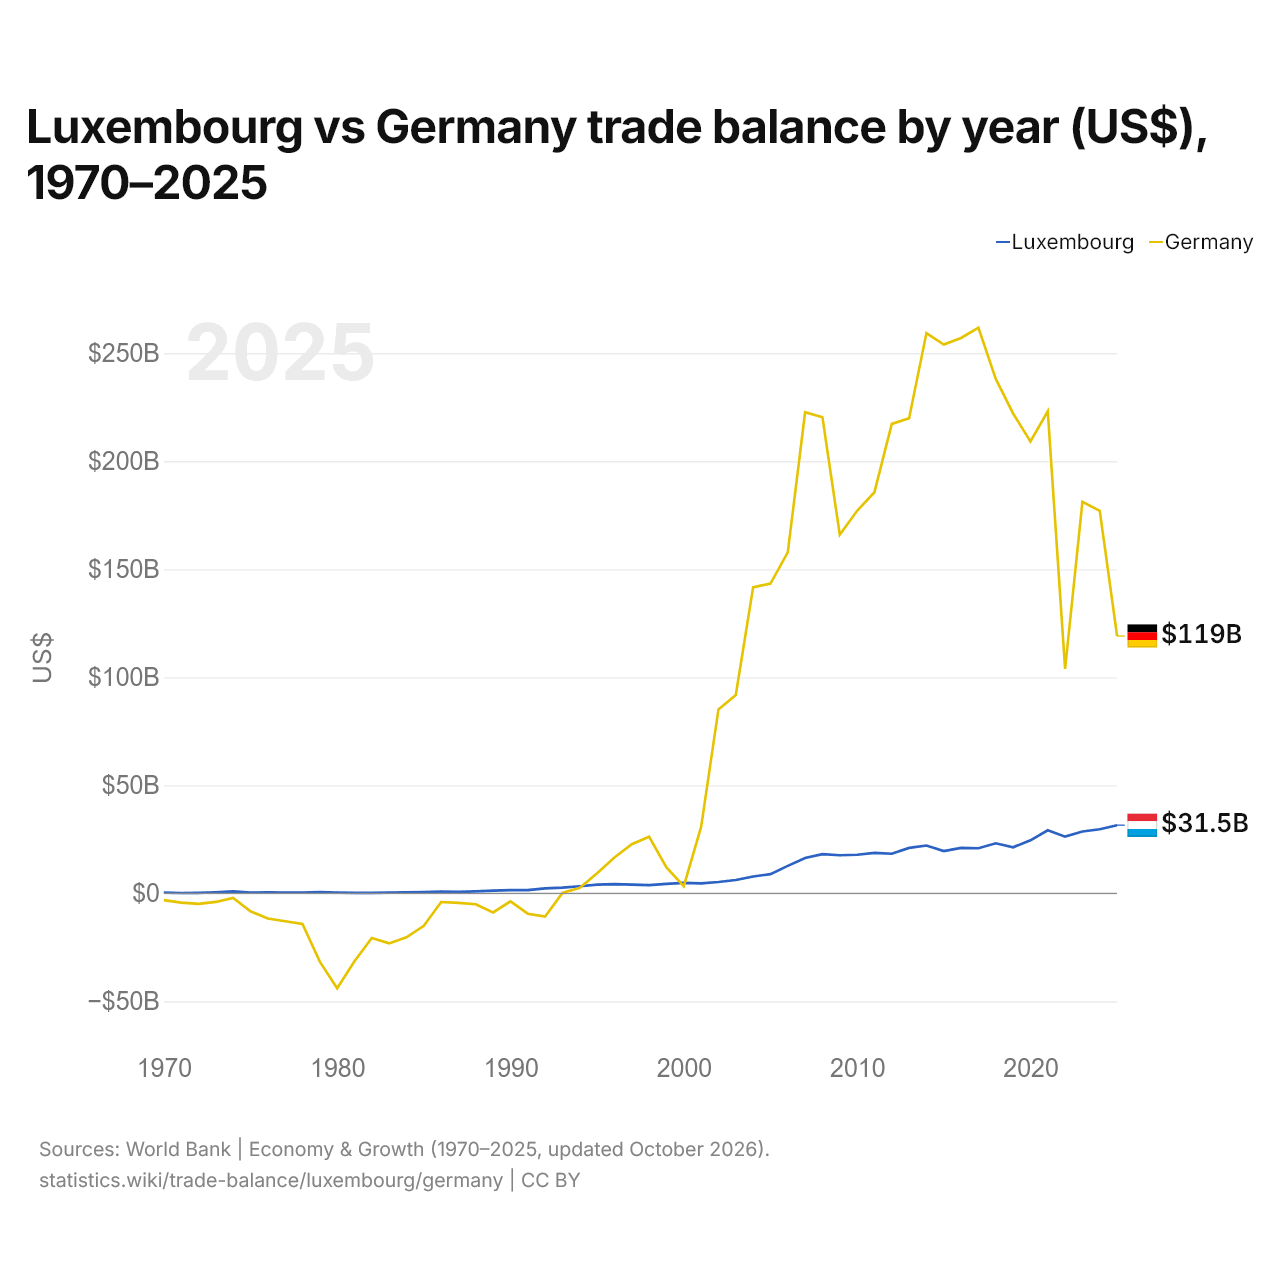
Luxembourg vs Allemagne : balance commerciale par année ($ US), 1970–2025
| Année | $ US | |
|---|---|---|
 Luxembourg |
 Allemagne |
|
| 2025 | 31 518 141 665 $ US | 119 036 943 611 $ US |
| 2024 | 29 661 145 226 $ US | 176 993 019 011 $ US |
| 2023 | 28 583 517 820 $ US | 181 209 809 275 $ US |
| 2022 | 26 211 856 977 $ US | 103 809 534 747 $ US |
| 2021 | 29 138 379 401 $ US | 222 995 040 802 $ US |
| 2020 | 24 526 867 050 $ US | 209 133 823 156 $ US |
| 2019 | 21 310 629 102 $ US | 222 041 052 173 $ US |
| 2018 | 23 153 266 233 $ US | 237 995 400 452 $ US |
| 2017 | 20 831 428 214 $ US | 261 732 442 733 $ US |
| 2016 | 21 004 332 240 $ US | 256 950 954 099 $ US |
| 2015 | 19 546 634 762 $ US | 253 944 200 893 $ US |
| 2014 | 22 111 345 194 $ US | 259 262 242 062 $ US |
| 2013 | 21 017 073 520 $ US | 219 838 066 559 $ US |
| 2012 | 18 313 535 758 $ US | 217 210 227 233 $ US |
| 2011 | 18 671 634 868 $ US | 185 606 097 335 $ US |
| 2010 | 17 846 724 852 $ US | 177 011 015 050 $ US |
| 2009 | 17 602 447 068 $ US | 165 923 316 906 $ US |
| 2008 | 18 109 940 088 $ US | 220 288 283 354 $ US |
| 2007 | 16 336 899 957 $ US | 222 623 193 646 $ US |
| 2006 | 12 701 864 962 $ US | 157 789 848 554 $ US |
| 2005 | 8 879 862 271 $ US | 143 315 467 107 $ US |
| 2004 | 7 799 067 257 $ US | 141 587 181 187 $ US |
| 2003 | 6 146 511 782 $ US | 91 785 747 701 $ US |
| 2002 | 5 211 065 311 $ US | 85 110 145 458 $ US |
| 2001 | 4 627 460 723 $ US | 30 705 762 723 $ US |
| 2000 | 4 856 938 506 $ US | 3 259 428 685 $ US |
| 1999 | 4 369 002 405 $ US | 11 966 537 957 $ US |
| 1998 | 3 793 094 021 $ US | 26 183 172 169 $ US |
| 1997 | 3 981 856 112 $ US | 22 686 668 171 $ US |
| 1996 | 4 247 033 225 $ US | 16 562 256 304 $ US |
| 1995 | 4 048 253 968 $ US | 9 254 810 973 $ US |
| 1994 | 3 273 598 987 $ US | 2 562 371 942 $ US |
| 1993 | 2 600 159 748 $ US | 179 817 816 $ US |
| 1992 | 2 273 483 061 $ US | −10 812 773 951 $ US |
| 1991 | 1 459 135 263 $ US | −9 442 545 669 $ US |
| 1990 | 1 484 205 698 $ US | −3 700 909 091 $ US |
| 1989 | 1 266 363 636 $ US | −8 860 353 688 $ US |
| 1988 | 862 131 651 $ US | −5 073 354 494 $ US |
| 1987 | 625 157 212 $ US | −4 398 411 317 $ US |
| 1986 | 801 841 250 $ US | −4 040 852 923 $ US |
| 1985 | 574 526 123 $ US | −15 052 044 247 $ US |
| 1984 | 394 617 425 $ US | −20 362 746 203 $ US |
| 1983 | 302 460 750 $ US | −23 185 607 813 $ US |
| 1982 | 224 778 386 $ US | −20 687 120 174 $ US |
| 1981 | 179 524 120 $ US | −31 452 268 282 $ US |
| 1980 | 344 654 435 $ US | −43 964 356 574 $ US |
| 1979 | 572 656 852 $ US | −31 634 161 776 $ US |
| 1978 | 348 275 906 $ US | −14 221 404 090 $ US |
| 1977 | 383 322 454 $ US | −12 957 768 887 $ US |
| 1976 | 405 474 399 $ US | −11 645 608 203 $ US |
| 1975 | 335 657 563 $ US | −8 334 008 268 $ US |
| 1974 | 868 957 125 $ US | −2 193 463 835 $ US |
| 1973 | 479 769 199 $ US | −4 000 794 731 $ US |
| 1972 | 222 945 651 $ US | −4 909 821 505 $ US |
| 1971 | 149 808 502 $ US | −4 336 130 597 $ US |
| 1970 | 273 181 121 $ US | −3 162 513 226 $ US |
En 2025, la balance commerciale du Luxembourg affichait un excédent de 31,5 milliards de dollars et celle de l'Allemagne un excédent de 119 milliards de dollars ; l'excédent de l'Allemagne était 3,8 fois plus grand. En 1970, la balance commerciale du Luxembourg affichait un excédent de 273 millions de dollars et celle de l'Allemagne un déficit de 3,16 milliards de dollars.
De 1970 à 2025, la balance commerciale du Luxembourg a été excédentaire chacune des 56 années, et celle de l'Allemagne pendant 33. Les balances commerciales du Luxembourg et de l'Allemagne n'ont jamais été déficitaires la même année.
Luxembourg vs Allemagne : chiffres de la balance commerciale
|
Luxembourg
|
Allemagne
|
|
|---|---|---|
| Biens et services, $ US | +31,5 Md $US (2025) | +119 Md $US (2025) |
| % du PIB | +31,2 % (2025) | +2,4 % (2025) |
| Années d'excédent depuis 2000 | 26 sur 26 | 26 sur 26 |
| Solde des biens entre les deux, chiffres propres | −1,84 Md $US (2025) | +3,62 Md $US (2025) |
| Premier excédent en biens avec | Suède (+137 M $US, 2025) | États-Unis (+62,9 Md $US, 2025) |
| Premier déficit en biens avec | Belgique (−3,35 Md $US, 2025) | Chine (−102 Md $US, 2025) |
Comparer la balance commerciale de 2 pays au choix
Sources :
- Banque mondiale | Économie et croissance (1970–2025, mis à jour en octobre 2026)
- TradeMap (2001–2025, mis à jour en octobre 2026)
Creative Commons Attribution (CC BY) : vous pouvez copier, partager, adapter et réutiliser ce contenu, y compris à des fins commerciales, à condition de citer statistics.wiki et d’indiquer les modifications apportées. Les sources citées ci-dessus peuvent avoir leurs propres conditions de licence.