
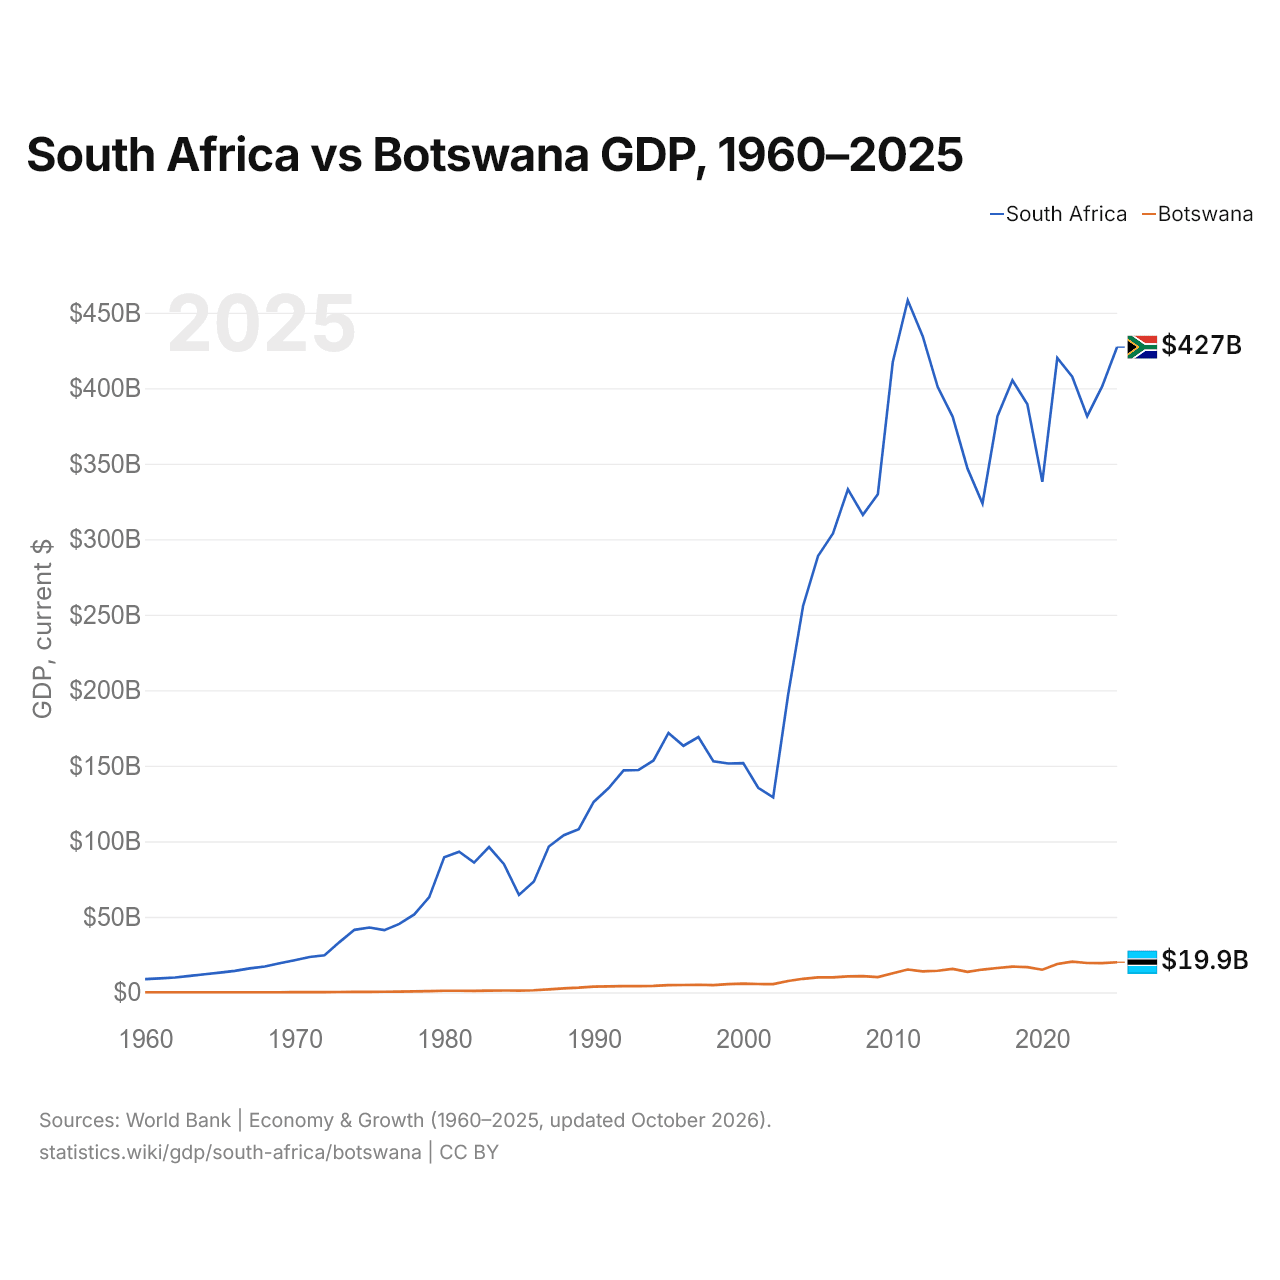
Afrique du Sud vs Botswana : PIB, 1960–2025
| Année | PIB, dollars US courants | |
|---|---|---|
 Afrique du Sud |
 Botswana |
|
| 2025 | 427 184 325 997 $ US | 19 928 479 839 $ US |
| 2024 | 401 144 998 374 $ US | 19 286 251 068 $ US |
| 2023 | 381 440 724 491 $ US | 19 413 614 555 $ US |
| 2022 | 407 596 043 068 $ US | 20 321 150 599 $ US |
| 2021 | 419 986 284 375 $ US | 18 750 182 236 $ US |
| 2020 | 337 974 655 408 $ US | 14 960 251 608 $ US |
| 2019 | 389 330 032 224 $ US | 16 725 908 149 $ US |
| 2018 | 405 260 723 893 $ US | 17 031 943 186 $ US |
| 2017 | 381 448 814 653 $ US | 16 105 155 857 $ US |
| 2016 | 323 585 509 674 $ US | 15 082 637 184 $ US |
| 2015 | 346 709 790 459 $ US | 13 530 748 845 $ US |
| 2014 | 381 198 869 776 $ US | 15 470 088 501 $ US |
| 2013 | 400 886 013 596 $ US | 14 271 738 933 $ US |
| 2012 | 434 400 545 086 $ US | 13 907 464 500 $ US |
| 2011 | 458 199 494 831 $ US | 15 110 643 612 $ US |
| 2010 | 417 363 822 802 $ US | 12 637 273 429 $ US |
| 2009 | 329 754 060 647 $ US | 10 118 459 242 $ US |
| 2008 | 316 131 258 616 $ US | 10 730 829 116 $ US |
| 2007 | 333 077 117 254 $ US | 10 567 270 656 $ US |
| 2006 | 303 858 675 364 $ US | 9 919 158 482 $ US |
| 2005 | 288 867 217 197 $ US | 9 918 907 108 $ US |
| 2004 | 255 806 908 595 $ US | 8 957 467 707 $ US |
| 2003 | 197 018 965 309 $ US | 7 511 582 173 $ US |
| 2002 | 129 087 556 612 $ US | 5 438 863 983 $ US |
| 2001 | 135 429 905 923 $ US | 5 489 608 300 $ US |
| 2000 | 151 752 757 215 $ US | 5 788 329 609 $ US |
| 1999 | 151 516 957 079 $ US | 5 484 263 347 $ US |
| 1998 | 152 982 984 557 $ US | 4 790 481 509 $ US |
| 1997 | 168 978 057 328 $ US | 5 020 265 627 $ US |
| 1996 | 163 234 925 381 $ US | 4 847 757 218 $ US |
| 1995 | 171 735 933 897 $ US | 4 730 599 122 $ US |
| 1994 | 153 512 712 382 $ US | 4 259 259 604 $ US |
| 1993 | 147 194 747 566 $ US | 4 160 129 175 $ US |
| 1992 | 146 956 150 987 $ US | 4 146 464 587 $ US |
| 1991 | 135 203 698 238 $ US | 3 942 876 703 $ US |
| 1990 | 126 048 140 142 $ US | 3 790 636 324 $ US |
| 1989 | 108 055 624 082 $ US | 3 083 822 112 $ US |
| 1988 | 103 976 831 871 $ US | 2 644 554 159 $ US |
| 1987 | 96 535 763 418 $ US | 1 965 226 890 $ US |
| 1986 | 73 354 771 399 $ US | 1 392 602 164 $ US |
| 1985 | 64 459 376 087 $ US | 1 114 783 343 $ US |
| 1984 | 84 870 163 366 $ US | 1 240 822 167 $ US |
| 1983 | 96 204 110 942 $ US | 1 172 230 397 $ US |
| 1982 | 85 904 057 409 $ US | 1 014 945 696 $ US |
| 1981 | 93 141 472 164 $ US | 1 073 812 830 $ US |
| 1980 | 89 411 864 402 $ US | 1 060 889 704 $ US |
| 1979 | 63 038 658 089 $ US | 819 870 259 $ US |
| 1978 | 51 607 412 902 $ US | 590 407 374 $ US |
| 1977 | 45 328 411 332 $ US | 451 624 780 $ US |
| 1976 | 41 150 460 288 $ US | 372 025 093 $ US |
| 1975 | 42 906 905 672 $ US | 355 168 572 $ US |
| 1974 | 41 389 186 095 $ US | 306 044 208 $ US |
| 1973 | 33 262 772 008 $ US | 244 124 164 $ US |
| 1972 | 24 515 919 217 $ US | 164 460 915 $ US |
| 1971 | 23 411 076 638 $ US | 127 448 614 $ US |
| 1970 | 21 218 391 513 $ US | 96 243 234 $ US |
| 1969 | 19 256 992 297 $ US | 77 361 547 $ US |
| 1968 | 17 124 793 150 $ US | 66 248 441 $ US |
| 1967 | 15 821 393 671 $ US | 58 642 354 $ US |
| 1966 | 14 211 394 315 $ US | 51 465 655 $ US |
| 1965 | 13 068 994 772 $ US | 45 788 696 $ US |
| 1964 | 11 955 995 218 $ US | 41 616 348 $ US |
| 1963 | 10 854 195 658 $ US | 38 091 843 $ US |
| 1962 | 9 813 996 074 $ US | 35 644 957 $ US |
| 1961 | 9 225 996 310 $ US | 32 902 613 $ US |
| 1960 | 8 748 596 501 $ US | 30 411 414 $ US |
En 2025, le PIB de l'Afrique du Sud (427 milliards de dollars US) était 21 fois celui du Botswana (19,9 milliards de dollars US). En 2015, le rapport était de 26. De 2015 à 2025, à prix constants de 2015, le PIB de l'Afrique du Sud a progressé de 6,7 % et celui du Botswana de 28,6 %.
Depuis 1960, le PIB de l'Afrique du Sud a chaque année été le plus élevé des deux ; en 1960, il était 290 fois celui du Botswana. En 2025, le PIB par habitant était de 6 598 $ US en Afrique du Sud et de 7 778 $ US au Botswana, soit 18 % de plus au Botswana.
Afrique du Sud vs Botswana : derniers chiffres du PIB
|
Afrique du Sud
|
Botswana
|
|
|---|---|---|
| PIB, dollars US courants | 427 Md $US | 19,9 Md $US |
| Rang mondial | 40/197 | 135/197 |
| Part mondiale | 0,36 % | 0,02 % |
| PIB, dollars US constants de 2015 | 370 Md $US | 17,4 Md $US |
| Écart de PIB | 21× | 0,047× |
Comparer le PIB de 2 pays au choix
Sources :
- Banque mondiale | Économie et croissance (1960–2025, mis à jour en octobre 2026)
Creative Commons Attribution (CC BY) : vous pouvez copier, partager, adapter et réutiliser ce contenu, y compris à des fins commerciales, à condition de citer statistics.wiki et d’indiquer les modifications apportées. Les sources citées ci-dessus peuvent avoir leurs propres conditions de licence.