
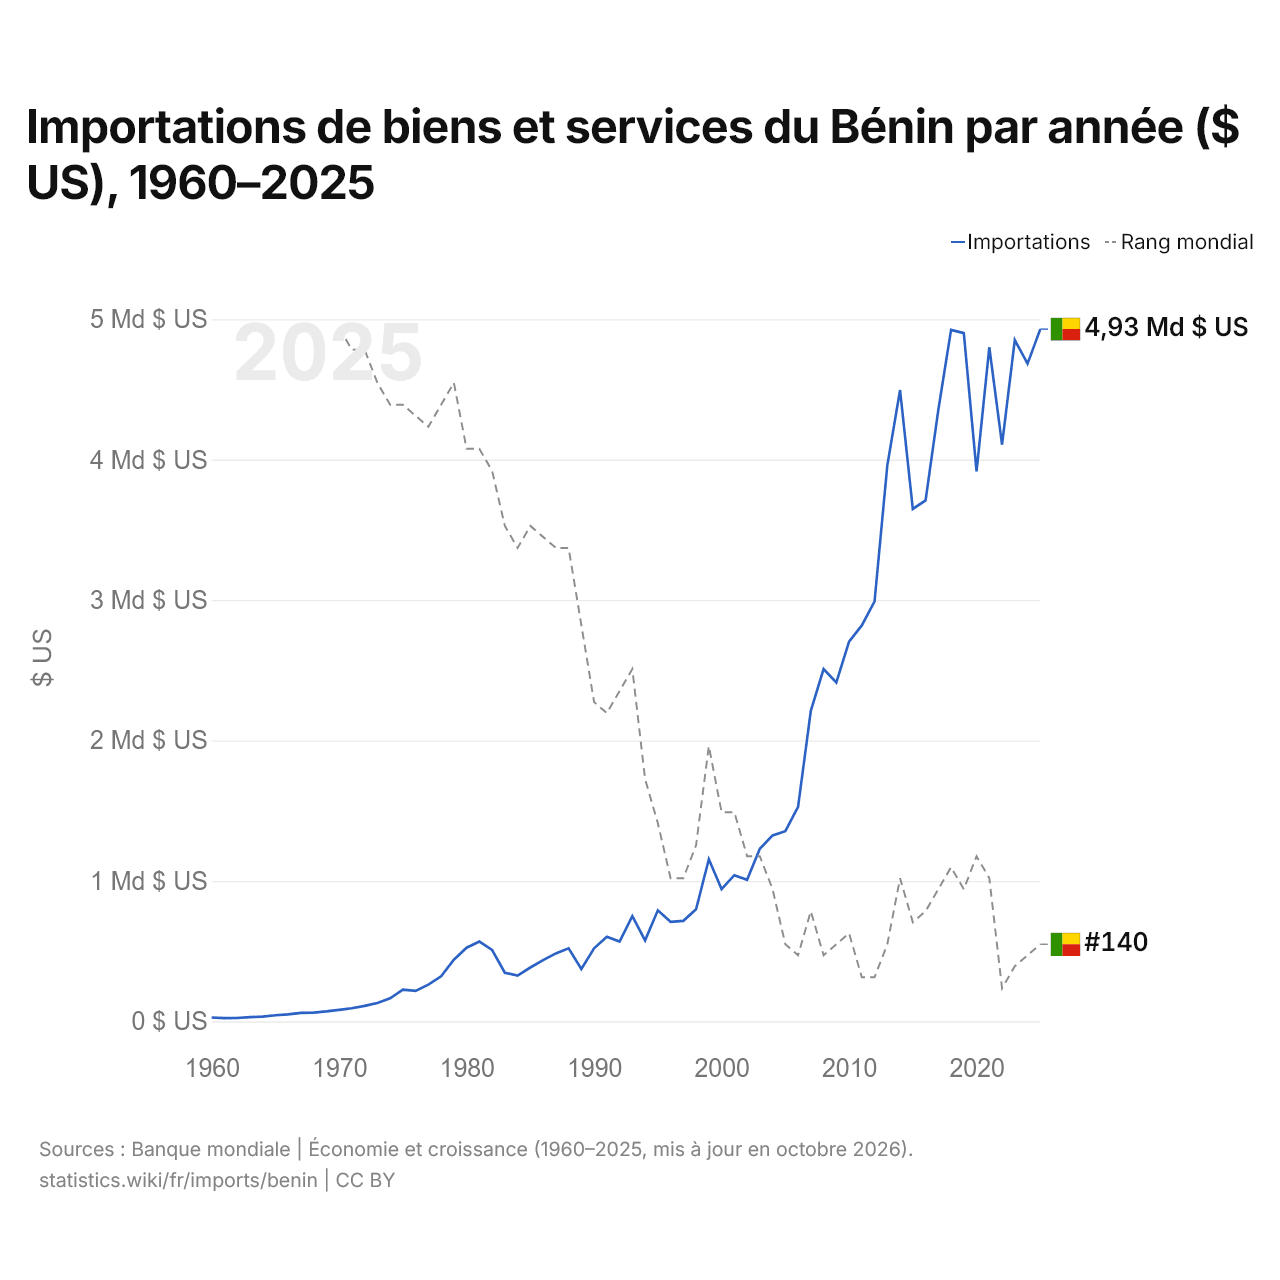
Importations de biens et services du Bénin par année ($ US), 1960–2025
| Année | $ US | Rang mondial |
|---|---|---|
| Importations | Rang mondial | |
| 2025 | 4 929 128 052 $ US | #140 |
| 2024 | 4 683 140 134 $ US | #141 |
| 2023 | 4 851 357 176 $ US | #142 |
| 2022 | 4 106 516 765 $ US | #144 |
| 2021 | 4 799 723 189 $ US | #134 |
| 2020 | 3 915 530 456 $ US | #132 |
| 2019 | 4 900 485 060 $ US | #135 |
| 2018 | 4 923 520 744 $ US | #133 |
| 2017 | 4 352 984 748 $ US | #135 |
| 2016 | 3 709 467 046 $ US | #137 |
| 2015 | 3 648 295 538 $ US | #138 |
| 2014 | 4 495 143 318 $ US | #134 |
| 2013 | 3 959 347 660 $ US | #140 |
| 2012 | 2 990 340 509 $ US | #143 |
| 2011 | 2 819 548 391 $ US | #143 |
| 2010 | 2 704 110 555 $ US | #139 |
| 2009 | 2 412 711 825 $ US | #140 |
| 2008 | 2 509 050 412 $ US | #141 |
| 2007 | 2 211 437 454 $ US | #137 |
| 2006 | 1 527 581 987 $ US | #141 |
| 2005 | 1 353 744 165 $ US | #140 |
| 2004 | 1 324 063 350 $ US | #135 |
| 2003 | 1 228 828 002 $ US | #132 |
| 2002 | 1 008 395 973 $ US | #132 |
| 2001 | 1 040 788 979 $ US | #128 |
| 2000 | 941 345 994 $ US | #128 |
| 1999 | 1 154 049 286 $ US | #122 |
| 1998 | 797 921 959 $ US | #131 |
| 1997 | 715 320 153 $ US | #134 |
| 1996 | 708 783 072 $ US | #134 |
| 1995 | 790 421 148 $ US | #129 |
| 1994 | 576 481 297 $ US | #125 |
| 1993 | 748 725 748 $ US | #115 |
| 1992 | 567 957 714 $ US | #117 |
| 1991 | 602 729 540 $ US | #119 |
| 1990 | 520 152 830 $ US | #118 |
| 1989 | 372 643 204 $ US | #111 |
| 1988 | 519 824 990 $ US | #104 |
| 1987 | 483 576 070 $ US | #104 |
| 1986 | 435 776 313 $ US | #103 |
| 1985 | 383 239 093 $ US | #102 |
| 1984 | 325 136 017 $ US | #104 |
| 1983 | 345 886 017 $ US | #102 |
| 1982 | 508 205 555 $ US | #97 |
| 1981 | 567 561 866 $ US | #95 |
| 1980 | 524 469 594 $ US | #95 |
| 1979 | 439 163 941 $ US | #89 |
| 1978 | 320 872 362 $ US | #91 |
| 1977 | 260 873 185 $ US | #93 |
| 1976 | 216 705 687 $ US | #92 |
| 1975 | 226 162 498 $ US | #91 |
| 1974 | 163 593 501 $ US | #91 |
| 1973 | 130 886 433 $ US | #89 |
| 1972 | 109 969 551 $ US | #86 |
| 1971 | 93 259 583 $ US | #86 |
| 1970 | 81 609 755 $ US | #84 |
| 1969 | 70 874 407 $ US | - |
| 1968 | 62 251 310 $ US | - |
| 1967 | 60 547 020 $ US | - |
| 1966 | 49 061 962 $ US | - |
| 1965 | 43 212 949 $ US | - |
| 1964 | 33 034 387 $ US | - |
| 1963 | 29 521 377 $ US | - |
| 1962 | 23 547 277 $ US | - |
| 1961 | 22 470 098 $ US | - |
| 1960 | 27 392 931 $ US | - |
En 2025, les importations de biens et services du Bénin s'élevaient à 4,93 milliards de dollars, contre 27,4 millions de dollars en 1960. Le minimum a été de 22,5 millions de dollars, en 1961. Elles se classaient au 140e rang mondial, en hausse par rapport au 141e rang en 2024. Leur meilleur rang a été le 84e, occupé pour la dernière fois en 1970.
En 2025, les importations de biens et services du Bénin étaient les 32es plus élevées de 50 pays situés en Afrique. En 2025, les importations du Bénin dépassaient ses exportations de 740 millions de dollars, soit un déficit commercial. Le commerce du Bénin, exportations et importations réunies, équivalait à 37,1 % de son PIB en 2025, au 157e rang mondial.
Importations de biens du Bénin par catégorie, 2025
Importations de biens, 2025: 3,87 Md $US
En 2025, la première catégorie des importations de biens du Bénin était « cultures, plantes et fleurs (céréales, fruits, légumes, café, oléagineux) », avec 24,8 %, suivie de « machines, électronique et véhicules », avec 22,1 %.
Origines des importations de biens du Bénin : les 10 premières, 2025
| Rang | Pays | Importations de biens | Part | |
|---|---|---|---|---|
| 1 |
 Inde |
872 M $US | 22,5 % | |
| 2 |
 Chine |
636 M $US | 16,5 % | |
| 3 |
 France |
349 M $US | 9,04 % | vs France |
| 4 |
 Nigeria |
224 M $US | 5,8 % | |
| 5 |
 Russie |
136 M $US | 3,53 % | |
| 6 |
 Singapour |
113 M $US | 2,91 % | |
| 7 |
 Maroc |
100 M $US | 2,59 % | |
| 8 |
 Turquie |
90,8 M $US | 2,35 % | |
| 9 |
 Italie |
85,6 M $US | 2,21 % | |
| 10 |
 Côte d’Ivoire |
82,1 M $US | 2,13 % | |
| Autres partenaires et non précisés | 1,18 Md $US | 30,4 % |
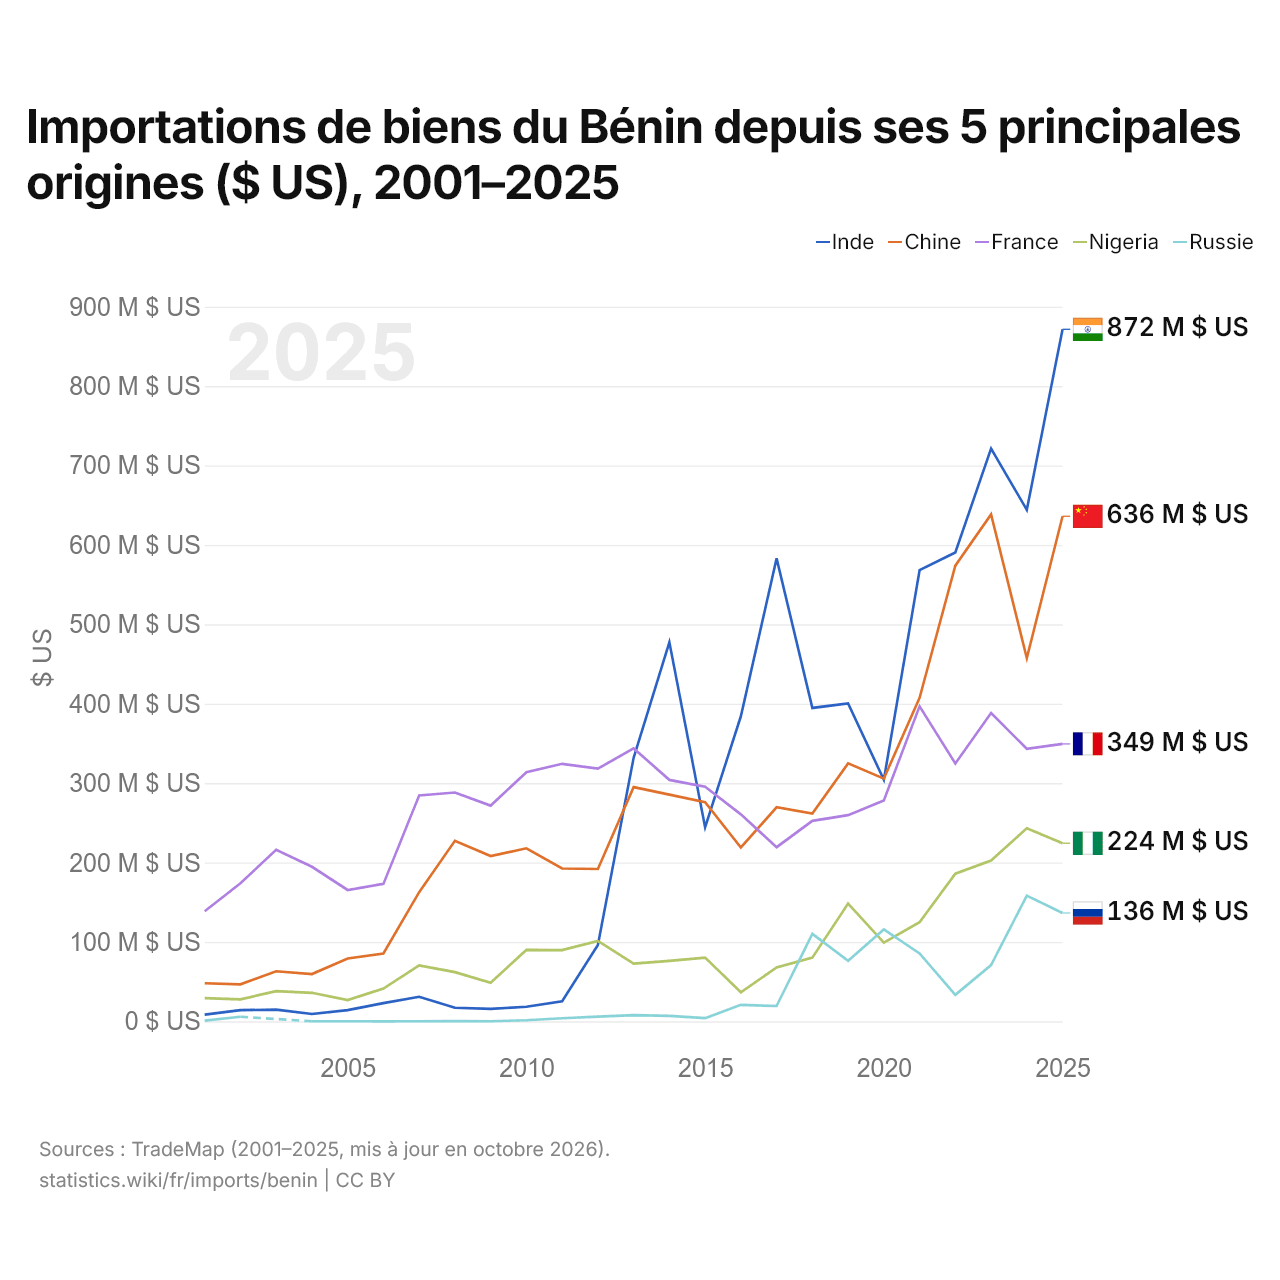
Importations de biens du Bénin depuis ses 5 principales origines ($ US), 2001–2025
| Année | $ US | ||||
|---|---|---|---|---|---|
| Inde | Chine | France | Nigeria | Russie | |
| 2025 | 871 530 000 $ US | 636 055 000 $ US | 349 450 000 $ US | 224 337 000 $ US | 136 494 000 $ US |
| 2024 | 644 141 000 $ US | 457 423 000 $ US | 343 190 000 $ US | 243 230 000 $ US | 158 308 000 $ US |
| 2023 | 721 263 000 $ US | 638 380 000 $ US | 388 198 000 $ US | 202 505 000 $ US | 70 782 000 $ US |
| 2022 | 590 453 000 $ US | 573 787 000 $ US | 324 744 000 $ US | 185 929 000 $ US | 33 335 000 $ US |
| 2021 | 568 166 000 $ US | 407 480 000 $ US | 396 742 000 $ US | 124 819 000 $ US | 85 461 000 $ US |
| 2020 | 304 222 000 $ US | 305 667 000 $ US | 278 171 000 $ US | 99 189 000 $ US | 115 758 000 $ US |
| 2019 | 400 300 000 $ US | 324 849 000 $ US | 259 649 000 $ US | 148 284 000 $ US | 76 322 000 $ US |
| 2018 | 394 695 000 $ US | 261 611 000 $ US | 252 514 000 $ US | 80 188 000 $ US | 110 173 000 $ US |
| 2017 | 582 958 000 $ US | 269 605 000 $ US | 219 290 000 $ US | 67 825 000 $ US | 19 294 000 $ US |
| 2016 | 384 156 000 $ US | 218 936 000 $ US | 260 656 000 $ US | 36 562 000 $ US | 20 742 000 $ US |
| 2015 | 244 388 000 $ US | 276 028 000 $ US | 295 545 000 $ US | 80 323 000 $ US | 3 949 000 $ US |
| 2014 | 477 316 000 $ US | 285 466 000 $ US | 304 053 000 $ US | 76 198 000 $ US | 6 949 000 $ US |
| 2013 | 331 954 000 $ US | 294 954 000 $ US | 343 743 000 $ US | 72 611 000 $ US | 7 897 000 $ US |
| 2012 | 96 139 000 $ US | 191 815 000 $ US | 318 186 000 $ US | 101 263 000 $ US | 5 841 000 $ US |
| 2011 | 25 338 000 $ US | 192 424 000 $ US | 324 312 000 $ US | 89 722 000 $ US | 3 919 000 $ US |
| 2010 | 18 367 000 $ US | 217 887 000 $ US | 313 722 000 $ US | 89 986 000 $ US | 1 315 000 $ US |
| 2009 | 15 627 000 $ US | 208 157 000 $ US | 271 669 000 $ US | 48 507 000 $ US | 146 000 $ US |
| 2008 | 17 079 000 $ US | 227 403 000 $ US | 288 200 000 $ US | 61 936 000 $ US | 352 000 $ US |
| 2007 | 30 908 000 $ US | 162 666 000 $ US | 284 422 000 $ US | 70 378 000 $ US | 108 000 $ US |
| 2006 | 22 948 000 $ US | 85 475 000 $ US | 173 058 000 $ US | 41 318 000 $ US | 25 000 $ US |
| 2005 | 14 137 000 $ US | 79 063 000 $ US | 165 391 000 $ US | 26 780 000 $ US | 118 000 $ US |
| 2004 | 9 225 000 $ US | 59 563 000 $ US | 194 612 000 $ US | 35 929 000 $ US | 61 000 $ US |
| 2003 | 14 774 000 $ US | 63 096 000 $ US | 216 099 000 $ US | 37 976 000 $ US | - |
| 2002 | 14 048 000 $ US | 46 568 000 $ US | 173 867 000 $ US | 27 708 000 $ US | 5 780 000 $ US |
| 2001 | 8 452 000 $ US | 47 992 000 $ US | 138 616 000 $ US | 29 243 000 $ US | 874 000 $ US |
En 2025, les importations de biens s'élevaient à 872 millions de dollars en provenance de l'Inde, 636 millions de dollars en provenance de la Chine, 349 millions de dollars en provenance de la France, 224 millions de dollars en provenance du Nigeria et 136 millions de dollars en provenance de la Russie. Le premier rang des cinq fournisseurs du Bénin est occupé par l'Inde depuis 2021.
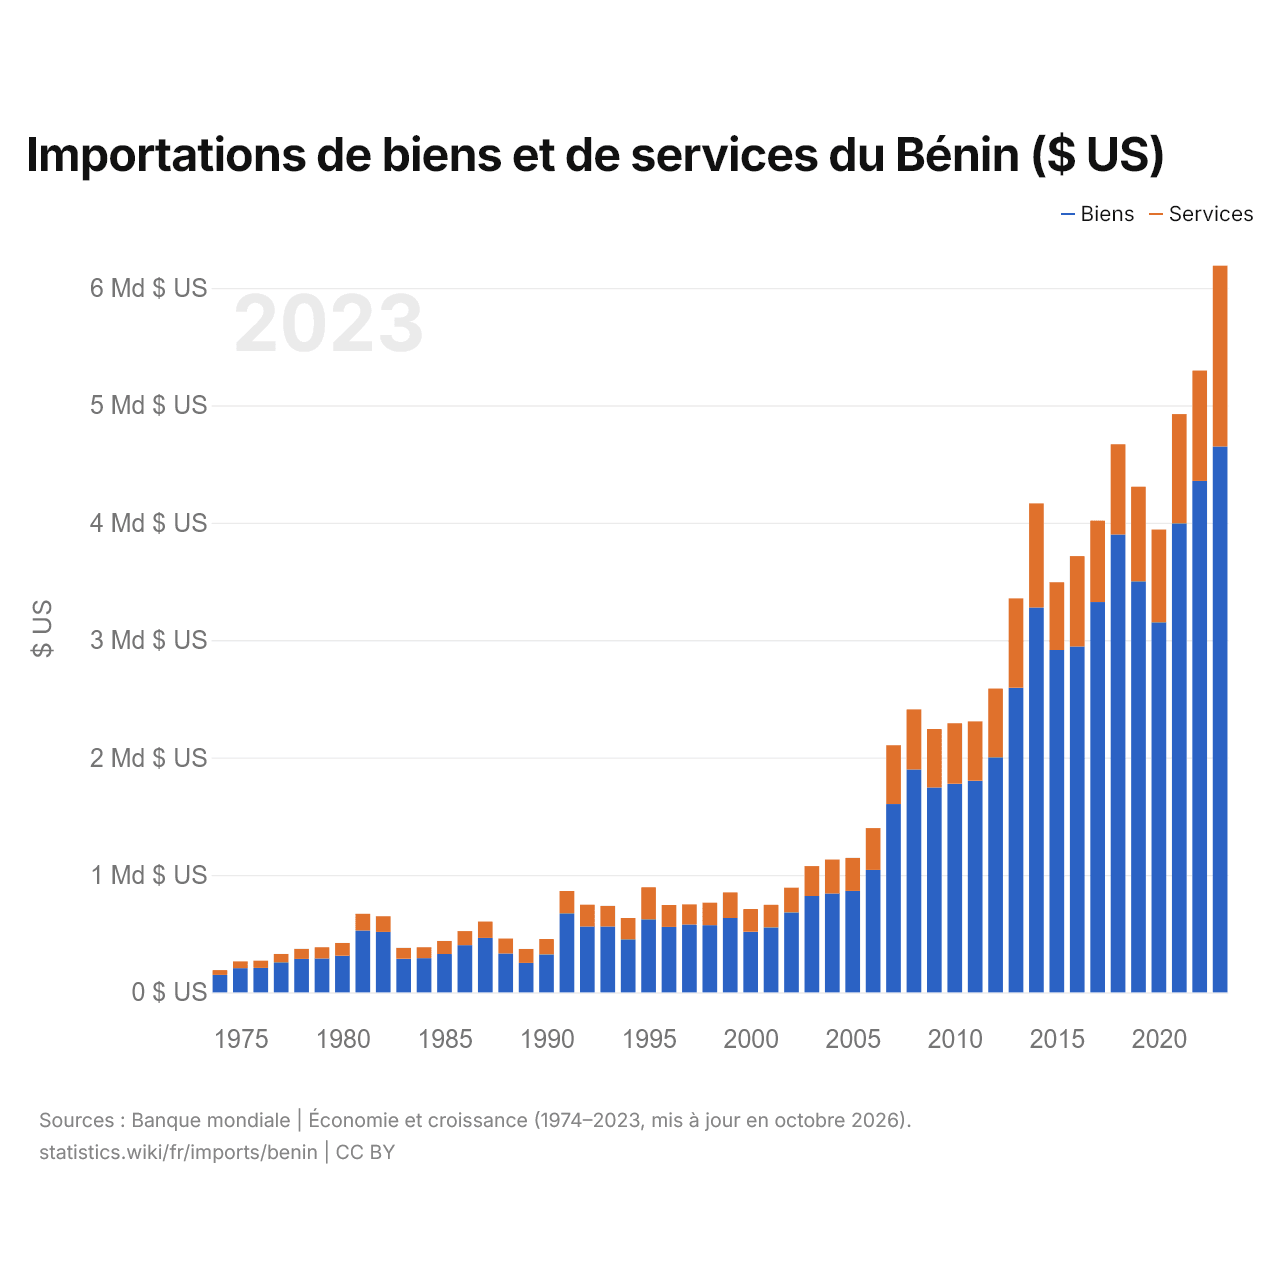
Importations de biens et de services du Bénin ($ US)
| Année | $ US | |
|---|---|---|
| Biens | Services | |
| 2023 | 4 648 937 885 $ US | 1 540 431 081 $ US |
| 2022 | 4 355 758 555 $ US | 939 928 688 $ US |
| 2021 | 3 994 489 087 $ US | 930 930 238 $ US |
| 2020 | 3 152 060 630 $ US | 789 857 470 $ US |
| 2019 | 3 500 936 737 $ US | 805 664 518 $ US |
| 2018 | 3 899 915 261 $ US | 768 750 531 $ US |
| 2017 | 3 324 208 323 $ US | 693 637 128 $ US |
| 2016 | 2 946 203 943 $ US | 769 508 817 $ US |
| 2015 | 2 916 041 759 $ US | 577 250 926 $ US |
| 2014 | 3 278 021 818 $ US | 886 562 029 $ US |
| 2013 | 2 594 443 523 $ US | 761 202 564 $ US |
| 2012 | 2 001 978 084 $ US | 585 120 539 $ US |
| 2011 | 1 802 712 674 $ US | 504 534 713 $ US |
| 2010 | 1 776 908 237 $ US | 515 197 971 $ US |
| 2009 | 1 744 766 053 $ US | 497 884 913 $ US |
| 2008 | 1 897 358 568 $ US | 512 087 396 $ US |
| 2007 | 1 603 710 667 $ US | 501 402 201 $ US |
| 2006 | 1 042 891 034 $ US | 356 307 178 $ US |
| 2005 | 863 706 927 $ US | 281 344 044 $ US |
| 2004 | 841 241 050 $ US | 289 954 433 $ US |
| 2003 | 820 366 945 $ US | 254 710 563 $ US |
| 2002 | 681 154 362 $ US | 210 738 378 $ US |
| 2001 | 553 311 369 $ US | 192 261 665 $ US |
| 2000 | 516 053 905 $ US | 193 446 152 $ US |
| 1999 | 633 010 350 $ US | 217 786 847 $ US |
| 1998 | 572 394 753 $ US | 191 617 357 $ US |
| 1997 | 576 868 371 $ US | 172 349 287 $ US |
| 1996 | 557 799 715 $ US | 185 879 285 $ US |
| 1995 | 622 454 733 $ US | 272 241 267 $ US |
| 1994 | 451 503 566 $ US | 181 404 265 $ US |
| 1993 | 561 358 073 $ US | 175 089 520 $ US |
| 1992 | 560 537 952 $ US | 186 164 059 $ US |
| 1991 | 673 368 833 $ US | 189 582 028 $ US |
| 1990 | 323 369 029 $ US | 130 585 010 $ US |
| 1989 | 250 570 283 $ US | 119 054 896 $ US |
| 1988 | 331 351 990 $ US | 126 553 720 $ US |
| 1987 | 463 171 598 $ US | 139 417 313 $ US |
| 1986 | 402 245 525 $ US | 119 258 724 $ US |
| 1985 | 326 312 232 $ US | 111 293 394 $ US |
| 1984 | 290 875 526 $ US | 93 846 835 $ US |
| 1983 | 286 341 447 $ US | 92 443 295 $ US |
| 1982 | 514 460 692 $ US | 133 673 658 $ US |
| 1981 | 526 799 525 $ US | 142 666 591 $ US |
| 1980 | 312 240 339 $ US | 108 590 725 $ US |
| 1979 | 288 959 782 $ US | 94 912 768 $ US |
| 1978 | 284 765 483 $ US | 85 493 016 $ US |
| 1977 | 255 511 560 $ US | 71 267 593 $ US |
| 1976 | 208 570 399 $ US | 60 974 973 $ US |
| 1975 | 205 633 912 $ US | 57 882 657 $ US |
| 1974 | 148 264 678 $ US | 40 634 858 $ US |
Les importations de biens du Bénin s'élèvent à 4,65 milliards de dollars (2023) et celles de services à 1,54 milliard de dollars ; les services représentent 24,9 % du total, contre 21,5 % en 1974.
Le Bénin dans le classement mondial des importations, 2025







Importations de biens et services du Bénin, % du PIB, 1960–2025
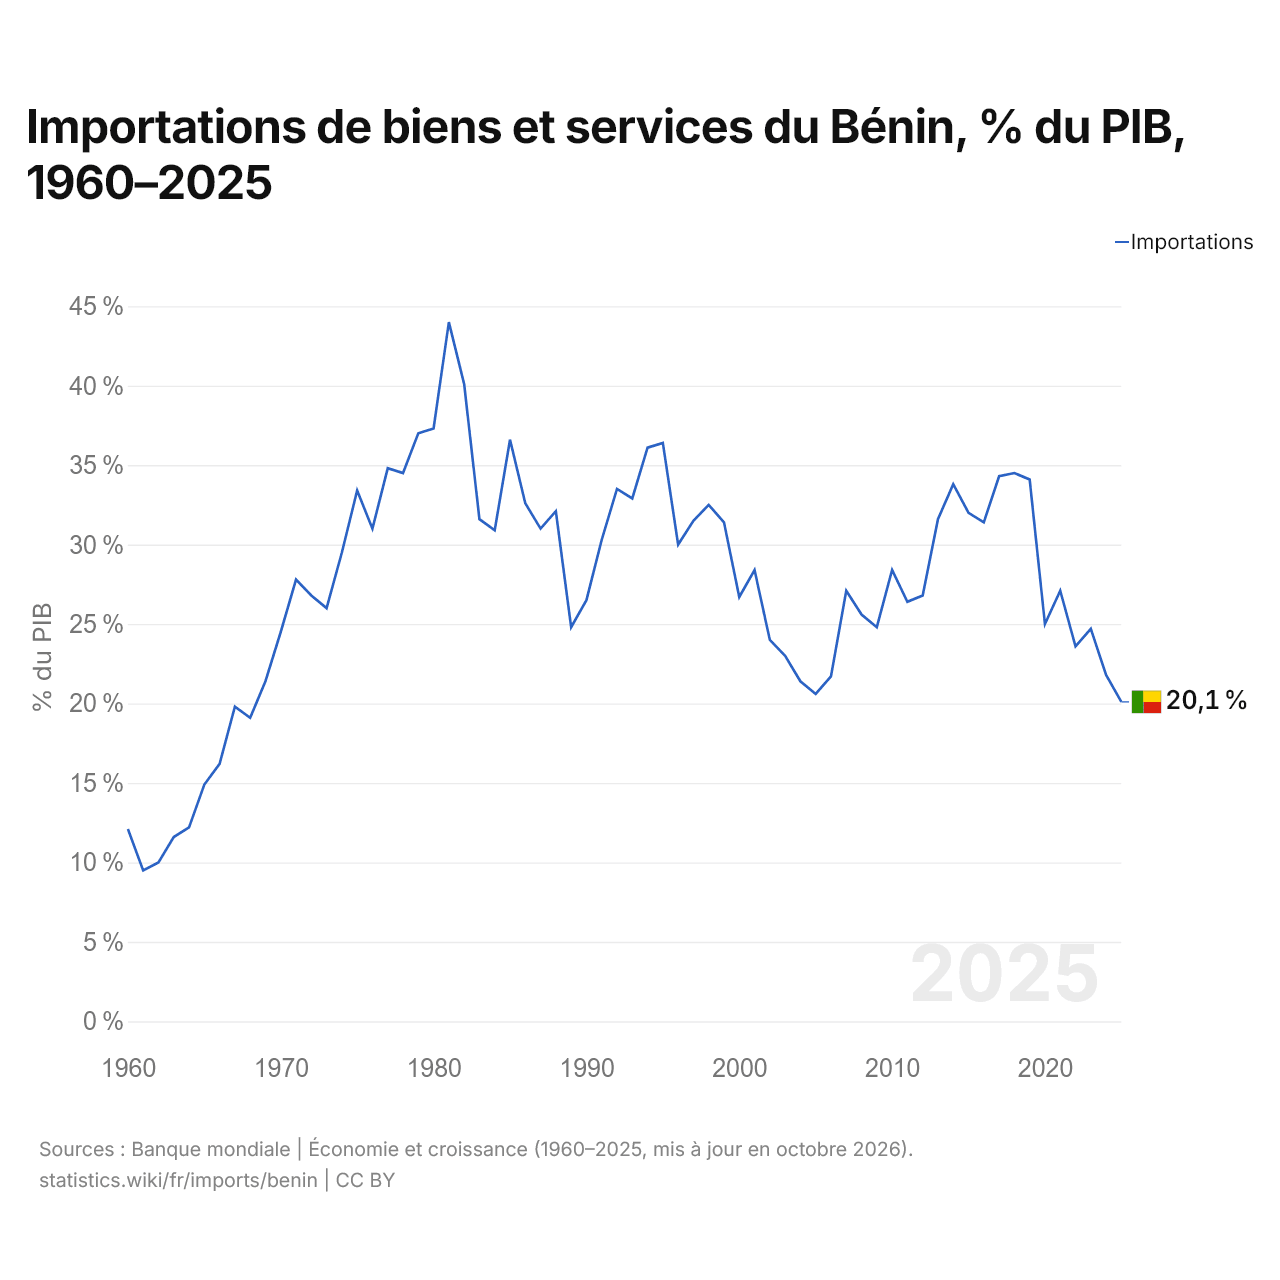
En 2025, les importations de biens et services du Bénin équivalaient à 20,1 % de son PIB, contre 12,1 % en 1960. La part la plus élevée a été de 44,0 %, en 1981.
Comparer les importations du Bénin avec celles d'autres pays
Sources :
- Banque mondiale | Économie et croissance (1960–2025, mis à jour en octobre 2026)
- TradeMap (2001–2025, mis à jour en octobre 2026)
Creative Commons Attribution (CC BY) : vous pouvez copier, partager, adapter et réutiliser ce contenu, y compris à des fins commerciales, à condition de citer statistics.wiki et d’indiquer les modifications apportées. Les sources citées ci-dessus peuvent avoir leurs propres conditions de licence.