
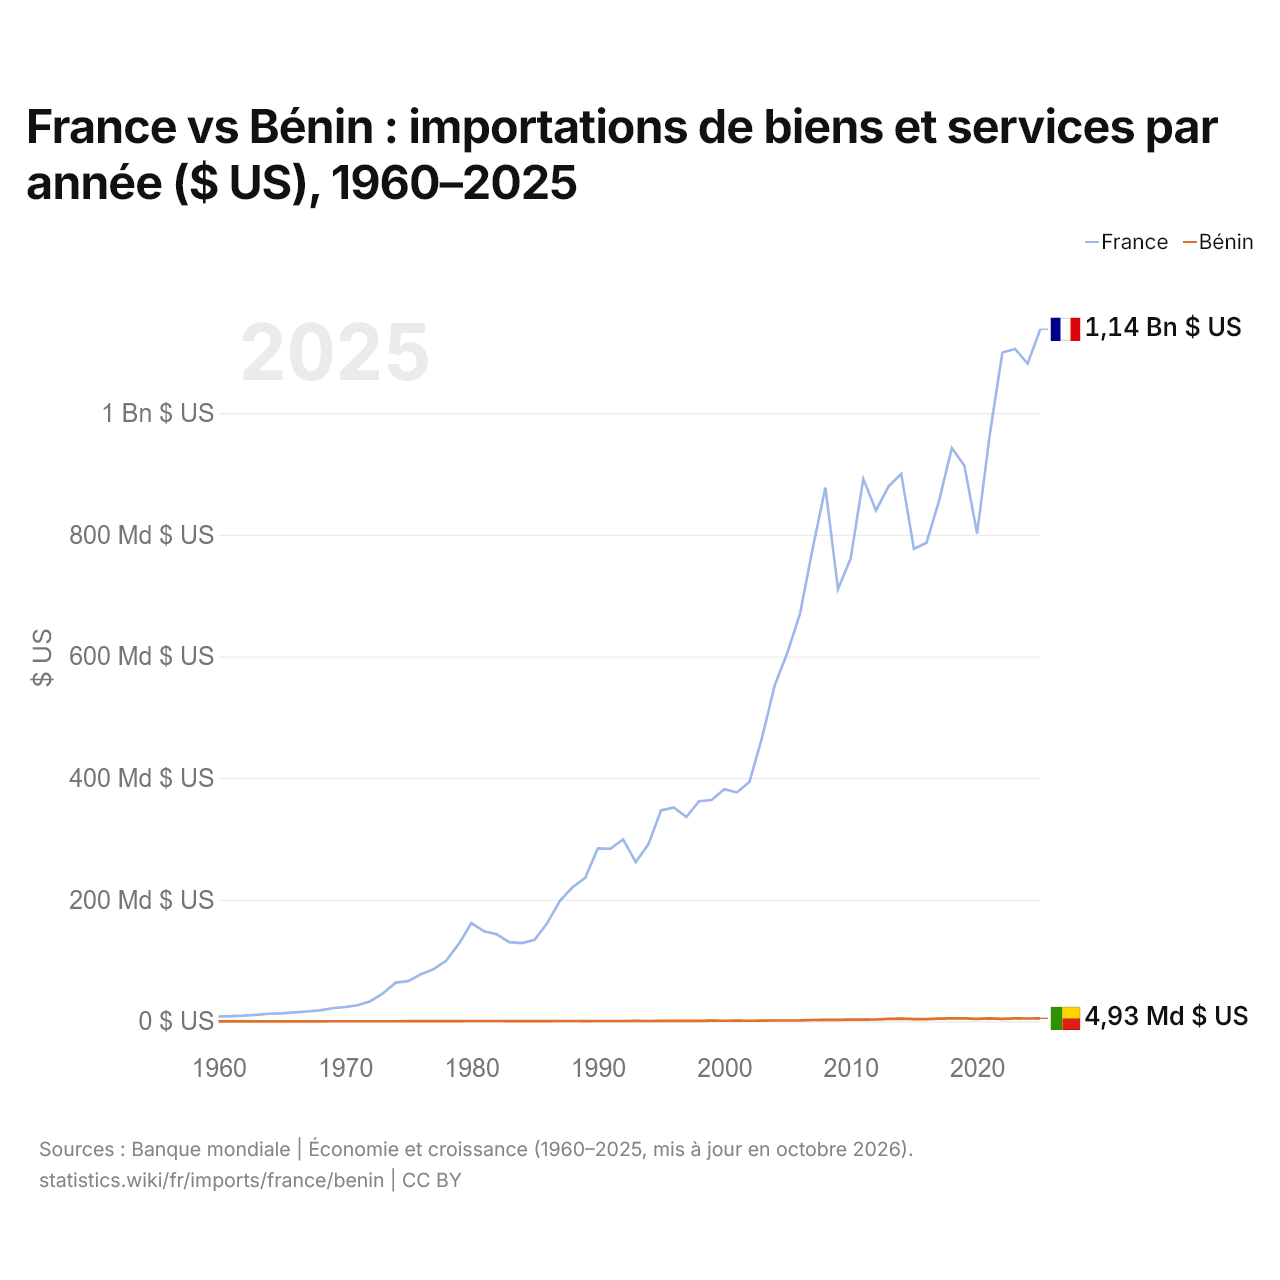
France vs Bénin : importations de biens et services par année ($ US), 1960–2025
| Année | $ US | |
|---|---|---|
 France |
 Bénin |
|
| 2025 | 1 137 799 795 607 $ US | 4 929 128 052 $ US |
| 2024 | 1 081 453 951 069 $ US | 4 683 140 134 $ US |
| 2023 | 1 105 442 442 028 $ US | 4 851 357 176 $ US |
| 2022 | 1 099 664 152 806 $ US | 4 106 516 765 $ US |
| 2021 | 964 103 785 592 $ US | 4 799 723 189 $ US |
| 2020 | 801 836 174 373 $ US | 3 915 530 456 $ US |
| 2019 | 913 209 092 424 $ US | 4 900 485 060 $ US |
| 2018 | 942 517 078 079 $ US | 4 923 520 744 $ US |
| 2017 | 856 501 561 408 $ US | 4 352 984 748 $ US |
| 2016 | 786 690 099 965 $ US | 3 709 467 046 $ US |
| 2015 | 776 983 112 153 $ US | 3 648 295 538 $ US |
| 2014 | 900 072 034 980 $ US | 4 495 143 318 $ US |
| 2013 | 879 403 265 970 $ US | 3 959 347 660 $ US |
| 2012 | 839 869 181 340 $ US | 2 990 340 509 $ US |
| 2011 | 891 743 744 380 $ US | 2 819 548 391 $ US |
| 2010 | 761 083 995 458 $ US | 2 704 110 555 $ US |
| 2009 | 710 610 400 819 $ US | 2 412 711 825 $ US |
| 2008 | 877 476 980 121 $ US | 2 509 050 412 $ US |
| 2007 | 777 995 714 258 $ US | 2 211 437 454 $ US |
| 2006 | 670 822 254 333 $ US | 1 527 581 987 $ US |
| 2005 | 606 331 902 820 $ US | 1 353 744 165 $ US |
| 2004 | 553 011 604 110 $ US | 1 324 063 350 $ US |
| 2003 | 467 250 572 393 $ US | 1 228 828 002 $ US |
| 2002 | 394 028 136 002 $ US | 1 008 395 973 $ US |
| 2001 | 376 341 467 532 $ US | 1 040 788 979 $ US |
| 2000 | 381 449 581 352 $ US | 941 345 994 $ US |
| 1999 | 363 754 404 232 $ US | 1 154 049 286 $ US |
| 1998 | 361 782 299 311 $ US | 797 921 959 $ US |
| 1997 | 335 869 521 241 $ US | 715 320 153 $ US |
| 1996 | 351 587 382 998 $ US | 708 783 072 $ US |
| 1995 | 346 832 698 121 $ US | 790 421 148 $ US |
| 1994 | 291 034 380 907 $ US | 576 481 297 $ US |
| 1993 | 261 684 618 948 $ US | 748 725 748 $ US |
| 1992 | 299 027 013 631 $ US | 567 957 714 $ US |
| 1991 | 283 762 818 277 $ US | 602 729 540 $ US |
| 1990 | 284 198 409 830 $ US | 520 152 830 $ US |
| 1989 | 235 996 092 947 $ US | 372 643 204 $ US |
| 1988 | 220 384 539 148 $ US | 519 824 990 $ US |
| 1987 | 198 155 407 618 $ US | 483 576 070 $ US |
| 1986 | 161 558 386 211 $ US | 435 776 313 $ US |
| 1985 | 133 894 510 147 $ US | 383 239 093 $ US |
| 1984 | 128 606 695 189 $ US | 325 136 017 $ US |
| 1983 | 130 312 075 049 $ US | 345 886 017 $ US |
| 1982 | 143 140 932 229 $ US | 508 205 555 $ US |
| 1981 | 148 003 379 602 $ US | 567 561 866 $ US |
| 1980 | 161 433 405 775 $ US | 524 469 594 $ US |
| 1979 | 127 256 552 575 $ US | 439 163 941 $ US |
| 1978 | 99 531 104 651 $ US | 320 872 362 $ US |
| 1977 | 85 644 958 545 $ US | 260 873 185 $ US |
| 1976 | 77 268 779 022 $ US | 216 705 687 $ US |
| 1975 | 66 145 785 529 $ US | 226 162 498 $ US |
| 1974 | 63 613 611 566 $ US | 163 593 501 $ US |
| 1973 | 45 888 332 351 $ US | 130 886 433 $ US |
| 1972 | 33 141 612 484 $ US | 109 969 551 $ US |
| 1971 | 26 488 930 981 $ US | 93 259 583 $ US |
| 1970 | 23 582 378 647 $ US | 81 609 755 $ US |
| 1969 | 21 479 310 052 $ US | 70 874 407 $ US |
| 1968 | 17 932 241 725 $ US | 62 251 310 $ US |
| 1967 | 16 105 495 991 $ US | 60 547 020 $ US |
| 1966 | 14 747 626 953 $ US | 49 061 962 $ US |
| 1965 | 12 990 103 310 $ US | 43 212 949 $ US |
| 1964 | 12 529 464 175 $ US | 33 034 387 $ US |
| 1963 | 10 693 152 241 $ US | 29 521 377 $ US |
| 1962 | 9 325 584 138 $ US | 23 547 277 $ US |
| 1961 | 8 539 959 909 $ US | 22 470 098 $ US |
| 1960 | 7 955 890 214 $ US | 27 392 931 $ US |
En 2025, les importations de biens et services de la France s'élevaient à 1,14 billion de dollars et celles du Bénin à 4,93 milliards de dollars : celles de la France étaient 230 fois plus élevées. En 1960, les importations de la France étaient 290 fois plus élevées : 7,96 milliards de dollars pour la France et 27,4 millions de dollars pour le Bénin.
Les importations de biens et services de la France sont supérieures à celles du Bénin chaque année depuis 1960.
France vs Bénin : chiffres des importations
|
France
|
Bénin
|
|
|---|---|---|
| Importations | 1,14 Bn $US (2025) | 4,93 Md $US (2025) |
| Rang mondial | 5/174 | 140/174 |
| Part mondiale | 3,37 % | 0,01 % |
| % du PIB | 33,8 % | 20,1 % |
| Première catégorie de biens | Machines, électronique et véhicules (38 %, 2025) | Cultures, plantes et fleurs (céréales, fruits, légumes, café, oléagineux) (24,8 %, 2025) |
| Première origine des biens | Allemagne (12,6 %, 2025) | Inde (22,5 %, 2025) |
Comparer les importations de 2 pays au choix
Sources :
- Banque mondiale | Économie et croissance (1960–2025, mis à jour en octobre 2026)
- TradeMap (2001–2025, mis à jour en octobre 2026)
Creative Commons Attribution (CC BY) : vous pouvez copier, partager, adapter et réutiliser ce contenu, y compris à des fins commerciales, à condition de citer statistics.wiki et d’indiquer les modifications apportées. Les sources citées ci-dessus peuvent avoir leurs propres conditions de licence.