
Togo vs Bénin : importations de biens et services par année ($ US), 1960–2025
| Année | $ US | |
|---|---|---|
 Togo |
 Bénin |
|
| 2025 | - | 4 929 128 052 $ US |
| 2024 | 4 054 200 385 $ US | 4 683 140 134 $ US |
| 2023 | 3 436 907 297 $ US | 4 851 357 176 $ US |
| 2022 | 3 161 651 830 $ US | 4 106 516 765 $ US |
| 2021 | 2 839 529 121 $ US | 4 799 723 189 $ US |
| 2020 | 2 395 207 646 $ US | 3 915 530 456 $ US |
| 2019 | 2 268 030 418 $ US | 4 900 485 060 $ US |
| 2018 | 2 336 770 685 $ US | 4 923 520 744 $ US |
| 2017 | 2 101 895 827 $ US | 4 352 984 748 $ US |
| 2016 | 2 411 075 703 $ US | 3 709 467 046 $ US |
| 2015 | 2 441 321 789 $ US | 3 648 295 538 $ US |
| 2014 | 2 670 919 336 $ US | 4 495 143 318 $ US |
| 2013 | 2 892 638 363 $ US | 3 959 347 660 $ US |
| 2012 | 2 312 882 854 $ US | 2 990 340 509 $ US |
| 2011 | 2 507 209 432 $ US | 2 819 548 391 $ US |
| 2010 | 1 854 510 188 $ US | 2 704 110 555 $ US |
| 2009 | 1 716 360 384 $ US | 2 412 711 825 $ US |
| 2008 | 1 693 309 261 $ US | 2 509 050 412 $ US |
| 2007 | 1 396 901 169 $ US | 2 211 437 454 $ US |
| 2006 | 1 214 295 355 $ US | 1 527 581 987 $ US |
| 2005 | 1 168 639 790 $ US | 1 353 744 165 $ US |
| 2004 | 1 094 601 313 $ US | 1 324 063 350 $ US |
| 2003 | 960 946 956 $ US | 1 228 828 002 $ US |
| 2002 | 727 191 364 $ US | 1 008 395 973 $ US |
| 2001 | 646 569 240 $ US | 1 040 788 979 $ US |
| 2000 | 603 640 477 $ US | 941 345 994 $ US |
| 1999 | 640 566 114 $ US | 1 154 049 286 $ US |
| 1998 | 732 267 660 $ US | 797 921 959 $ US |
| 1997 | 650 425 459 $ US | 715 320 153 $ US |
| 1996 | 713 174 632 $ US | 708 783 072 $ US |
| 1995 | 607 330 077 $ US | 790 421 148 $ US |
| 1994 | 440 495 843 $ US | 576 481 297 $ US |
| 1993 | 439 633 299 $ US | 748 725 748 $ US |
| 1992 | 685 717 468 $ US | 567 957 714 $ US |
| 1991 | 773 548 332 $ US | 602 729 540 $ US |
| 1990 | 770 924 274 $ US | 520 152 830 $ US |
| 1989 | 939 823 755 $ US | 372 643 204 $ US |
| 1988 | 992 268 271 $ US | 519 824 990 $ US |
| 1987 | 895 615 928 $ US | 483 576 070 $ US |
| 1986 | 834 337 849 $ US | 435 776 313 $ US |
| 1985 | 615 157 678 $ US | 383 239 093 $ US |
| 1984 | 527 122 812 $ US | 325 136 017 $ US |
| 1983 | 562 466 530 $ US | 345 886 017 $ US |
| 1982 | 764 523 144 $ US | 508 205 555 $ US |
| 1981 | 757 473 026 $ US | 567 561 866 $ US |
| 1980 | 985 520 656 $ US | 524 469 594 $ US |
| 1979 | 769 349 354 $ US | 439 163 941 $ US |
| 1978 | 759 576 051 $ US | 320 872 362 $ US |
| 1977 | 498 214 852 $ US | 260 873 185 $ US |
| 1976 | 365 145 882 $ US | 216 705 687 $ US |
| 1975 | 398 858 808 $ US | 226 162 498 $ US |
| 1974 | 194 986 227 $ US | 163 593 501 $ US |
| 1973 | 156 842 537 $ US | 130 886 433 $ US |
| 1972 | 145 568 282 $ US | 109 969 551 $ US |
| 1971 | 136 365 018 $ US | 93 259 583 $ US |
| 1970 | 109 497 686 $ US | 81 609 755 $ US |
| 1969 | 101 041 777 $ US | 70 874 407 $ US |
| 1968 | 82 142 881 $ US | 62 251 310 $ US |
| 1967 | 74 628 175 $ US | 60 547 020 $ US |
| 1966 | 78 749 869 $ US | 49 061 962 $ US |
| 1965 | 71 750 919 $ US | 43 212 949 $ US |
| 1964 | 72 692 943 $ US | 33 034 387 $ US |
| 1963 | 53 698 470 $ US | 29 521 377 $ US |
| 1962 | - | 23 547 277 $ US |
| 1961 | - | 22 470 098 $ US |
| 1960 | - | 27 392 931 $ US |
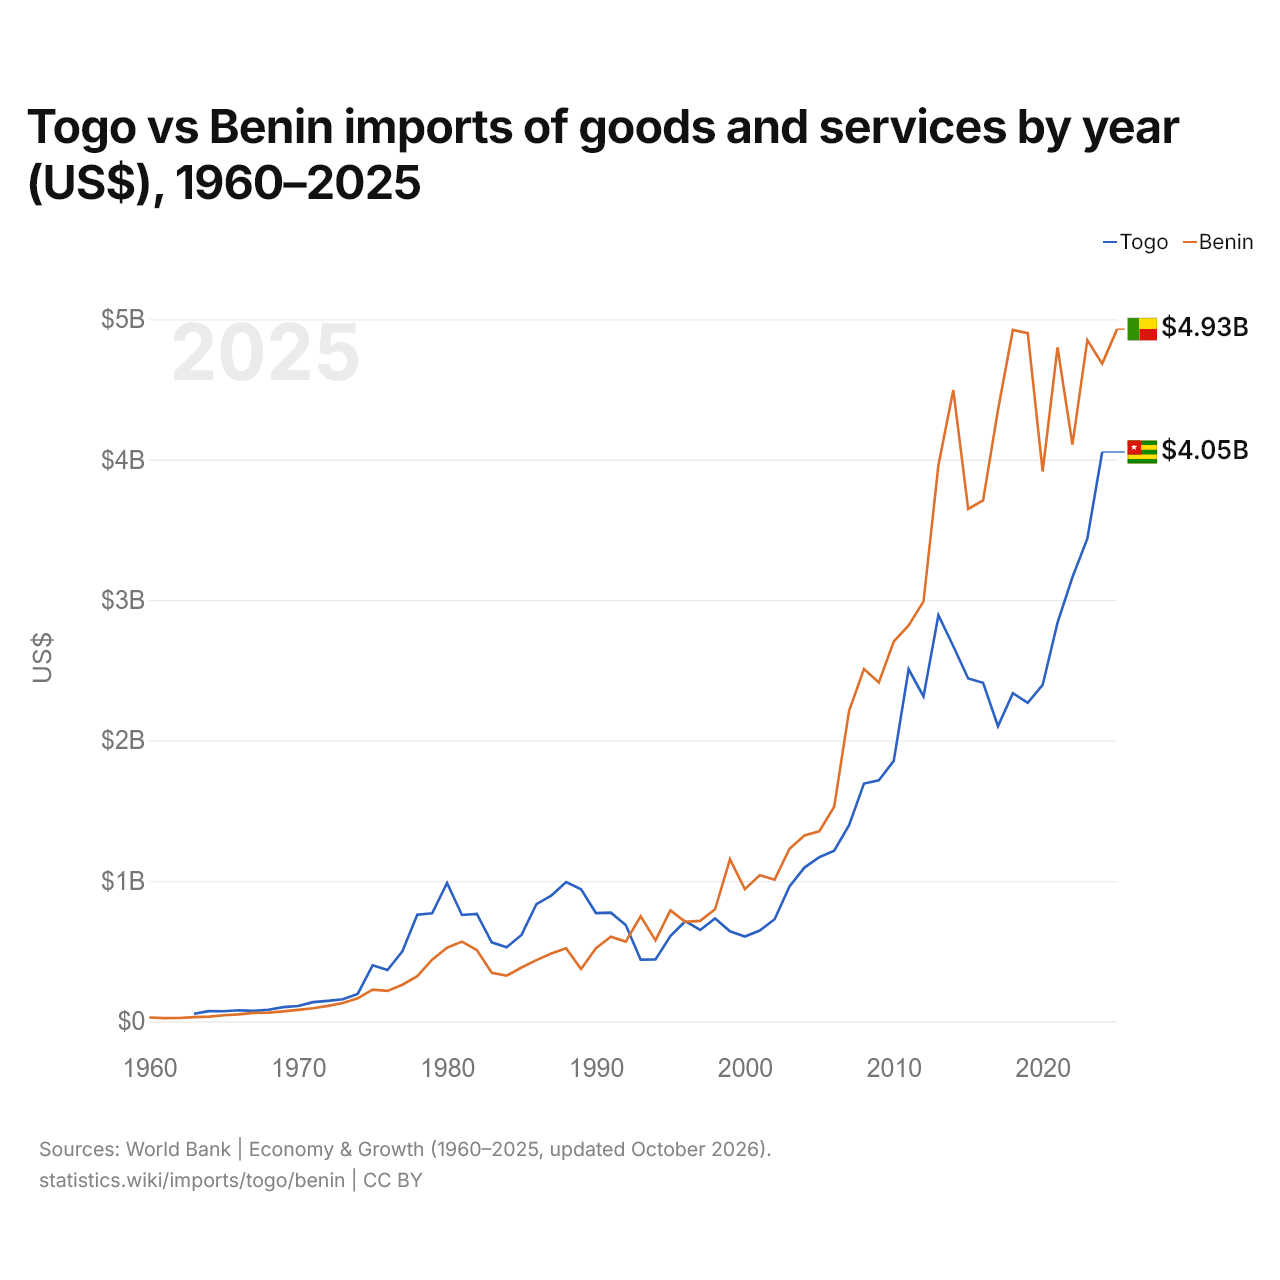
Les importations de biens et services du Togo s'élevaient à 4,05 milliards de dollars (2024) et celles du Bénin à 4,68 milliards de dollars (2024) : celles du Bénin étaient supérieures de 16 %. En 1963, les importations du Togo étaient 1,8 fois plus élevées : 53,7 millions de dollars pour le Togo et 29,5 millions de dollars pour le Bénin.
Les importations de biens et services du Bénin sont supérieures à celles du Togo chaque année depuis 1997.
Togo vs Bénin : chiffres des importations
|
Togo
|
Bénin
|
|
|---|---|---|
| Importations | 4,05 Md $US (2024) | 4,93 Md $US (2025) |
| Rang mondial | 144/174 | 140/174 |
| Part mondiale | 0,01 % | 0,01 % |
| % du PIB | 38,1 % | 20,1 % |
| Première catégorie de biens | Machines, électronique et véhicules (28 %, 2025) | Cultures, plantes et fleurs (céréales, fruits, légumes, café, oléagineux) (24,8 %, 2025) |
| Première origine des biens | Chine (26,6 %, 2025) | Inde (22,5 %, 2025) |
Comparer les importations de 2 pays au choix
Sources :
- Banque mondiale | Économie et croissance (1960–2025, mis à jour en octobre 2026)
- TradeMap (2001–2025, mis à jour en octobre 2026)
Creative Commons Attribution (CC BY) : vous pouvez copier, partager, adapter et réutiliser ce contenu, y compris à des fins commerciales, à condition de citer statistics.wiki et d’indiquer les modifications apportées. Les sources citées ci-dessus peuvent avoir leurs propres conditions de licence.