
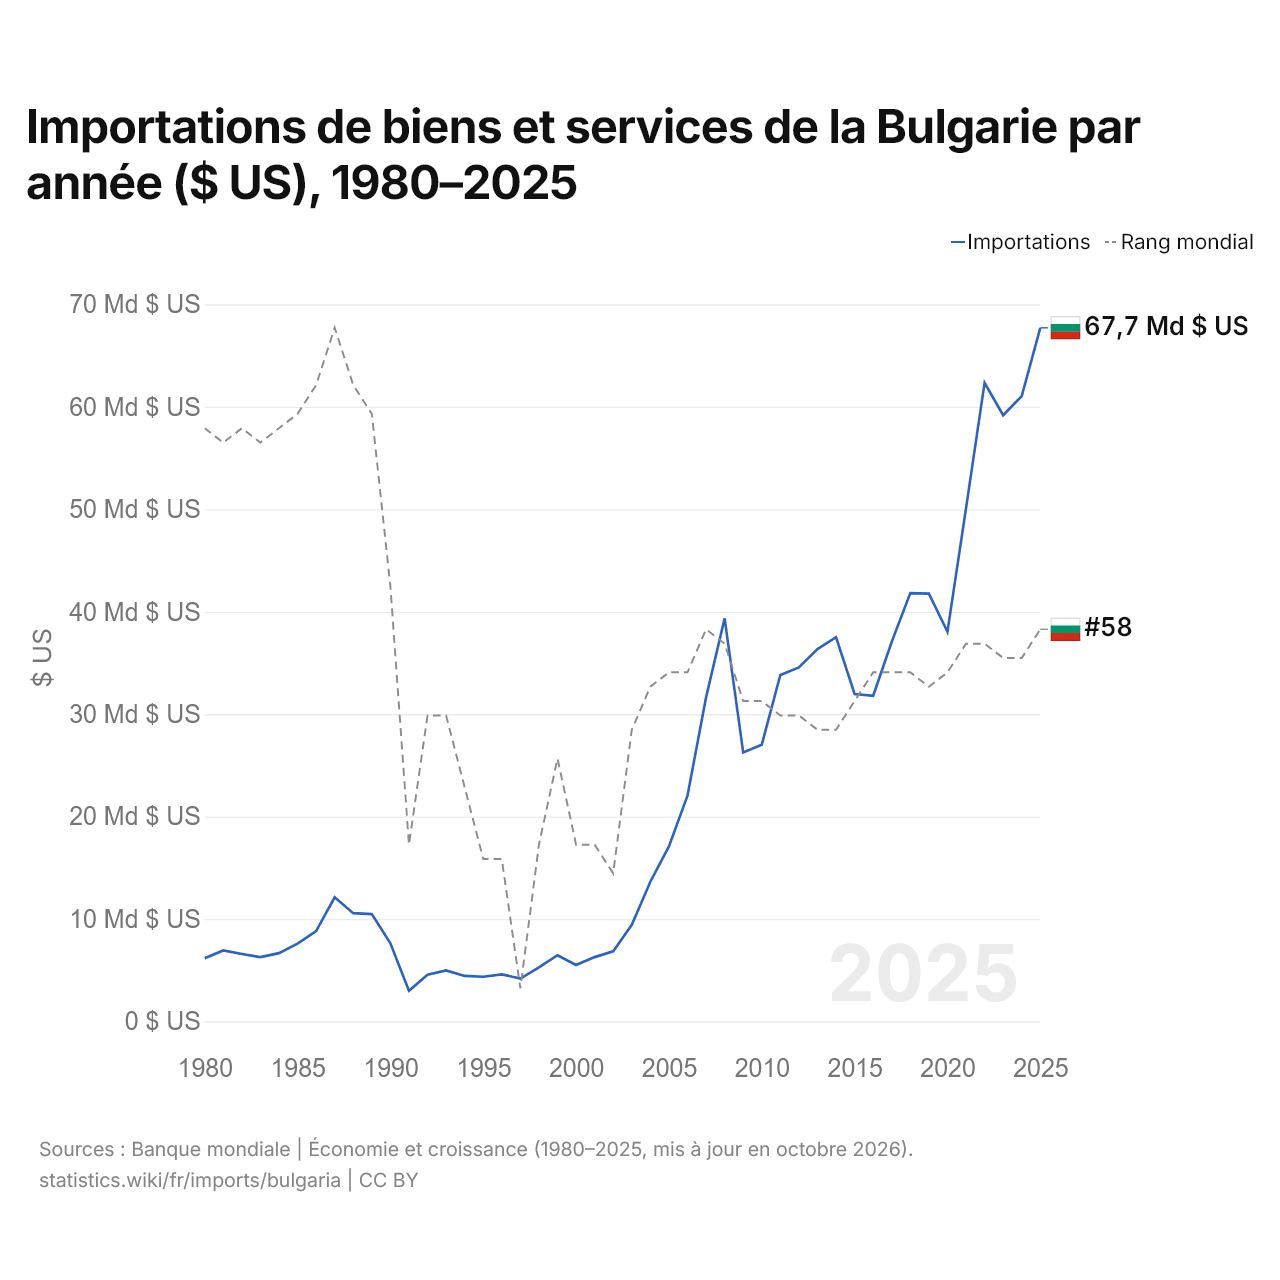
Importations de biens et services de la Bulgarie par année ($ US), 1980–2025
| Année | $ US | Rang mondial |
|---|---|---|
| Importations | Rang mondial | |
| 2025 | 67 710 937 458 $ US | #58 |
| 2024 | 61 045 719 079 $ US | #60 |
| 2023 | 59 170 791 456 $ US | #60 |
| 2022 | 62 330 614 856 $ US | #59 |
| 2021 | 50 091 113 311 $ US | #59 |
| 2020 | 38 028 750 956 $ US | #61 |
| 2019 | 41 764 330 853 $ US | #62 |
| 2018 | 41 807 171 882 $ US | #61 |
| 2017 | 37 066 822 041 $ US | #61 |
| 2016 | 31 790 083 605 $ US | #61 |
| 2015 | 31 958 895 177 $ US | #63 |
| 2014 | 37 502 678 291 $ US | #65 |
| 2013 | 36 353 430 968 $ US | #65 |
| 2012 | 34 548 290 470 $ US | #64 |
| 2011 | 33 820 213 314 $ US | #64 |
| 2010 | 27 009 762 883 $ US | #63 |
| 2009 | 26 259 726 919 $ US | #63 |
| 2008 | 39 343 107 071 $ US | #59 |
| 2007 | 31 626 685 276 $ US | #58 |
| 2006 | 22 028 593 152 $ US | #61 |
| 2005 | 17 081 160 934 $ US | #61 |
| 2004 | 13 630 779 782 $ US | #62 |
| 2003 | 9 430 486 363 $ US | #65 |
| 2002 | 6 827 674 436 $ US | #75 |
| 2001 | 6 269 411 766 $ US | #73 |
| 2000 | 5 500 922 374 $ US | #73 |
| 1999 | 6 454 110 049 $ US | #67 |
| 1998 | 5 276 749 273 $ US | #73 |
| 1997 | 4 174 456 098 $ US | #83 |
| 1996 | 4 589 177 002 $ US | #74 |
| 1995 | 4 353 677 534 $ US | #74 |
| 1994 | 4 434 462 644 $ US | #69 |
| 1993 | 4 964 818 636 $ US | #64 |
| 1992 | 4 554 255 739 $ US | #64 |
| 1991 | 2 990 743 200 $ US | #73 |
| 1990 | 7 612 050 672 $ US | #55 |
| 1989 | 10 472 822 408 $ US | #43 |
| 1988 | 10 557 563 242 $ US | #41 |
| 1987 | 12 117 632 822 $ US | #37 |
| 1986 | 8 808 016 665 $ US | #41 |
| 1985 | 7 587 659 599 $ US | #43 |
| 1984 | 6 659 194 204 $ US | #44 |
| 1983 | 6 264 983 781 $ US | #45 |
| 1982 | 6 578 066 374 $ US | #44 |
| 1981 | 6 924 020 230 $ US | #45 |
| 1980 | 6 150 465 274 $ US | #44 |
En 2025, les importations de biens et services de la Bulgarie s'élevaient à 67,7 milliards de dollars, contre 6,15 milliards de dollars en 1980. Le minimum a été de 2,99 milliards de dollars, en 1991. Elles se classaient au 58e rang mondial, en hausse par rapport au 60e rang en 2024. Leur meilleur rang a été le 37e, occupé pour la dernière fois en 1987.
En 2025, les importations de biens et services de la Bulgarie étaient les 25es plus élevées de 41 pays situés en Europe. En 2025, les importations de la Bulgarie dépassaient ses exportations de 1,36 milliard de dollars, soit un déficit commercial. Le commerce de la Bulgarie, exportations et importations réunies, équivalait à 102,5 % de son PIB en 2025, au 56e rang mondial.
Importations de biens de la Bulgarie par catégorie, 2025
Importations de biens, 2025: 59,3 Md $US
En 2025, la première catégorie des importations de biens de la Bulgarie était « machines, électronique et véhicules », avec 31,2 %, suivie de « pétrole, gaz, minerais et autres matières premières », avec 21,0 %.
Origines des importations de biens de la Bulgarie : les 10 premières, 2025
| Rang | Pays | Importations de biens | Part | |
|---|---|---|---|---|
| 1 |
 Allemagne |
6,53 Md $US | 11 % | |
| 2 |
 Turquie |
4,95 Md $US | 8,34 % | vs Turquie |
| 3 |
 Chine |
4,55 Md $US | 7,67 % | |
| 4 |
 Roumanie |
4,52 Md $US | 7,61 % | vs Roumanie |
| 5 |
 Grèce |
3,17 Md $US | 5,34 % | vs Grèce |
| 6 |
 Italie |
2,90 Md $US | 4,88 % | |
| 7 |
 Pologne |
2,18 Md $US | 3,68 % | vs Pologne |
| 8 |
 Pays-Bas |
2,14 Md $US | 3,61 % | |
| 9 |
 Hongrie |
2,02 Md $US | 3,41 % | vs Hongrie |
| 10 |
 Tchéquie |
1,45 Md $US | 2,44 % | |
| Autres partenaires et non précisés | 24,9 Md $US | 42 % |
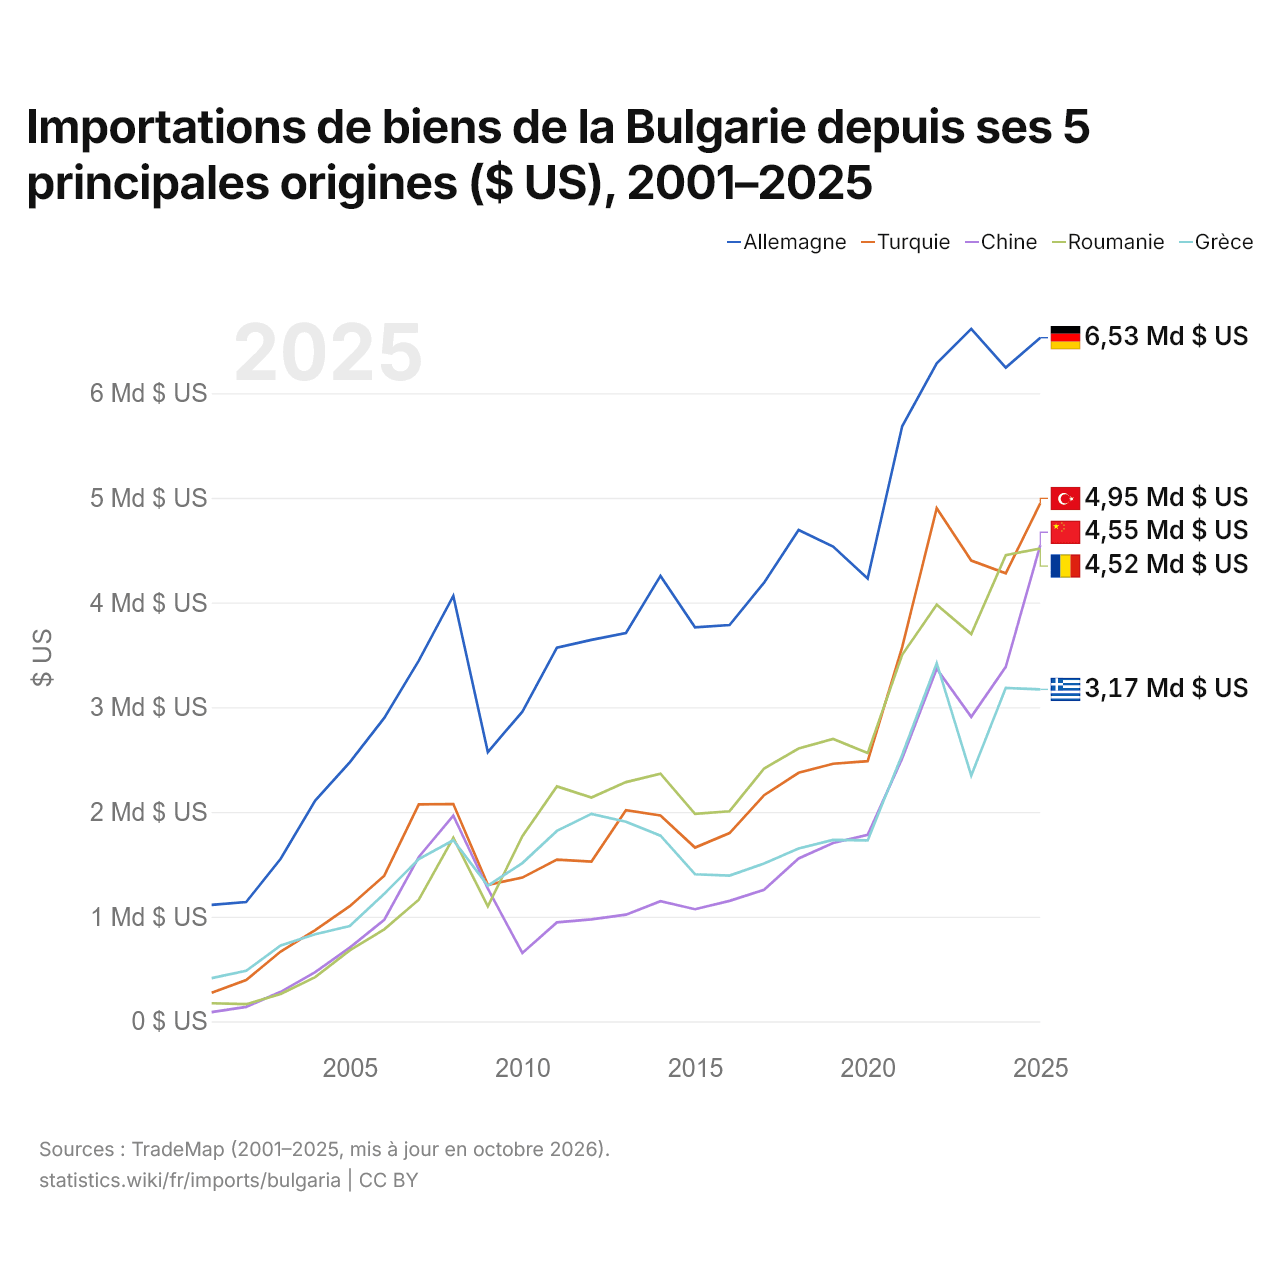
Importations de biens de la Bulgarie depuis ses 5 principales origines ($ US), 2001–2025
| Année | $ US | ||||
|---|---|---|---|---|---|
| Allemagne | Turquie | Chine | Roumanie | Grèce | |
| 2025 | 6 529 738 000 $ US | 4 948 203 000 $ US | 4 549 285 000 $ US | 4 516 585 000 $ US | 3 170 173 000 $ US |
| 2024 | 6 243 856 000 $ US | 4 279 163 000 $ US | 3 385 282 000 $ US | 4 452 919 000 $ US | 3 183 831 000 $ US |
| 2023 | 6 614 228 000 $ US | 4 400 860 000 $ US | 2 907 796 000 $ US | 3 698 052 000 $ US | 2 347 714 000 $ US |
| 2022 | 6 285 064 000 $ US | 4 901 271 000 $ US | 3 368 574 000 $ US | 3 979 252 000 $ US | 3 420 529 000 $ US |
| 2021 | 5 683 159 000 $ US | 3 573 506 000 $ US | 2 510 233 000 $ US | 3 500 397 000 $ US | 2 547 176 000 $ US |
| 2020 | 4 229 357 000 $ US | 2 484 665 000 $ US | 1 781 250 000 $ US | 2 562 009 000 $ US | 1 727 835 000 $ US |
| 2019 | 4 535 166 000 $ US | 2 460 725 000 $ US | 1 703 270 000 $ US | 2 696 764 000 $ US | 1 733 362 000 $ US |
| 2018 | 4 692 937 000 $ US | 2 373 748 000 $ US | 1 555 557 000 $ US | 2 605 573 000 $ US | 1 651 264 000 $ US |
| 2017 | 4 189 908 000 $ US | 2 159 917 000 $ US | 1 255 929 000 $ US | 2 414 893 000 $ US | 1 507 417 000 $ US |
| 2016 | 3 785 416 000 $ US | 1 798 149 000 $ US | 1 150 823 000 $ US | 2 006 951 000 $ US | 1 392 553 000 $ US |
| 2015 | 3 763 285 000 $ US | 1 659 509 000 $ US | 1 070 873 000 $ US | 1 980 838 000 $ US | 1 404 799 000 $ US |
| 2014 | 4 254 707 000 $ US | 1 966 461 000 $ US | 1 147 400 000 $ US | 2 365 901 000 $ US | 1 773 256 000 $ US |
| 2013 | 3 708 582 000 $ US | 2 016 959 000 $ US | 1 019 015 000 $ US | 2 284 820 000 $ US | 1 905 787 000 $ US |
| 2012 | 3 642 897 000 $ US | 1 525 572 000 $ US | 974 318 000 $ US | 2 137 844 000 $ US | 1 981 335 000 $ US |
| 2011 | 3 569 440 000 $ US | 1 544 664 000 $ US | 945 233 000 $ US | 2 243 947 000 $ US | 1 818 697 000 $ US |
| 2010 | 2 958 353 000 $ US | 1 373 005 000 $ US | 652 850 000 $ US | 1 768 908 000 $ US | 1 511 394 000 $ US |
| 2009 | 2 571 765 000 $ US | 1 303 269 000 $ US | 1 267 441 000 $ US | 1 097 357 000 $ US | 1 296 000 000 $ US |
| 2008 | 4 062 890 000 $ US | 2 075 875 000 $ US | 1 964 047 000 $ US | 1 752 893 000 $ US | 1 729 456 000 $ US |
| 2007 | 3 445 299 000 $ US | 2 072 260 000 $ US | 1 569 853 000 $ US | 1 161 549 000 $ US | 1 549 359 000 $ US |
| 2006 | 2 898 460 000 $ US | 1 391 253 000 $ US | 970 059 000 $ US | 878 957 000 $ US | 1 217 741 000 $ US |
| 2005 | 2 474 093 000 $ US | 1 099 423 000 $ US | 703 623 000 $ US | 677 738 000 $ US | 909 887 000 $ US |
| 2004 | 2 107 959 000 $ US | 870 431 000 $ US | 469 201 000 $ US | 421 716 000 $ US | 831 085 000 $ US |
| 2003 | 1 553 070 000 $ US | 666 560 000 $ US | 281 560 000 $ US | 261 830 000 $ US | 724 027 000 $ US |
| 2002 | 1 139 051 000 $ US | 393 848 000 $ US | 138 492 000 $ US | 163 731 000 $ US | 482 257 000 $ US |
| 2001 | 1 112 024 000 $ US | 273 726 000 $ US | 87 428 000 $ US | 172 764 000 $ US | 412 427 000 $ US |
En 2025, les importations de biens s'élevaient à 6,53 milliards de dollars en provenance de l'Allemagne, 4,95 milliards de dollars en provenance de la Turquie, 4,55 milliards de dollars en provenance de la Chine, 4,52 milliards de dollars en provenance de la Roumanie et 3,17 milliards de dollars en provenance de la Grèce. Le premier rang des cinq fournisseurs de la Bulgarie est occupé par l'Allemagne chaque année depuis 2001.
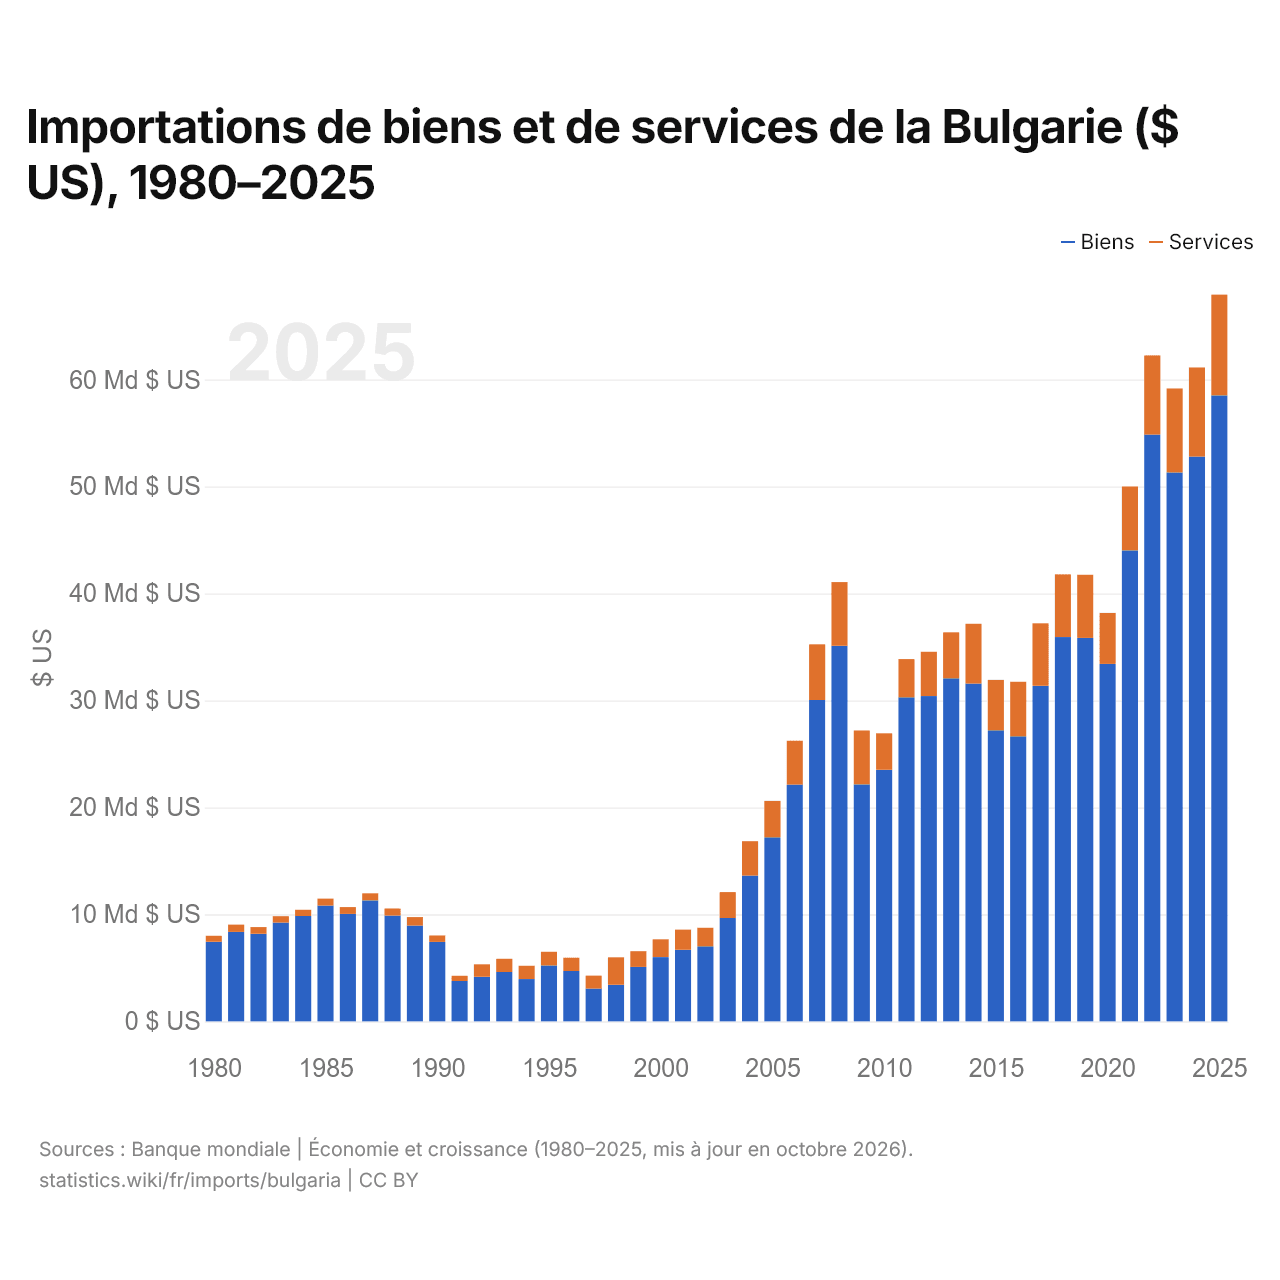
Importations de biens et de services de la Bulgarie ($ US), 1980–2025
| Année | $ US | |
|---|---|---|
| Biens | Services | |
| 2025 | 58 513 210 000 $ US | 9 420 890 000 $ US |
| 2024 | 52 792 560 000 $ US | 8 334 950 000 $ US |
| 2023 | 51 313 690 000 $ US | 7 844 530 000 $ US |
| 2022 | 54 857 210 000 $ US | 7 399 340 000 $ US |
| 2021 | 44 026 020 000 $ US | 5 973 710 000 $ US |
| 2020 | 33 416 930 000 $ US | 4 764 760 000 $ US |
| 2019 | 35 847 700 000 $ US | 5 903 490 000 $ US |
| 2018 | 35 922 560 000 $ US | 5 861 520 000 $ US |
| 2017 | 31 364 930 000 $ US | 5 842 370 000 $ US |
| 2016 | 26 644 460 000 $ US | 5 102 840 000 $ US |
| 2015 | 27 210 600 000 $ US | 4 712 750 000 $ US |
| 2014 | 31 577 860 000 $ US | 5 590 100 000 $ US |
| 2013 | 32 069 950 000 $ US | 4 295 790 000 $ US |
| 2012 | 30 407 630 000 $ US | 4 142 760 000 $ US |
| 2011 | 30 293 350 000 $ US | 3 567 650 000 $ US |
| 2010 | 23 520 630 000 $ US | 3 410 420 000 $ US |
| 2009 | 22 153 280 167 $ US | 5 034 427 678 $ US |
| 2008 | 35 108 727 415 $ US | 5 957 716 144 $ US |
| 2007 | 30 040 951 021 $ US | 5 202 268 997 $ US |
| 2006 | 22 129 515 500 $ US | 4 105 572 674 $ US |
| 2005 | 17 204 395 498 $ US | 3 403 822 881 $ US |
| 2004 | 13 619 145 481 $ US | 3 219 136 624 $ US |
| 2003 | 9 657 287 789 $ US | 2 428 695 335 $ US |
| 2002 | 7 012 584 817 $ US | 1 739 681 325 $ US |
| 2001 | 6 693 401 942 $ US | 1 882 276 103 $ US |
| 2000 | 6 000 151 670 $ US | 1 669 638 981 $ US |
| 1999 | 5 087 383 597 $ US | 1 474 101 520 $ US |
| 1998 | 3 421 373 000 $ US | 2 567 955 639 $ US |
| 1997 | 3 059 100 000 $ US | 1 213 500 000 $ US |
| 1996 | 4 702 600 000 $ US | 1 245 900 000 $ US |
| 1995 | 5 224 000 000 $ US | 1 277 900 000 $ US |
| 1994 | 3 951 900 000 $ US | 1 246 100 000 $ US |
| 1993 | 4 611 900 000 $ US | 1 229 300 000 $ US |
| 1992 | 4 168 700 000 $ US | 1 165 200 000 $ US |
| 1991 | 3 769 000 000 $ US | 485 800 000 $ US |
| 1990 | 7 427 000 000 $ US | 600 000 000 $ US |
| 1989 | 8 960 000 000 $ US | 785 000 000 $ US |
| 1988 | 9 889 000 000 $ US | 656 000 000 $ US |
| 1987 | 11 308 000 000 $ US | 661 000 000 $ US |
| 1986 | 10 045 000 000 $ US | 631 000 000 $ US |
| 1985 | 10 818 000 000 $ US | 654 000 000 $ US |
| 1984 | 9 849 000 000 $ US | 581 000 000 $ US |
| 1983 | 9 235 000 000 $ US | 598 000 000 $ US |
| 1982 | 8 184 000 000 $ US | 630 000 000 $ US |
| 1981 | 8 360 000 000 $ US | 683 000 000 $ US |
| 1980 | 7 445 000 000 $ US | 549 000 000 $ US |
En 2025, les importations de biens de la Bulgarie s'élevaient à 58,5 milliards de dollars et celles de services à 9,42 milliards de dollars ; les services représentaient 13,9 % du total, contre 6,9 % en 1980.
La Bulgarie dans le classement mondial des importations, 2025







Importations de biens et services de la Bulgarie, % du PIB, 1980–2025
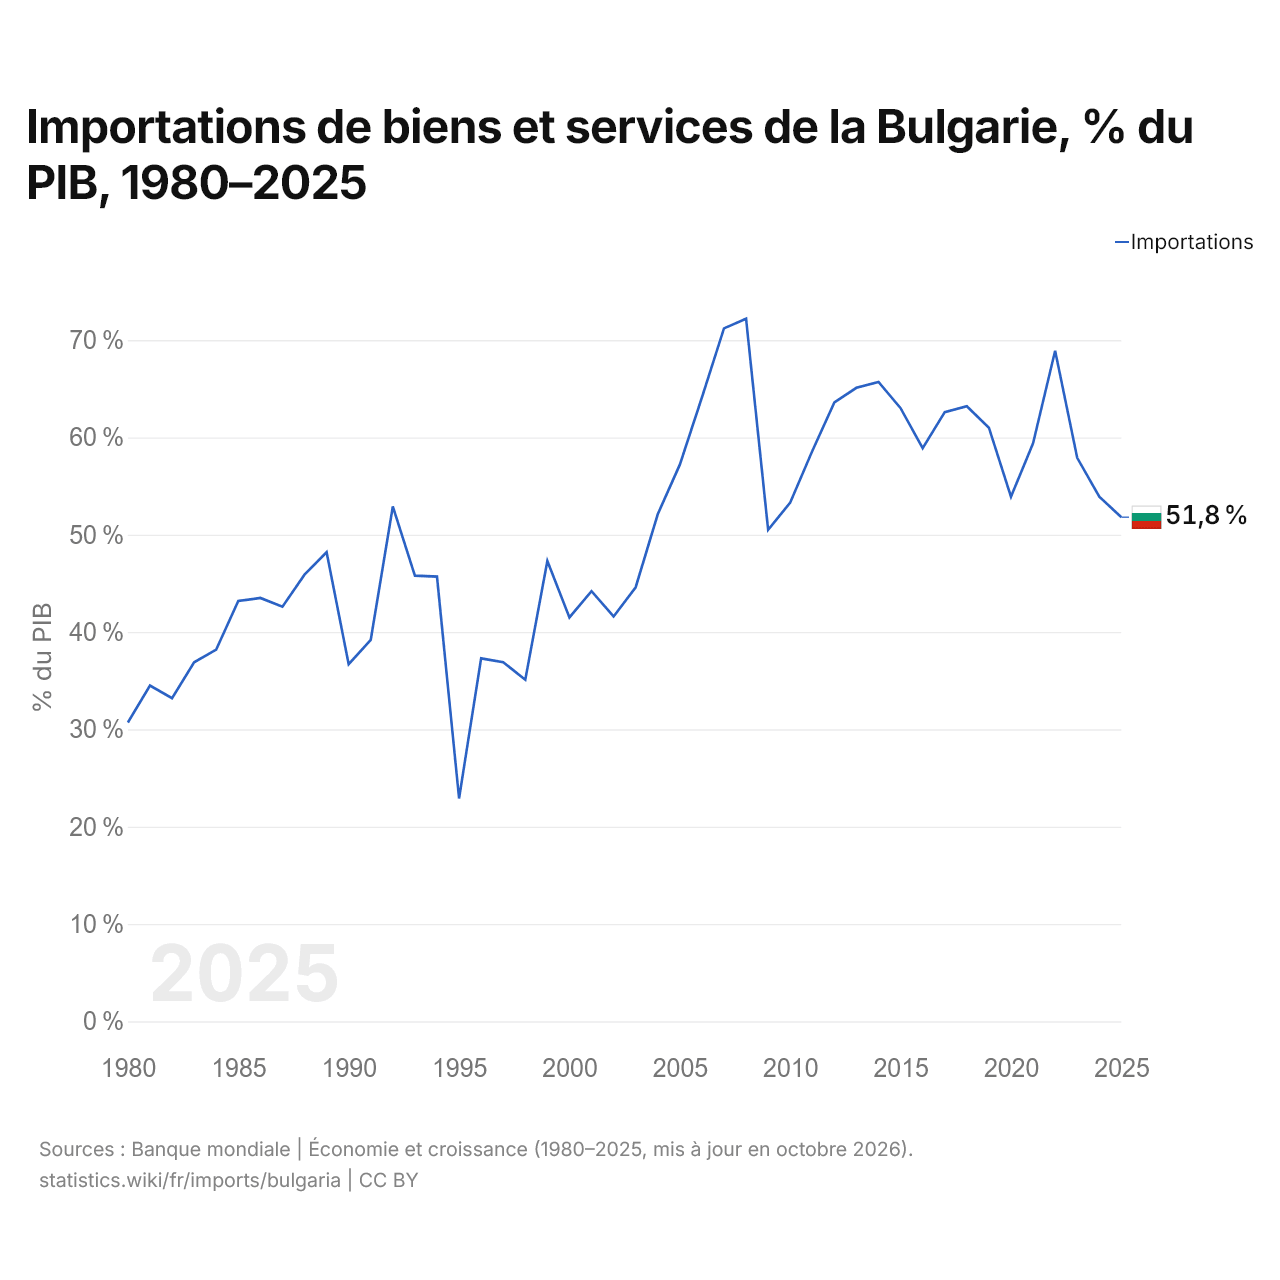
En 2025, les importations de biens et services de la Bulgarie équivalaient à 51,8 % de son PIB, contre 30,7 % en 1980. La part la plus élevée a été de 72,2 %, en 2008.
Comparer les importations de la Bulgarie avec celles d'autres pays
Sources :
- TradeMap (2001–2025, mis à jour en octobre 2026)
- Banque mondiale | Économie et croissance (1980–2025, mis à jour en octobre 2026)
Creative Commons Attribution (CC BY) : vous pouvez copier, partager, adapter et réutiliser ce contenu, y compris à des fins commerciales, à condition de citer statistics.wiki et d’indiquer les modifications apportées. Les sources citées ci-dessus peuvent avoir leurs propres conditions de licence.