
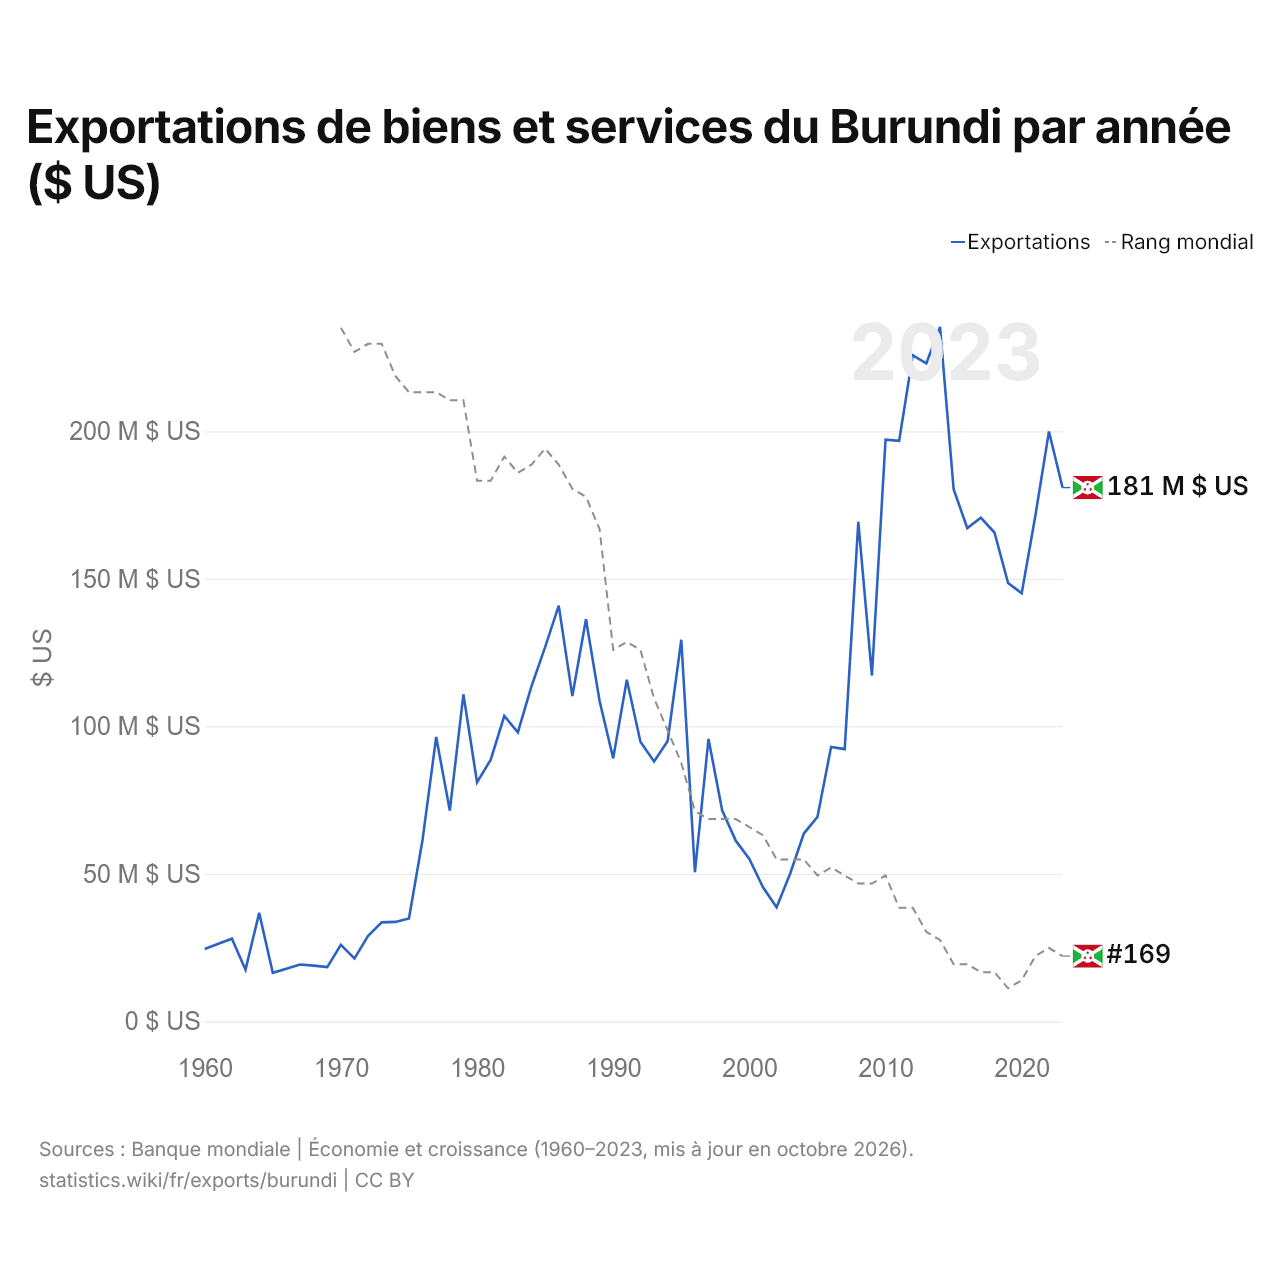
Exportations de biens et services du Burundi par année ($ US)
| Année | $ US | Rang mondial |
|---|---|---|
| Exportations | Rang mondial | |
| 2023 | 180 858 656 $ US | #169 |
| 2022 | 199 874 785 $ US | #168 |
| 2021 | 171 266 332 $ US | #169 |
| 2020 | 145 048 515 $ US | #172 |
| 2019 | 148 517 990 $ US | #173 |
| 2018 | 165 646 501 $ US | #171 |
| 2017 | 170 634 148 $ US | #171 |
| 2016 | 167 152 737 $ US | #170 |
| 2015 | 180 359 586 $ US | #170 |
| 2014 | 235 299 259 $ US | #167 |
| 2013 | 222 981 539 $ US | #166 |
| 2012 | 225 667 152 $ US | #163 |
| 2011 | 196 751 540 $ US | #163 |
| 2010 | 197 117 147 $ US | #159 |
| 2009 | 117 182 677 $ US | #160 |
| 2008 | 169 242 769 $ US | #160 |
| 2007 | 92 221 560 $ US | #159 |
| 2006 | 92 956 381 $ US | #158 |
| 2005 | 69 261 013 $ US | #159 |
| 2004 | 63 635 538 $ US | #157 |
| 2003 | 50 072 047 $ US | #157 |
| 2002 | 38 676 371 $ US | #157 |
| 2001 | 45 410 971 $ US | #154 |
| 2000 | 55 005 759 $ US | #153 |
| 1999 | 61 217 971 $ US | #152 |
| 1998 | 71 499 426 $ US | #152 |
| 1997 | 95 688 946 $ US | #152 |
| 1996 | 50 580 560 $ US | #151 |
| 1995 | 129 318 804 $ US | #145 |
| 1994 | 95 016 969 $ US | #141 |
| 1993 | 88 062 144 $ US | #137 |
| 1992 | 94 756 921 $ US | #131 |
| 1991 | 115 775 316 $ US | #130 |
| 1990 | 89 130 244 $ US | #131 |
| 1989 | 108 560 194 $ US | #116 |
| 1988 | 136 282 900 $ US | #112 |
| 1987 | 110 260 312 $ US | #111 |
| 1986 | 140 881 025 $ US | #108 |
| 1985 | 126 803 836 $ US | #106 |
| 1984 | 113 561 106 $ US | #108 |
| 1983 | 97 956 966 $ US | #109 |
| 1982 | 103 470 000 $ US | #107 |
| 1981 | 88 603 333 $ US | #110 |
| 1980 | 81 022 222 $ US | #110 |
| 1979 | 110 822 222 $ US | #100 |
| 1978 | 71 443 333 $ US | #100 |
| 1977 | 96 342 222 $ US | #99 |
| 1976 | 61 551 304 $ US | #99 |
| 1975 | 34 839 365 $ US | #99 |
| 1974 | 33 674 921 $ US | #97 |
| 1973 | 33 526 569 $ US | #93 |
| 1972 | 28 961 143 $ US | #93 |
| 1971 | 21 329 143 $ US | #94 |
| 1970 | 25 945 143 $ US | #91 |
| 1969 | 18 371 429 $ US | - |
| 1968 | 18 861 714 $ US | - |
| 1967 | 19 257 143 $ US | - |
| 1966 | 17 828 571 $ US | - |
| 1965 | 16 452 741 $ US | - |
| 1964 | 36 750 000 $ US | - |
| 1963 | 17 500 000 $ US | - |
| 1962 | 28 000 000 $ US | - |
| 1961 | 26 250 000 $ US | - |
| 1960 | 24 499 998 $ US | - |
Les exportations de biens et services du Burundi s'élèvent à 181 millions de dollars (2023), contre 24,5 millions de dollars en 1960. Le maximum a été de 235 millions de dollars, en 2014. Elles se classent au 169e rang mondial, en baisse par rapport au 168e rang l'année précédente. Leur meilleur rang a été le 91e, occupé pour la dernière fois en 1970.
Les exportations de biens et services du Burundi sont les 48es plus élevées de 50 pays situés en Afrique. Les importations de biens et services du Burundi s'élèvent à 836 millions de dollars (2023), au 163e rang mondial. Les importations du Burundi dépassent ses exportations de 655 millions de dollars, soit un déficit commercial (2023).
Exportations de biens du Burundi par catégorie, 2025
Exportations de biens, 2025: 341 M $US
En 2025, la première catégorie des exportations de biens du Burundi était « métaux précieux, pierres précieuses, bijoux, montres, instruments de musique et art », avec 40,6 %, suivie de « cultures, plantes et fleurs (céréales, fruits, légumes, café, oléagineux) », avec 31,1 %.
Destinations des exportations de biens du Burundi : les 10 premières, 2025
| Rang | Pays | Exportations de biens | Part | |
|---|---|---|---|---|
| 1 |
 EAU |
121 M $US | 35,6 % | |
| 2 |
 RDC |
45,8 M $US | 13,4 % | |
| 3 |
 Belgique |
16,1 M $US | 4,71 % | |
| 4 |
 Suisse |
10,8 M $US | 3,16 % | |
| 5 |
 Chine |
10,4 M $US | 3,06 % | |
| 6 |
 Allemagne |
8,22 M $US | 2,41 % | |
| 7 |
 Soudan |
7,57 M $US | 2,22 % | |
| 8 |
 Oman |
4,80 M $US | 1,41 % | |
| 9 |
 Tanzanie |
3,33 M $US | 0,98 % | |
| 10 |
 Canada |
3,15 M $US | 0,92 % | |
| Autres partenaires et non précisés | 110 M $US | 32,2 % |
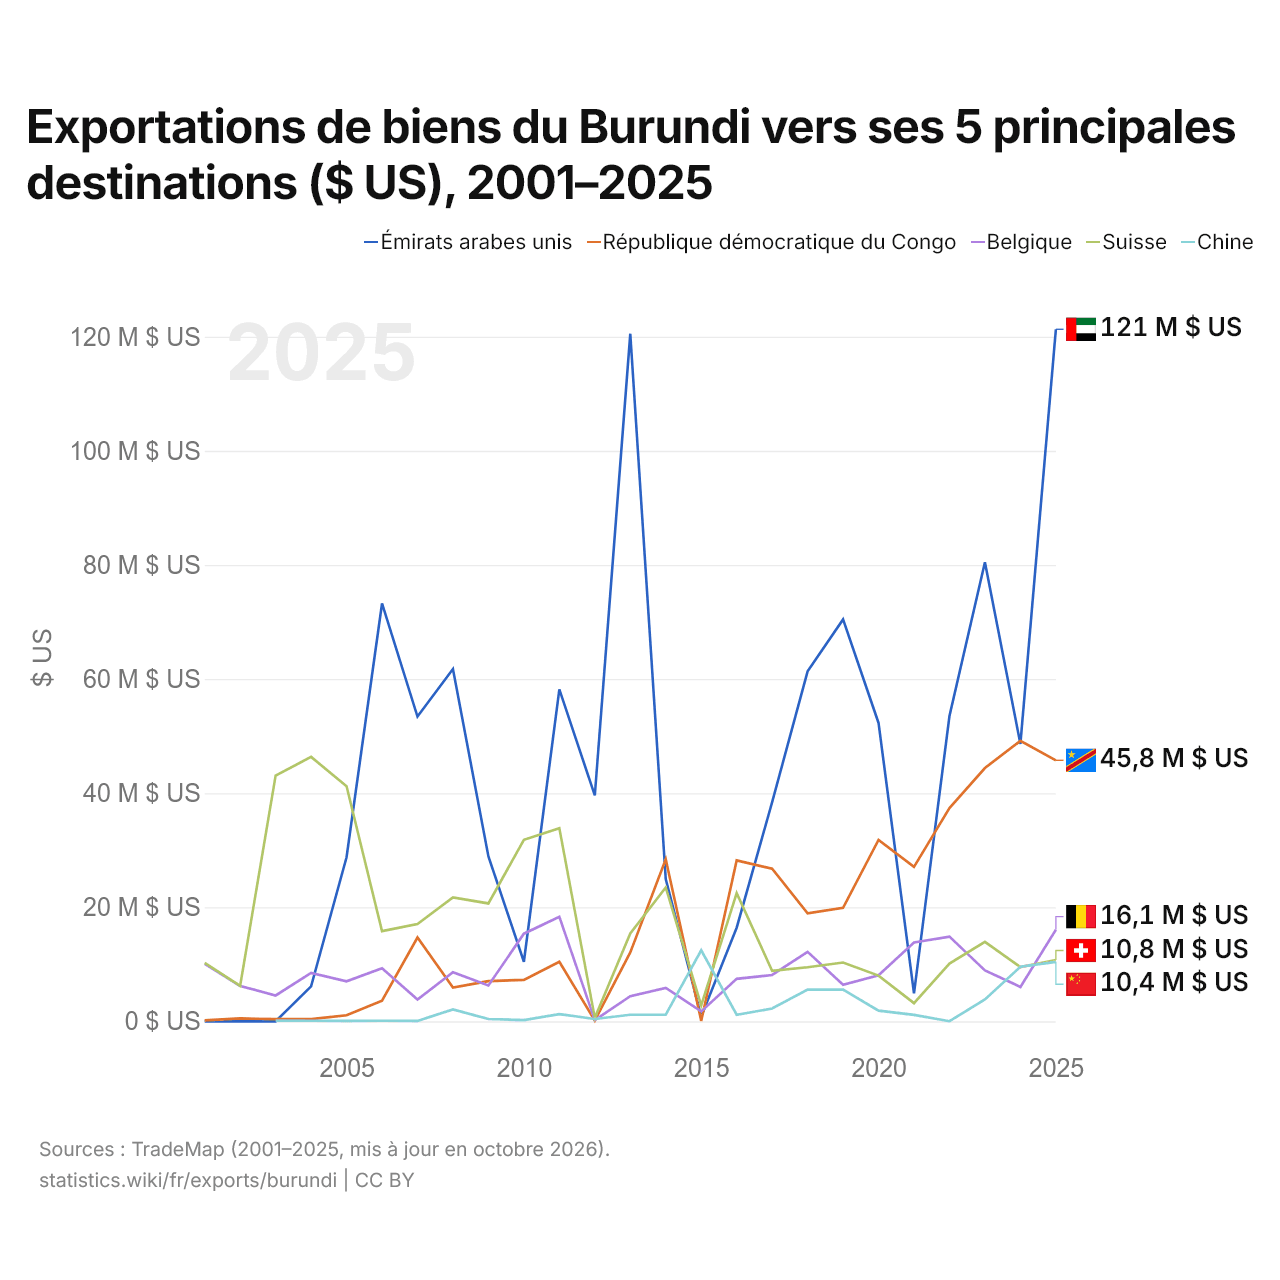
Exportations de biens du Burundi vers ses 5 principales destinations ($ US), 2001–2025
| Année | $ US | ||||
|---|---|---|---|---|---|
| Émirats arabes unis | République démocratique du Congo | Belgique | Suisse | Chine | |
| 2025 | 121 304 000 $ US | 45 751 000 $ US | 16 060 000 $ US | 10 761 000 $ US | 10 434 000 $ US |
| 2024 | 48 625 000 $ US | 49 157 000 $ US | 6 028 000 $ US | 9 519 000 $ US | 9 560 000 $ US |
| 2023 | 80 457 000 $ US | 44 409 000 $ US | 8 933 000 $ US | 13 920 000 $ US | 3 835 000 $ US |
| 2022 | 53 517 000 $ US | 37 393 000 $ US | 14 855 000 $ US | 10 111 000 $ US | 23 000 $ US |
| 2021 | 4 906 000 $ US | 27 074 000 $ US | 13 813 000 $ US | 3 189 000 $ US | 1 128 000 $ US |
| 2020 | 52 304 000 $ US | 31 809 000 $ US | 8 082 000 $ US | 8 013 000 $ US | 1 873 000 $ US |
| 2019 | 70 452 000 $ US | 19 904 000 $ US | 6 421 000 $ US | 10 313 000 $ US | 5 550 000 $ US |
| 2018 | 61 357 000 $ US | 18 923 000 $ US | 12 175 000 $ US | 9 478 000 $ US | 5 577 000 $ US |
| 2017 | 38 406 000 $ US | 26 744 000 $ US | 8 122 000 $ US | 8 865 000 $ US | 2 239 000 $ US |
| 2016 | 16 413 000 $ US | 28 211 000 $ US | 7 454 000 $ US | 22 469 000 $ US | 1 153 000 $ US |
| 2015 | 837 000 $ US | 80 000 $ US | 1 740 000 $ US | 2 810 000 $ US | 12 462 000 $ US |
| 2014 | 24 944 000 $ US | 28 400 000 $ US | 5 863 000 $ US | 23 471 000 $ US | 1 183 000 $ US |
| 2013 | 120 523 000 $ US | 12 079 000 $ US | 4 399 000 $ US | 15 399 000 $ US | 1 161 000 $ US |
| 2012 | 39 596 000 $ US | 141 000 $ US | 213 000 $ US | 605 000 $ US | 413 000 $ US |
| 2011 | 58 190 000 $ US | 10 434 000 $ US | 18 317 000 $ US | 33 866 000 $ US | 1 269 000 $ US |
| 2010 | 10 450 000 $ US | 7 269 000 $ US | 15 364 000 $ US | 31 815 000 $ US | 222 000 $ US |
| 2009 | 28 903 000 $ US | 7 039 000 $ US | 6 292 000 $ US | 20 666 000 $ US | 401 000 $ US |
| 2008 | 61 750 000 $ US | 5 921 000 $ US | 8 598 000 $ US | 21 736 000 $ US | 2 081 000 $ US |
| 2007 | 53 418 000 $ US | 14 690 000 $ US | 3 803 000 $ US | 17 042 000 $ US | 76 000 $ US |
| 2006 | 73 248 000 $ US | 3 602 000 $ US | 9 303 000 $ US | 15 802 000 $ US | 97 000 $ US |
| 2005 | 28 754 000 $ US | 1 065 000 $ US | 7 019 000 $ US | 41 219 000 $ US | 88 000 $ US |
| 2004 | 6 129 000 $ US | 379 000 $ US | 8 475 000 $ US | 46 344 000 $ US | 109 000 $ US |
| 2003 | 2 000 $ US | 376 000 $ US | 4 537 000 $ US | 43 086 000 $ US | 114 000 $ US |
| 2002 | 4 000 $ US | 507 000 $ US | 6 199 000 $ US | 6 225 000 $ US | - |
| 2001 | 2 000 $ US | 172 000 $ US | 10 089 000 $ US | 10 228 000 $ US | - |
En 2025, les exportations de biens s'élevaient à 121 millions de dollars vers les Émirats arabes unis, 45,8 millions de dollars vers la République démocratique du Congo, 16,1 millions de dollars vers la Belgique, 10,8 millions de dollars vers la Suisse et 10,4 millions de dollars vers la Chine. Le changement le plus récent dans leur ordre remonte à 2025, quand les exportations du Burundi vers les Émirats arabes unis ont dépassé celles vers la République démocratique du Congo.
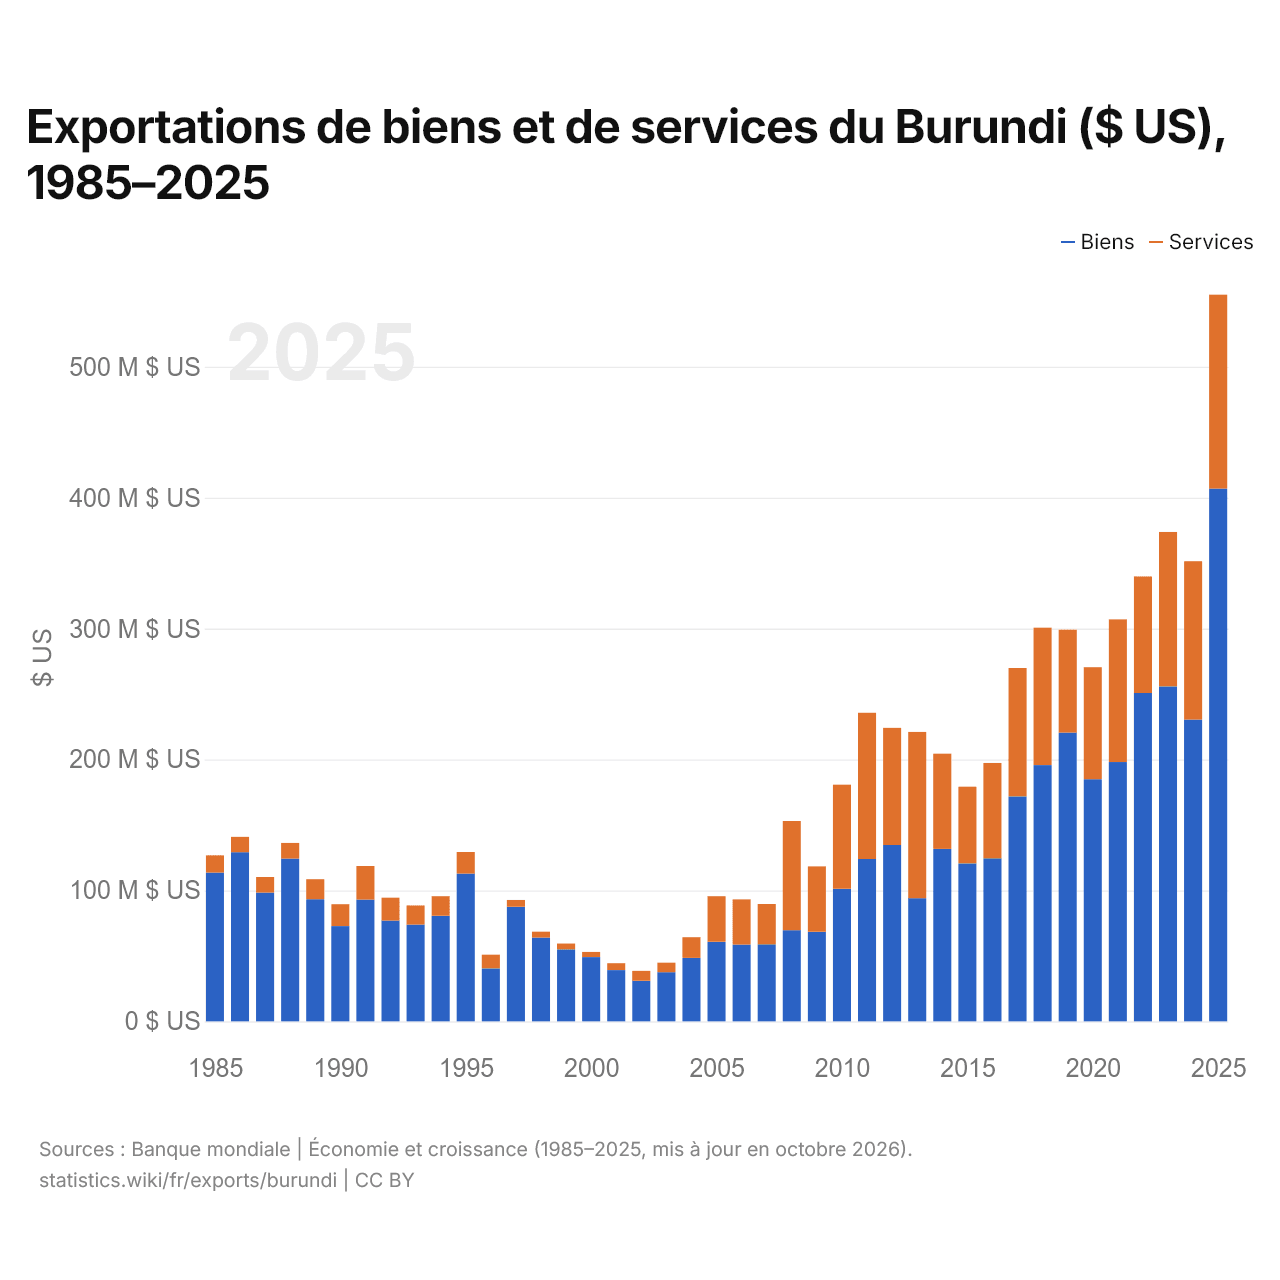
Exportations de biens et de services du Burundi ($ US), 1985–2025
| Année | $ US | |
|---|---|---|
| Biens | Services | |
| 2025 | 406 909 496 $ US | 148 118 951 $ US |
| 2024 | 230 417 438 $ US | 121 004 540 $ US |
| 2023 | 255 841 244 $ US | 117 939 546 $ US |
| 2022 | 250 791 956 $ US | 88 998 704 $ US |
| 2021 | 198 045 066 $ US | 109 000 087 $ US |
| 2020 | 184 938 290 $ US | 85 524 258 $ US |
| 2019 | 220 480 572 $ US | 78 647 579 $ US |
| 2018 | 195 699 797 $ US | 105 005 053 $ US |
| 2017 | 171 805 728 $ US | 98 046 504 $ US |
| 2016 | 124 526 992 $ US | 72 809 390 $ US |
| 2015 | 120 619 043 $ US | 58 580 377 $ US |
| 2014 | 131 729 621 $ US | 72 705 937 $ US |
| 2013 | 94 050 455 $ US | 127 011 166 $ US |
| 2012 | 134 698 608 $ US | 89 458 715 $ US |
| 2011 | 123 982 005 $ US | 111 682 403 $ US |
| 2010 | 101 236 294 $ US | 79 491 556 $ US |
| 2009 | 68 414 018 $ US | 49 931 995 $ US |
| 2008 | 69 648 173 $ US | 83 324 250 $ US |
| 2007 | 58 836 291 $ US | 30 795 299 $ US |
| 2006 | 58 676 451 $ US | 34 491 171 $ US |
| 2005 | 60 801 764 $ US | 34 792 617 $ US |
| 2004 | 48 482 605 $ US | 15 775 820 $ US |
| 2003 | 37 528 126 $ US | 7 307 273 $ US |
| 2002 | 31 015 983 $ US | 7 511 046 $ US |
| 2001 | 39 154 898 $ US | 5 231 387 $ US |
| 2000 | 49 052 599 $ US | 3 975 033 $ US |
| 1999 | 54 983 254 $ US | 4 441 388 $ US |
| 1998 | 64 030 790 $ US | 4 451 434 $ US |
| 1997 | 87 472 477 $ US | 5 229 447 $ US |
| 1996 | 40 413 327 $ US | 10 520 347 $ US |
| 1995 | 112 889 503 $ US | 16 447 955 $ US |
| 1994 | 80 653 045 $ US | 14 925 048 $ US |
| 1993 | 73 861 109 $ US | 14 642 887 $ US |
| 1992 | 76 955 328 $ US | 17 470 732 $ US |
| 1991 | 92 957 743 $ US | 25 656 623 $ US |
| 1990 | 72 750 984 $ US | 16 688 523 $ US |
| 1989 | 93 245 798 $ US | 15 315 126 $ US |
| 1988 | 124 356 280 $ US | 11 923 502 $ US |
| 1987 | 98 337 836 $ US | 11 912 871 $ US |
| 1986 | 129 139 530 $ US | 11 736 772 $ US |
| 1985 | 113 645 826 $ US | 13 157 595 $ US |
En 2025, les exportations de biens du Burundi s'élevaient à 407 millions de dollars et celles de services à 148 millions de dollars ; les services représentaient 26,7 % du total, contre 10,4 % en 1985.
Le Burundi dans le classement mondial des exportations
| Rang | Pays | Exportations | Part mondiale | |
|---|---|---|---|---|
| 166 |
 Gambie |
330 M $US (2025) | <0,001 % | |
| 167 |
 Vanuatu |
329 M $US (2024) | 0,001 % | |
| 168 |
 Timor oriental |
197 M $US (2024) | <0,001 % | |
| 169 |
 Burundi |
181 M $US | <0,001 % | |
| 170 |
 Comores |
169 M $US (2025) | <0,001 % | |
| 171 |
 Sao Tomé |
130 M $US (2025) | <0,001 % | |
| 172 |
 Îles Marshall |
111 M $US (2025) | <0,001 % |
Exportations de biens et services du Burundi, % du PIB
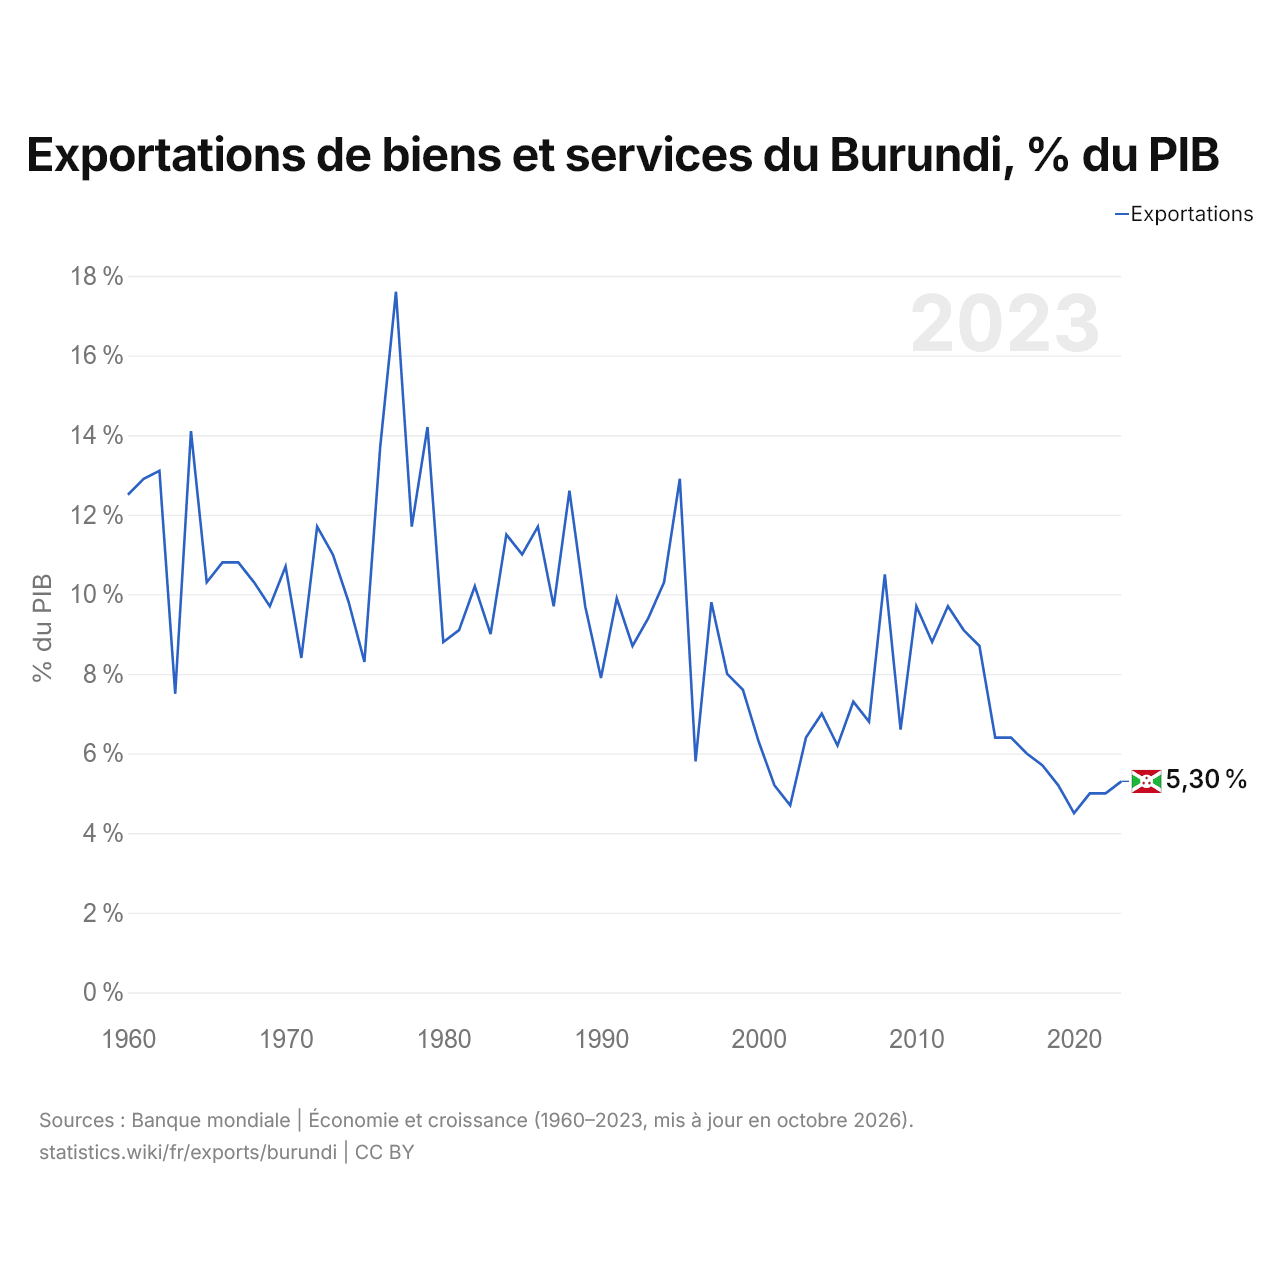
Les exportations de biens et services du Burundi équivalent à 5,3 % de son PIB (2023), contre 12,5 % en 1960. La part la plus élevée a été de 17,6 %, en 1977.
Comparer les exportations du Burundi avec celles d'autres pays
Sources :
- Banque mondiale | Économie et croissance (1960–2025, mis à jour en octobre 2026)
- TradeMap (2001–2025, mis à jour en octobre 2026)
Creative Commons Attribution (CC BY) : vous pouvez copier, partager, adapter et réutiliser ce contenu, y compris à des fins commerciales, à condition de citer statistics.wiki et d’indiquer les modifications apportées. Les sources citées ci-dessus peuvent avoir leurs propres conditions de licence.